

Abstract
Background
Automated individualized risk prediction tools linked to electronic health records (EHRs) are not available for management of patients with peripheral arterial disease. The goal of this study was to create a prognostic tool for patients with peripheral arterial disease using data elements automatically extracted from an EHR to enable real‐time and individualized risk prediction at the point of care.
Methods and Results
A previously validated phenotyping algorithm was deployed to an EHR linked to the Rochester Epidemiology Project to identify peripheral arterial disease cases from Olmsted County, MN, for the years 1998 to 2011. The study cohort was composed of 1676 patients: 593 patients died over 5‐year follow‐up. The c‐statistic for survival in the overall data set was 0.76 (95% confidence interval [CI], 0.74–0.78), and the c‐statistic across 10 cross‐validation data sets was 0.75 (95% CI, 0.73–0.77). Stratification of cases demonstrated increasing mortality risk by subgroup (low: hazard ratio, 0.35 [95% CI, 0.21–0.58]; intermediate‐high: hazard ratio, 2.98 [95% CI, 2.37–3.74]; high: hazard ratio, 8.44 [95% CI, 6.66–10.70], all P<0.0001 versus the reference subgroup). An equation for risk calculation was derived from Cox model parameters and β estimates. Big data infrastructure enabled deployment of the real‐time risk calculator to the point of care via the EHR.
Conclusions
This study demonstrates that electronic tools can be deployed to EHRs to create automated real‐time risk calculators to predict survival of patients with peripheral arterial disease. Moreover, the prognostic model developed may be translated to patient care as an automated and individualized real‐time risk calculator deployed at the point of care.
Keywords: electronic health record, peripheral artery disease, prognosis
Subject Categories: Quality and Outcomes
Short abstract
See Editorial by https://10.1161/JAHA.118.011184
Clinical Perspective
What Is New?
This study demonstrates that electronic tools can be deployed to electronic health records to create automated real‐time risk calculators to predict survival of patients with peripheral artery disease.
What Are the Clinical Implications?
The prognostic model developed may be translated to patient care as an automated and individualized real‐time risk calculator deployed at the point of care in electronic health records.
Introduction
For aging individuals with multiple health conditions, the identification and integration of prognostic information into decision‐making during patient encounters is challenging as relevant data embedded in the medical record must be retrieved, summarized, and analyzed.1 To promote timely updates to clinical practice and to leverage current computing technologies, a 2017 American Heart Association scientific statement recommended that clinical decision support (CDS) tools be developed that use real‐time, patient‐specific risk prediction models utilizing clinical data automatically extracted from electronic health records (EHRs).1
Models from longitudinal cohorts have been successfully deployed to EHRs to estimate cardiovascular risk.2, 3, 4 In the United States, automated calculators for cardiovascular risk are available in commercially available EHR systems. Experience with a CDS system that automatically calculates cardiovascular risk and provides guideline recommendations based on patient‐specific data from an EHR has been reported.5 This CDS tool saved time and improved efficiency and accuracy of risk calculation as well as delivery of guideline‐recommended strategies by providers.5 In the United Kingdom, the QRISK3 automated calculator for cardiovascular risk is available online3, 6 and in EHR systems. However, information from EHRs has not been previously used to derive risk prediction tools for patients with PAD.
PAD affects millions of adults worldwide7, 8, 9 with associated high morbidity and high risk for all‐cause and cardiovascular mortality.9, 10, 11, 12, 13 However, few prognostic risk models have been developed for patients with PAD.12, 14, 15 Furthermore, these models have been limited to highly selected subgroups and not widely adopted in practice.12, 14, 15 Hence, there is need for risk stratification models as well as tools that may be deployed to EHRs for patients with PAD encountered in usual practice to support timely, efficient, and informed clinical decision‐making. Accordingly, the goal of this study was to use automated phenotyping algorithms for extraction of data elements from an EHR to support creation of a new prognostic model and individualized real‐time risk prediction tool for patients with PAD that may be deployed via the EHR at the point of care.
Methods
Rochester Epidemiology Project
An observational PAD inception cohort was assembled from the geographically defined population of Olmsted County, MN, using the medical records linkage system of the Rochester Epidemiology Project (REP). The REP linkage system matches medical records of participating institutions to specific individuals and assigns unique identification numbers for each person, which enables health records to be electronically retrieved.16 Participating healthcare institutions of the REP include the Mayo Clinic and Mayo Clinic Hospitals and Olmsted Medical Center and affiliated hospital. These institutions provide demographic information (name, sex, date of birth, address), provider‐specific identification number, and diagnostic codes. Diagnostic codes are stored in electronic REP indexes after linkage to corresponding participants. The REP also provides access to the full text of medical records for all participants.
This study was approved by the institutional review boards of the participating institutions. All patients agreed to have their medical records used for research, and the institutional review boards waived the need for informed consent. The data, analytic methods, and study materials will not be made available to other researchers for purposes of reproducing the results or replicating the procedure.
Identification of Study Cohort
A previously validated electronic billing code algorithm for detection of patients with PAD was used to identify the patient cohort.17 A list of all codes used for this algorithm has been previously published.17 Steps for building the cohort included: (1) identification of all Olmsted County residents with at least 1 PAD‐related billing code from 1998 to 2011; (2) application of the billing code algorithm17 to the medical records of those individuals identified in step 1; and (3) confirmation of suspected PAD cases identified in step 2 as definite PAD cases by automated abstraction of metrics of noninvasive lower extremity arterial evaluation including standardized ankle‐brachial index (ABI) protocols8 (Figure 1).
Figure 1.
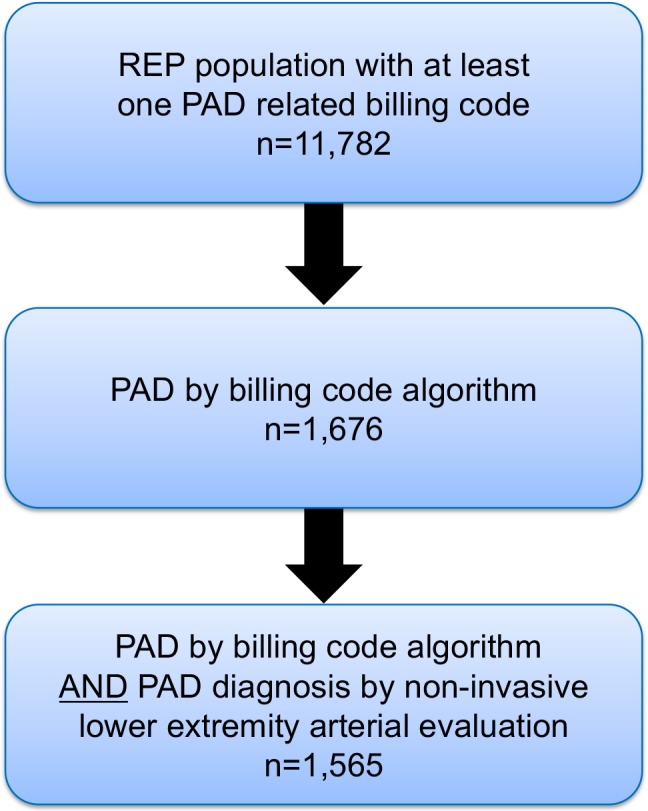
Process for identification of study cohort. PAD indicates peripheral artery disease; REP, Rochester Epidemiology Project.
Outcome
The primary outcome was all‐cause mortality within 5 years of follow‐up assessed by time‐to‐event analysis by Cox proportional hazards regression. For ascertainment of death, the resources of the REP were used to capture death information from multiple sources including electronic Minnesota state death certificates and the National Death Index.16 Individuals who died within 5 years were counted as events at the corresponding time. Individuals who died beyond 5 years were censored at 5 years. As the goal was to evaluate outcomes over 5 years, the subgroup of patients who were last known to be alive but followed for <5 years were excluded (n=122).
Noninvasive Low Extremity Arterial Evaluation
The subset of the overall study group identified by the billing code algorithm who had also undergone noninvasive evaluation for lower extremity PAD by ABI comprised a digital data set (n=1565) that was electronically mined for metrics to confirm the diagnosis of PAD as well as key words for poorly compressible arteries (PCAs).8, 18 PAD was defined by standard criteria as an ABI ≤0.9 at rest or 1 minute after exercise or by the presence of PCA7, 8, 9, 18 defined as ABI ≥1.40.8, 9, 18
Comorbidities and Medications
All comorbidities used in the comorbidity index developed by Charlson et al19 and adapted to electronic algorithms using International Classification of Diseases, Ninth Revision (ICD‐9), codes20 were identified by electronic algorithms. These comorbidities included diabetes mellitus, chronic pulmonary disease, renal disease, prior myocardial infarction, history of heart failure, cerebrovascular disease, connective tissue or rheumatologic disease, peptic ulcer, hemiplegia, metastatic solid tumor, dementia, and other cancer and liver disease (for ICD‐9 codes see Table S1). Comorbidities were diagnosed either before or at the date of PAD diagnosis. Limb revascularization procedures including open surgical or endovascular interventions were retrieved using procedural codes.17 Current smoking was ascertained from EHRs by previously validated electronic21 algorithms supplemented by manual abstraction. Medications (aspirin, statins, angiotensin‐converting enzyme inhibitors, angiotensin receptor blockers) administered within 6 months of study entry were also ascertained electronically or by manual abstraction.
Candidate Variables for the Prognostic Model
The primary indication for inclusion of a variable was expert consensus opinion. Electronic algorithms were developed accordingly and deployed to automatically extract the selected variables from the EHR. The 22 variables evaluated in the model are listed in Table 1 and included age at diagnosis, sex, glomerular filtration rate because chronic kidney disease often coexists with PAD,22 results of noninvasive lower extremity arterial evaluation8 (both ABI metrics and PCAs), and prior limb revascularization (ABI metrics may improve with revascularization).23 Because comorbidities often coexist in patients with PAD,24 all comorbidities from the index developed by Charlson et al19 and adapted to electronic code algorithms by the ICD‐9 were also evaluated.20 Medications recommended by practice guidelines (ie, class IA indication) to reduce cardiovascular events for patients with PAD were also incorporated.9 Results of arterial imaging of the lower extremities were not included. However, results of noninvasive lower extremity arterial evaluation were evaluated in the model. Most study participants (94%) were non‐Hispanic whites with numbers too small to evaluate potential effects of race and ethnicity, which were not included. Angiotensin‐converting enzyme inhibitor and angiotensin receptor blocker therapy were not included in the model as they do not have a class IA indication for secondary prevention in patients with PAD.
Table 1.
Baseline Characteristics of Patients With PAD
| Variable | Overall Cohort (n=1676) |
|---|---|
| Age at diagnosis, mean (SD), y | 71.5 (13.2) |
| Female sex, No. (%) | 755 (45) |
| GFR, mean (SD) | 55 (21.1) |
| Current smoker, No. (%) | 429 (26) |
| Prior limb revascularization, No. (%) | 235 (14) |
| PCAs, No. (%) | 364 (22) |
| ABI value, mean (SD) | 0.8 (0.3) |
| Comorbidities, No. (%) | |
| Diabetes mellitus | 704 (42) |
| Chronic pulmonary disease | 834 (50) |
| Renal disease | 447 (27) |
| Prior myocardial infarction | 466 (28) |
| Heart failure | 515 (31) |
| Cerebrovascular disease | 660 (39) |
| Connective tissue or rheumatologic disease | 181 (11) |
| Peptic ulcer | 318 (19) |
| Hemiplegia | 98 (6) |
| Metastatic solid tumor | 100 (6) |
| Other cancer | 648 (39) |
| Dementia | 174 (10) |
| Moderate or severe liver disease | 149 (9) |
| Medications, No. (%) | |
| Antiplatelet agents (aspirin or clopidogrel) | 998 (60) |
| Statin | 746 (45) |
ABI indicates ankle‐brachial index; GFR, glomerular filtration rate; PAD, peripheral artery disease; PCAs, poorly compressible arteries.
Statistical Analysis
Baseline characteristics are summarized as percentage or mean (±SD) or as median (25th–75th percentile). Using Cox proportional hazards regression candidate risk factors were evaluated for association with death. Age was used as a continuous variable starting at age 40 years and an age‐squared term was used to evaluate for a potential nonlinear relationship between age and mortality. The overall fit of the model was greatly enhanced with the inclusion of the age‐squared term. Results are presented as hazard ratios (HRs) and 95% confidence intervals (CIs).
Comorbidities were evaluated utilizing stepwise selection with age and sex adjustment with retention criteria of P<0.05 within each of 10 cross‐validation sets. The number of times each comorbidity variable was selected for the model was tabulated and comorbidities selected most often were carried forward. Remaining variables were considered individually after adjustment for selected comorbidities. The variable PCA, ABI as a continuous variable, and prior limb revascularization were considered for the model. ABI metric values for patients with PCA or prior revascularization were set to 1.0, while unknown resting ABI values were replaced by the overall mean resting ABI value (0.66). Interactions of age and sex with selected variables were evaluated by inclusion of multiplicative interaction terms within the Cox model framework.
The prognostic ability of the model was assessed by discrimination using survival [c] statistics and calibration. c‐Statistics were computed overall and using 10‐fold cross‐validation where estimates were derived after excluding 1 cross‐validation set and then using the model estimates to score the holdout set. This process was repeated 10 times, 1 for each cross‐validation set. The cross‐validation c‐statistic was then computed after combining risk scores across the 10 cross‐validation sets.
Calibration was assessed by stratification of patients into risk groups defined by the model and applying these cut points to each of the cross‐validation sets. Risk subgroups were defined by percentiles as low (<16th), low‐intermediate (16th–50th), intermediate‐high (50th–84th), and high (>84th) to approximate a 1 SD range. For analysis, the low‐intermediate group was considered the reference group. This group was chosen as the referent to enhance precision based on a larger number of events compared with the low‐risk group. The resulting risk groups from the cross‐validation sets were combined and plotted against the risk scores of the entire cohort in order to assess model calibration. Final models presented are based on data from the entire cohort. To further evaluate calibration, a predictiveness curve was created using the methodology suggested by Pepe et al25 Calibration was also evaluated using the method of Poisson regression suggested by Crowson and Therneau.26 Analyses were performed using SAS version 9.4 (SAS Institute), and 2‐sided P<0.05 were considered significant.
Results
An inception cohort of 1676 Olmsted County residents with clinically diagnosed PAD (mean age, 71.5±13.2 years; 755 [45%] women) and complete 5‐year follow‐up was identified. There were 593 deaths during the 5 years of follow‐up. There were 401 patients (24%) with critical limb ischemia, 1090 (65%) with smoking history (ever smokers), 1370 (82%) with hypertension, and 742 (44%) on therapy with angiotensin‐converting enzyme inhibitors or angiotensin receptor blockers. The 22 clinical variables considered for inclusion in the prognostic model are summarized in Table 1.
Prognostic Model
In the overall data set, the c‐statistic was 0.76 (95% CI, 0.74–0.78) and across the 10 cross‐validation data sets the c‐statistic was 0.75 (95% CI, 0.73–0.77). The variables that were predictors for mortality are summarized in Table 2. Five comorbidities reached statistical significance by stepwise selection and included diabetes mellitus, chronic pulmonary disease, renal disease, heart failure, and dementia. Statin therapy had a protective effect and was the only medication that reached statistical significance. Aspirin was evaluated in the model but did not reach statistical significance (HR, 1.1; 95% CI, 0.9–1.3 [P=0.27]). In ancillary analysis, the model was tested for age and sex interactions with each variable and no significant interaction effects were observed. In ancillary analysis we refitted our final model for the cohort including the subgroup of 122 patients and the HR estimates were similar.
Table 2.
Prognostic Model for 5‐Year Mortality
| Variable | β Estimate | HR | 95% CI | P Value |
|---|---|---|---|---|
| Age* | −0.039 | 0.96 | 0.74–1.26 | 0.78 |
| Age2* | 0.076 | 1.08 | 1.04–1.12 | 0.0002 |
| Female sex | −0.165 | 0.85 | 0.72–1.00 | 0.06 |
| Prior limb revascularization | 0.461 | 1.59 | 1.24–2.02 | 0.0002 |
| Poorly compressible arteries | 0.566 | 1.76 | 1.40–2.22 | <0.0001 |
| ABI value (continuous) per 0.1 | −0.074 | 0.93 | 0.89–0.97 | 0.0007 |
| Diabetes mellitus | 0.321 | 1.38 | 1.16–1.64 | 0.0003 |
| Chronic pulmonary disease | 0.332 | 1.39 | 1.18–1.65 | 0.0001 |
| Renal disease | 0.414 | 1.51 | 1.27–1.80 | <0.0001 |
| Heart failure | 0.634 | 1.89 | 1.58–2.24 | <0.0001 |
| Dementia | 0.562 | 1.76 | 1.43–2.16 | <0.0001 |
| Statin therapy | −0.383 | 0.68 | 0.57–0.81 | <0.0001 |
| Unknown ABI value | 0.235 | 1.26 | 0.92–1.73 | 0.14 |
ABI indicates ankle‐brachial index; CI, confidence interval; HR, hazard ratio.
*Age is centered at 40 years (subtract 40 from age). Estimates are then given per 10‐year increase in age.
Risk Subgroups and Model Calibration
The cut points for stratification of risk subgroups are summarized in Table 3. Kaplan–Meier curves stratified according to the 4 risk subgroups demonstrated an incrementally increased risk of death associated with increasing risk category (Figure 2). Curves from the cross‐validation sets follow the overall curves consistent with excellent calibration (Figure 2), with progressive increase of risk (Table 3).
Table 3.
Risk Groups for 5‐Year Mortality
| Risk Groups | Deaths, No. (No. at Risk) | HR | 95% CI | P Value |
|---|---|---|---|---|
| Low risk (score ≤−0.17) | 18 (268) | 0.35 | 0.21–0.58 | <0.0001 |
| Low‐intermediate (−0.17 >score <0.70) | 104 (570) | Reference | ||
| Intermediate‐high (0.70 ≤score <1.85) | 257 (570) | 2.98 | 2.37–3.74 | <0.0001 |
| High (score ≥1.85) | 214 (268) | 8.44 | 6.66–10.70 | <0.0001 |
CI indicates confidence interval; HR, hazard ratio.
Figure 2.

Kaplan–Meier curves stratified by risk subgroup demonstrate increased mortality with time. Curves from cross‐validation sets (dashed lines) follow overall curves (solid lines) consistent with excellent model calibration.
Figure 3 depicts the predictiveness curve for the risk model (line) and observed proportion of patients with 5‐year mortality within each decile (circles). This curve shows good calibration and displays risk of death using various percentiles of risk score distribution. Calibration was also adequate across all patients by the Poisson regression method (P=0.49). An example of calibration in 1 cross‐validation build‐and‐test set is depicted in Figure 4, which shows that predicted mortality from the model is an adequate representation of the observed mortality. Results of other cross‐validation sets were similar.
Figure 3.

Predictiveness curve for the risk model (line) and observed proportion of patients with 5‐year mortality within each decile (circles). The curve shows good calibration and displays risk of death using various percentiles of the risk score distribution.
Figure 4.

Calibration in 1 cross‐validation build‐and‐test set. The predicted mortality from the model is an adequate representation of the observed mortality. Results of other cross‐validation sets were similar.
Conversion to Automated Real‐Time Risk Calculator
Big data infrastructure27 enabled deployment of the automated real‐time risk calculator to the point of care via the EHR (Figure 5). Sequential steps for calculation of the risk score include: step 1: Multiply the coded value for each parameter by its β estimate (Table 2). Values for coding of each parameter are listed in Table S2; step 2: Sum products from step 1 to calculate sum of scores; step 3: Calculate esum of scores; step 4; Calculate predicted 5‐year probability of survival using equation 0.852 (result from step 3), where 0.852=baseline survival estimate intercept; step 5: Determine PAD risk classification from the results of step 2 (sum of scores). Cutoffs for risk classification are low ≤−0.17, low‐intermediate −0.17 to <0.70, intermediate‐high 0.70 to <1.85, and high ≥1.85.
Figure 5.

Architecture diagram for the automated calculator in the big data infrastructure. LDAP indicates Lightweight Directory Access Protocol; PAD, peripheral artery disease; UDP, unified data platform.
Table 4 demonstrates an example of an individualized risk score calculation for a 60‐year‐old man at low‐intermediate risk (sum of scores=0.197) with an estimated probability of survival of 0.8. Table 5 summarizes a second case using the same steps as described for the prior example and shows a high‐risk individual (sum of scores=2.25) with a probability of survival at 5 years of 0.22.
Table 4.
Individualized Risk Score and Probability of Survival Calculations: Example 1
| 60‐Year‐Old Man ABI=0.5 on Statin Therapy Comorbidity: Heart Failure | |||
|---|---|---|---|
| Variable | Coded Value | β Estimate | Coded Value Multiplied by β Estimate |
| (Age‐40)/10 | 2 | −0.03909 | −0.07818 |
| ((Age‐40)/10)2 | 4 | 0.07627 | 0.30508 |
| Female sex | 0 | −0.16506 | 0 |
| Prior revascularization | 0 | 0.46146 | 0 |
| PCAs | 0 | 0.56560 | 0 |
| ABI value (per 0.1) | 5 | −0.07367 | −0.36835 |
| Unknown ABI | 0 | 0.23529 | 0 |
| Diabetes mellitus | 0 | 0.32051 | 0 |
| Lung disease | 0 | 0.33151 | 0 |
| Renal disease | 0 | 0.41382 | 0 |
| History of heart failure | 1 | 0.63442 | 0.63442 |
| Dementia | 0 | 0.56241 | 0 |
| Statin use | 1 | −0.38324 | −0.38324 |
| Sum of scores | 0.10973 (low‐intermediate risk) | ||
| Exponential | e0.10973=1.1160 | ||
| Probability of 5‐y survival | 0.8521.1160=0.836 | ||
ABI indicates ankle‐brachial index; PCAs, poorly compressible arteries. Baseline 5‐year survival (intercept)=0.852; predicted probability of 5‐year survival=baseline survival estimate^e ∑xb. See Table 3 for risk stratification cutoffs.
Table 5.
Individualized Risk Score and Probability of Survival Calculations: Example 2
| 80‐Year‐Old Woman With PCAs Comorbidities: Diabetes Mellitus, Heart Failure, and Dementia | |||
|---|---|---|---|
| Variable | Coded value | β Estimate | Coded Value Multiplied by β Estimate |
| (Age‐40)/10 | 4 | −0.03909 | −0.15636 |
| ((Age‐40)/10)2 | 16 | 0.07627 | 1.22032 |
| Female Sex | 1 | −0.16506 | −0.16506 |
| Prior revascularization | 0 | 0.46146 | 0 |
| PCAs | 1 | 0.56560 | 0.56560 |
| ABI value (per 0.1) | 10 | −0.07367 | −0.7367 |
| Unknown ABI | 0 | 0.23529 | 0 |
| Diabetes mellitus | 1 | 0.32051 | 0.32051 |
| Lung disease | 0 | 0.33151 | 0 |
| Renal disease | 0 | 0.41382 | 0 |
| History of heart failure | 1 | 0.63442 | 0.63442 |
| Dementia | 1 | 0.56241 | 0.56241 |
| Statin use | 0 | −0.38324 | 0 |
| Sum of scores | 2.24514 (high risk) | ||
| Exponential | e2.24514=9.441737 | ||
| Probability of 5‐y survival | 0.8521.1160=0.220 | ||
ABI indicates ankle‐brachial index; PCAs, poorly compressible arteries.
Baseline 5‐year survival=0.852; predicted probability of 5‐year survival=baseline survival estimate^e ∑xb. See Table 3 for risk stratification cutoffs.
Discussion
This study used novel methodologic approaches including deployment of phenotyping algorithms to an EHR and a digitized health information system to acquire data elements to build a new prognostic model and automated individualized risk prediction tool for patients with PAD. This automated informatics approach enabled creation of a robust prognostic model for patients with PAD with strong discriminatory power, including c‐statistic magnitudes comparable to those reported for the Framingham Heart Studies.28 Importantly, this study differs from prior reports of prognostic models for patients with PAD by utilization of a community cohort, incorporation of time‐to‐event analysis, use of comorbidities, and ABI results including PCA.12, 14, 15 Furthermore, as the data elements were retrieved from an EHR, which serves a single practice and community, it reflects usual clinical practice encompassing information from both inpatient and outpatient settings, and as such may be broadly generalizable to other healthcare systems and EHRs.29 Risk calculators such as those described herein, which use data elements electronically extracted from EHRs, will enable personalized and real‐time prognostication and thereby realize the vision of a learning healthcare system to support clinical decision‐making at the point of care.1, 30
The study reported herein created a prognostic model from a community cohort with proven PAD using data elements automatically extracted from individual clinical EHRs. In contrast, previous prognostic models for patients with PAD have been limited by highly selected patient subgroups or suboptimal methods of data acquisition and entry. One study31 used machine learning algorithms to identify PAD cases from patients referred for coronary angiography and included data elements obtained by interview at study entry, while other models were limited to patients who had undergone revascularization.14, 15 Another study developed a prognostic index for long‐term mortality but was limited to patients with ABI ≤0.9.12 Although data elements acquired from EHRs have been previously used for a quality improvement registry of patients with PAD, a description of elements used was not provided.32, 33 Additionally, there have been no reports of prognostic tools generated by automated data extraction from EHRs of patients participating in the previously reported PAD registry.
The primary outcome used for the present study was 5‐year all‐cause mortality. The diagnosis of PAD has been consistently associated with high mortality in various patient cohorts.9, 12, 13 For example, in a contemporary PAD cohort from the Netherlands almost half of patients died by 10‐year follow‐up.12 It has also been established that PAD is a strong and independent predictor of cardiovascular and total mortality.13 Statins and antiplatelet agents are recommended by consensus guidelines for patients with PAD to reduce cardiovascular mortality and morbidity.9 However, studies have consistently demonstrated that these recommended strategies are underused24, 34, 35 and physician awareness is low.36 The development and validation of a prognostic model for mortality was a first step in our strategy to apply informatics approaches to improve the quality of care for patients with PAD. Prior studies have evaluated other outcomes associated with PAD including myocardial infarction, ischemic stroke, heart failure, atrial fibrillation, hospitalizations, critical limb ischemia, revascularization, and amputation.9, 13, 24, 37 These other outcomes are also ascertainable by electronic algorithms.17, 24, 38, 39, 40, 41, 42, 43, 44 Future studies using EHR‐linked databases may refine this mortality risk model and also develop prognostic risk models for other outcomes for patients with PAD.
The creation of a CDS for patients with PAD, which includes a risk calculator and promotes use of guideline‐recommended strategies, is aligned with the vision of the quality program endorsed by the American Heart Association.45 The prognostic risk score for mortality from the present study differs from the limb classification system created by expert consensus for patients with critical limb ischemia to estimate risk of amputation and likelihood of benefit of revascularization using clinical stages of wound ischemia and foot infection.46 Notably, this report from the Society of Vascular Surgery also suggests the need for creation of a comorbidity index for prognosis.46 Our study addressed this issue by creating a prognostic model that included comorbidities. Importantly, the novel prognostic system from this study is applicable to a broader group of patients with PAD as it includes patients with or without critical limb ischemia.
The cut points were chosen a priori as unequal group sizes may enable identification of patients with extreme prognoses and group together patients with similar prognoses based on the Cox method, which was designed to minimize the loss of information that occurs with grouping. Grouping was also used to evaluate model fit and validation by graphical and tabular data presentation of groups as guided by the report by Royston and Altman.47 At the point of care it may be preferable to use individual survival probabilities calculated automatically by equations derived from the study model. These results would quantify risk as 5‐year survival and thereby inform provider and patient. Such an approach may incentivize provider recommendation of guideline‐based care as well as patient compliance. Although the level of risk would not change recommendations, information regarding probability of 5‐year survival may enhance both provider recommendation and patient compliance to guideline‐based care. During the conversation at the point of care, the patient and provider may review the individualized probability of survival and strategies in use by the patient (ie, statins, antiplatelet therapy and smoking discontinuation). During the same encounter, the patient and provider may also review all secondary prevention strategies recommended for risk modification (ie, “ideal status”), enabling the patient to make an informed decision regarding use of guideline‐recommended strategies.
The use of EHRs to automatically update EHR‐derived data sets and inclusion of additional candidate variables for model updates has been successfully used by the QRISK group.3, 6 Additionally, a recent study that used EHR data from family medicine practices in the United Kingdom demonstrated that machine learning algorithms had superior performance for cardiovascular risk prediction compared with the pooled cohort equation, underscoring the potential of automation to support derivation of future risk scores.48
To evaluate the utility of the risk equation in clinical practice, the authors are currently conducting a prospective quality project to evaluate the impact of a CDS on guideline‐recommended strategies for patients with PAD compared with a control group managed without CDS. The CDS tool displays both the risk score and guideline‐recommended strategies in use. Our prior publications have demonstrated underuse of these strategies by patients with PAD in Olmsted County24, 34 including antiplatelet agents, statins, and smoking abstention. The outcome for the ongoing project will be the number of guideline‐recommended strategies implemented with deployment of a CDS tool.
This study used the resources of the REP including a medical records linkage system, availability of diagnostic codes (ICD‐9 and International Classification of Diseases, Tenth Revision [ICD‐10]), procedural codes, laboratory test results, and medication prescription information.49 The REP also includes patient name, age, sex, address, race, ethnicity, years of education, smoking status, height, weight, and body mass index.49 Unique resources of the REP also include death ascertainment via multiple electronic resources, hospitalization information, emergency department visits49 and access to narrative text50 which may be automatically abstracted by natural language processing.51
Coexisting factors may have contributed to only 60% of the study patients taking antiplatelet agents. Poor adherence was likely a major contributor given evidence from prior studies that demonstrate underuse of guideline‐recommended strategies for secondary prevention in patients with PAD, including antiplatelet therapy.24, 34, 35 Incomplete ascertainment caused by over‐the‐counter aspirin availability is another potential contributor. However, in the present study, manual review of clinical notes to ascertain use of over‐the‐counter aspirin supplemented information retrieved from records of pharmacy prescription. The use of alternative antiplatelet agents would not explain this observation, as only 9% of study patients were taking clopidogrel.
Limitations
Despite robust internal validations performed for this study, future collaborative studies will be required for external validation and to demonstrate portability of the PAD prognostic model and tool to other healthcare systems and EHRs. An electronic phenotyping algorithm was used to recognize ICD‐9 codes for PAD case identification and these patients were followed for a mean of 5 years. However, in 2015, ICD‐10 codes replaced ICD‐9 codes, which will make future studies necessary using a similar approach with updated ICD‐10 codes for community cohorts with adequate duration of follow‐up.
Variables that characterize socioeconomic status were not included in the study models. Future studies may evaluate the incremental predictive value of social risk factors as identified by the National Academy of Medicine for inclusion in the meaningful use of EHRs.52 Validated approaches (eg, Townsend Deprivation index11 and a dichotomous measure of socioeconomic status using income and education53, 54) have been previously used to evaluate cardiovascular disease risk in primary prevention settings.
Results of imaging of the arterial circulation were not included in the present study. However, results of the noninvasive ABI, which established PAD diagnosis and disease severity, were included.8, 55, 56 Current practice guidelines recommend vascular imaging only for patients evaluated for revascularization.9 However, the present study included community‐dwelling patients with PAD regardless of need for revascularization. Future studies that focus on revascularization candidates may incorporate vascular imaging results extracted by computational and informatics methodologies57 and thereby enable derivation of appropriate prognostic models. In the present study, the risk model was developed on the basis of variables extracted at a single point in time and does not account for time‐dependent variables.
This study was conducted in Olmsted County, a mixed urban‐rural setting with limited ethnic diversity. However, the REP captures all healthcare information of the entire Olmsted County population regardless of socioeconomic status.29 Future studies may incorporate socioeconomic status in prediction models for patients with PAD. As most study participants were non‐Hispanic whites (94% of study population), the study findings may be limited to populations of similar race and ethnic composition including the state of Minnesota and Upper Midwest.
Conclusions
This study demonstrates that electronic tools can be deployed to EHRs to create automated real‐time risk calculators to predict survival of patients with PAD. Moreover, the prognostic model developed may be translated to patient care as an automated and individualized real‐time risk calculator deployed at the point of care, which will not require manual data entry by busy clinicians into web‐based applications. The concepts and approach described here will be broadly generalizable to other cardiovascular diseases for practices that use EHRs.
Sources of Funding
Research reported in this publication was supported by the National Heart, Lung, and Blood Institute of the National Institutes of Health (award K01HL124045), National Institute of Biomedical Imaging and Bioengineering of the National Institutes of Health (award R01EB19403), National Center for Advancing Translational Sciences of the National Institutes of Health (award U01TR02062) and National Human Genome Research Institute of the National Institutes of Health, Electronic Medical Records and Genomics (eMERGE) Network (award HG006379). This study was also made possible using the resources of the Rochester Epidemiology Project supported by the National Institute on Aging of the National Institutes of Health (awards R01AG034676 and RO1AGO 052425). The content is solely the responsibility of the authors and does not necessarily represent the official views of the National Institutes of Health.
Disclosures
None.
Supporting information
Table S1. ICD‐9 Codes Used to Identify Comorbidities
Table S2. Variable Coding
Acknowledgments
We thank Rebecca Olson for secretarial support and Carin Smith and Bradley Lewis for statistical support.
(J Am Heart Assoc. 2018;7:e009680 DOI: 10.1161/JAHA.118.009680)
References
- 1. Maddox TM, Albert NM, Borden WB, Curtis LH, Ferguson TB Jr, Kao DP, Marcus GM, Peterson ED, Redberg R, Rumsfeld JS, Shah ND, Tcheng JE; American Heart Association Council on Quality of Care and Outcomes Research; Council on Cardiovascular Disease in the Young; Council on Clinical Cardiology; Council on Functional Genomics and Translational Biology; and Stroke Council . The learning healthcare system and cardiovascular care: a scientific statement from the American Heart Association. Circulation. 2017;135:e826–e857. [DOI] [PubMed] [Google Scholar]
- 2. Karmali KN, Lloyd‐Jones DM. Implementing cardiovascular risk prediction in clinical practice: the future is now. J Am Heart Assoc. 2017;6:e006019 DOI: 10.1161/JAHA.117.006019 [DOI] [PMC free article] [PubMed] [Google Scholar]
- 3. Hippisley‐Cox J, Coupland C, Brindle P. Development and validation of QRISK3 risk prediction algorithms to estimate future risk of cardiovascular disease: prospective cohort study. BMJ. 2017;357:j2099. [DOI] [PMC free article] [PubMed] [Google Scholar]
- 4. Wolfson J, Vock DM, Bandyopadhyay S, Kottke T, Vazquez‐Benitez G, Johnson P, Adomavicius G, O'Connor PJ. Use and customization of risk scores for predicting cardiovascular events using electronic health record data. J Am Heart Assoc. 2017;6:e003670 DOI: 10.1161/JAHA.116.003670 [DOI] [PMC free article] [PubMed] [Google Scholar]
- 5. Scheitel MR, Kessler ME, Shellum JL, Peters SG, Milliner DS, Liu H, Komandur Elayavilli R, Poterack KA, Miksch TA, Boysen J, Hankey RA, Chaudhry R. Effect of a novel clinical decision support tool on the efficiency and accuracy of treatment recommendations for cholesterol management. Appl Clin Inform. 2017;8:124–136. [DOI] [PMC free article] [PubMed] [Google Scholar]
- 6. QRISK®3‐2018 risk calculator. 2017‐18. Available at: https://qrisk.org/three. Accessed July 26, 2018.
- 7. Hirsch AT, Haskal ZJ, Hertzer NR, Bakal CW, Creager MA, Halperin JL, Hiratzka LF, Murphy WR, Olin JW, Puschett JB, Rosenfield KA, Sacks D, Stanley JC, Taylor LM Jr, White CJ, White J, White RA, Antman EM, Smith SC Jr, Adams CD, Anderson JL, Faxon DP, Fuster V, Gibbons RJ, Hunt SA, Jacobs AK, Nishimura R, Ornato JP, Page RL, Riegel B. ACC/AHA 2005 Practice Guidelines for the management of patients with peripheral arterial disease (lower extremity, renal, mesenteric, and abdominal aortic): a collaborative report from the American Association for Vascular Surgery/Society for Vascular Surgery, Society for Cardiovascular Angiography and Interventions, Society for Vascular Medicine and Biology, Society of Interventional Radiology, and the ACC/AHA Task Force on Practice Guidelines (Writing Committee to Develop Guidelines for the Management of Patients With Peripheral Arterial Disease): endorsed by the American Association of Cardiovascular and Pulmonary Rehabilitation; National Heart, Lung, and Blood Institute; Society for Vascular Nursing; TransAtlantic Inter‐Society Consensus; and Vascular Disease Foundation. Circulation. 2006;113:e463–654. [DOI] [PubMed] [Google Scholar]
- 8. Kullo IJ, Rooke TW. Clinical practice. Peripheral artery disease. N Engl J Med. 2016;374:861–71. [DOI] [PubMed] [Google Scholar]
- 9. Gerhard‐Herman MD, Gornik HL, Barrett C, Barshes NR, Corriere MA, Drachman DE, Fleisher LA, Fowkes FG, Hamburg NM, Kinlay S, Lookstein R, Misra S, Mureebe L, Olin JW, Patel RA, Regensteiner JG, Schanzer A, Shishehbor MH, Stewart KJ, Treat‐Jacobson D, Walsh ME. 2016 AHA/ACC Guideline on the Management of Patients With Lower Extremity Peripheral Artery Disease: a report of the American College of Cardiology/American Heart Association Task Force on Clinical Practice Guidelines. Circulation. 2016;135:e726–779. [DOI] [PMC free article] [PubMed] [Google Scholar]
- 10. Vogt MT, Cauley JA, Newman AB, Kuller LH, Hulley SB. Decreased ankle/arm blood pressure index and mortality in elderly women. JAMA. 1993;270:465–9. [PubMed] [Google Scholar]
- 11. Newman AB, Shemanski L, Manolio TA, Cushman M, Mittelmark M, Polak JF, Powe NR, Siscovick D. Ankle‐arm index as a predictor of cardiovascular disease and mortality in the Cardiovascular Health Study. The Cardiovascular Health Study Group. Arterioscler Thromb Vasc Biol. 1999;19:538–45. [DOI] [PubMed] [Google Scholar]
- 12. Feringa HH, Bax JJ, Hoeks S, van Waning VH, Elhendy A, Karagiannis S, Vidakovic R, Schouten O, Boersma E, Poldermans D. A prognostic risk index for long‐term mortality in patients with peripheral arterial disease. Arch Intern Med. 2007;167:2482–9. [DOI] [PubMed] [Google Scholar]
- 13. Golomb BA, Dang TT, Criqui MH. Peripheral arterial disease: morbidity and mortality implications. Circulation. 2006;114:688–99. [DOI] [PubMed] [Google Scholar]
- 14. Owens CD, Kim JM, Hevelone ND, Gasper WJ, Belkin M, Creager MA, Conte MS. An integrated biochemical prediction model of all‐cause mortality in patients undergoing lower extremity bypass surgery for advanced peripheral artery disease. J Vasc Surg. 2012;56:686–95. [DOI] [PMC free article] [PubMed] [Google Scholar]
- 15. Moxey PW, Brownrigg J, Kumar SS, Crate G, Holt PJ, Thompson MM, Jones KG, Hinchliffe RJ. The BASIL survival prediction model in patients with peripheral arterial disease undergoing revascularization in a university hospital setting and comparison with the FINNVASC and modified PREVENT scores. J Vasc Surg. 2013;57:1–7. [DOI] [PubMed] [Google Scholar]
- 16. St Sauver JL, Grossardt BR, Yawn BP, Melton LJ III, Pankratz JJ, Brue SM, Rocca WA. Data resource profile: the Rochester Epidemiology Project (REP) medical records‐linkage system. Int J Epidemiol. 2012;41:1614–24. [DOI] [PMC free article] [PubMed] [Google Scholar]
- 17. Fan J, Arruda‐Olson AM, Leibson CL, Smith C, Liu G, Bailey KR, Kullo IJ. Billing code algorithms to identify cases of peripheral artery disease from administrative data. J Am Med Inform Assoc. 2013;20:e349–54. [DOI] [PMC free article] [PubMed] [Google Scholar]
- 18. Arain FA, Ye Z, Bailey KR, Chen Q, Liu G, Leibson CL, Kullo IJ. Survival in patients with poorly compressible leg arteries. J Am Coll Cardiol. 2012;59:400–7. [DOI] [PMC free article] [PubMed] [Google Scholar]
- 19. Charlson ME, Pompei P, Ales KL, MacKenzie CR. A new method of classifying prognostic comorbidity in longitudinal studies: development and validation. J Chronic Dis. 1987;40:373–83. [DOI] [PubMed] [Google Scholar]
- 20. Deyo RA, Cherkin DC, Ciol MA. Adapting a clinical comorbidity index for use with ICD‐9‐CM administrative databases. J Clin Epidemiol. 1992;45:613–9. [DOI] [PubMed] [Google Scholar]
- 21. Sohn S, Savova GK. Mayo clinic smoking status classification system: extensions and improvements. AMIA Annu Symp Proc. 2009;2009:619–23. [PMC free article] [PubMed] [Google Scholar]
- 22. DeLoach SS, Mohler ER III. Peripheral arterial disease: a guide for nephrologists. Clin J Am Soc Nephrol. 2007;2:839–46. [DOI] [PubMed] [Google Scholar]
- 23. Je HG, Kim BH, Cho KI, Jang JS, Park YH, Spertus J. Correlation between patient‐reported symptoms and ankle‐brachial index after revascularization for peripheral arterial disease. Int J Mol Sci. 2015;16:11355–68. [DOI] [PMC free article] [PubMed] [Google Scholar]
- 24. Arruda‐Olson AM, Moussa Pacha H, Afzal N, Abram S, Lewis BR, Isseh I, Haddad R, Scott CG, Bailey K, Liu H, Rooke TW, Kullo IJ. Burden of hospitalization in clinically diagnosed peripheral artery disease: a community‐based study. Vasc Med. 2018;23:23–31. [DOI] [PMC free article] [PubMed] [Google Scholar]
- 25. Pepe MS, Feng Z, Huang Y, Longton G, Prentice R, Thompson IM, Zheng Y. Integrating the predictiveness of a marker with its performance as a classifier. Am J Epidemiol. 2008;167:362–8. [DOI] [PMC free article] [PubMed] [Google Scholar]
- 26. Crowson CS, Atkinson EJ, Therneau TM. Assessing calibration of prognostic risk scores. Stat Methods Med Res. 2016;25:1692–706. [DOI] [PMC free article] [PubMed] [Google Scholar]
- 27. Kaggal VC, Elayavilli RK, Mehrabi S, Pankratz JJ, Sohn S, Wang Y, Li D, Rastegar MM, Murphy SP, Ross JL, Chaudhry R, Buntrock JD, Liu H. Toward a learning health‐care system—knowledge delivery at the point of care empowered by big data and NLP. Biomed Inform Insights. 2016;8:13–22. [DOI] [PMC free article] [PubMed] [Google Scholar]
- 28. Lloyd‐Jones DM. Cardiovascular risk prediction: basic concepts, current status, and future directions. Circulation. 2010;121:1768–77. [DOI] [PubMed] [Google Scholar]
- 29. St Sauver JL, Grossardt BR, Leibson CL, Yawn BP, Melton LJ III, Rocca WA. Generalizability of epidemiological findings and public health decisions: an illustration from the Rochester Epidemiology Project. Mayo Clin Proc. 2012;87:151–60. [DOI] [PMC free article] [PubMed] [Google Scholar]
- 30. Jensen PB, Jensen LJ, Brunak S. Mining electronic health records: towards better research applications and clinical care. Nat Rev Genet. 2012;13:395–405. [DOI] [PubMed] [Google Scholar]
- 31. Ross EG, Shah NH, Dalman RL, Nead KT, Cooke JP, Leeper NJ. The use of machine learning for the identification of peripheral artery disease and future mortality risk. J Vasc Surg. 2016;64:1515–1522e3. [DOI] [PMC free article] [PubMed] [Google Scholar]
- 32. Chan PS, Oetgen WJ, Spertus JA. The Improving Continuous Cardiac Care (IC(3)) program and outpatient quality improvement. Am J Med. 2010;123:217–9. [DOI] [PubMed] [Google Scholar]
- 33. Subherwal S, Patel MR, Tang F, Smolderen KG, Jones WS, Tsai TT, Ting HH, Bhatt DL, Spertus JA, Chan PS. Socioeconomic disparities in the use of cardioprotective medications among patients with peripheral artery disease: an analysis of the American College of Cardiology's NCDR PINNACLE Registry. J Am Coll Cardiol. 2013;62:51–7. [DOI] [PMC free article] [PubMed] [Google Scholar]
- 34. Chaudhry AP, Afzal N, Abidian MM, Mallipeddi VP, Elayavilli RK, Scott CG, Kullo IJ, Wennberg PW, Pankratz JJ, Liu H, Chaudhry R, Arruda‐Olson AM. Innovative informatics approaches for peripheral artery disease: current state and provider survey of strategies for improving guideline‐based care. Mayo Clin Proc Innov Qual Outcomes. 2018;2:129–136. [DOI] [PMC free article] [PubMed] [Google Scholar]
- 35. Berger JS, Ladapo JA. Underuse of prevention and lifestyle counseling in patients with peripheral artery disease. J Am Coll Cardiol. 2017;69:2293–2300. [DOI] [PMC free article] [PubMed] [Google Scholar]
- 36. Hirsch AT, Criqui MH, Treat‐Jacobson D, Regensteiner JG, Creager MA, Olin JW, Krook SH, Hunninghake DB, Comerota AJ, Walsh ME, McDermott MM, Hiatt WR. Peripheral arterial disease detection, awareness, and treatment in primary care. JAMA. 2001;286:1317–24. [DOI] [PubMed] [Google Scholar]
- 37. O'Neal WT, Efird JT, Nazarian S, Alonso A, Heckbert SR, Soliman EZ. Peripheral arterial disease and risk of atrial fibrillation and stroke: the Multi‐Ethnic Study of Atherosclerosis. J Am Heart Assoc. 2014;3:e001270 DOI: 10.1161/JAHA.114.001270 [DOI] [PMC free article] [PubMed] [Google Scholar]
- 38. Coloma PM, Valkhoff VE, Mazzaglia G, Nielsson MS, Pedersen L, Molokhia M, Mosseveld M, Morabito P, Schuemie MJ, van der Lei J, Sturkenboom M, Trifiro G ; Consortium E‐A . Identification of acute myocardial infarction from electronic healthcare records using different disease coding systems: a validation study in three European countries. BMJ Open. 2013;3:e002862. [DOI] [PMC free article] [PubMed] [Google Scholar]
- 39. Williams LS, Rotich J, Qi R, Fineberg N, Espay A, Bruno A, Fineberg SE, Tierney WR. Effects of admission hyperglycemia on mortality and costs in acute ischemic stroke. Neurology. 2002;59:67–71. [DOI] [PubMed] [Google Scholar]
- 40. Baker DW, Persell SD, Thompson JA, Soman NS, Burgner KM, Liss D, Kmetik KS. Automated review of electronic health records to assess quality of care for outpatients with heart failure. Ann Intern Med. 2007;146:270–7. [DOI] [PubMed] [Google Scholar]
- 41. Tu K, Nieuwlaat R, Cheng SY, Wing L, Ivers N, Atzema CL, Healey JS, Dorian P. Identifying patients with atrial fibrillation in administrative data. Can J Cardiol. 2016;32:1561–1565. [DOI] [PubMed] [Google Scholar]
- 42. Gami AS, Hodge DO, Herges RM, Olson EJ, Nykodym J, Kara T, Somers VK. Obstructive sleep apnea, obesity, and the risk of incident atrial fibrillation. J Am Coll Cardiol. 2007;49:565–71. [DOI] [PubMed] [Google Scholar]
- 43. Afzal N, Mallipeddi VP, Sohn S, Liu H, Chaudhry R, Scott CG, Kullo IJ, Arruda‐Olson AM. Natural language processing of clinical notes for identification of critical limb ischemia. Int J Med Inform. 2018;111:83–89. [DOI] [PMC free article] [PubMed] [Google Scholar]
- 44. Bekwelem W, Bengtson LG, Oldenburg NC, Winden TJ, Keo HH, Hirsch AT, Duval S. Development of administrative data algorithms to identify patients with critical limb ischemia. Vasc Med. 2014;19:483–90. [DOI] [PubMed] [Google Scholar]
- 45. American Heart Association—Quality Improvement. 2018. Available at: https://www.heart.org/en/professional/quality-improvement. Accessed July 29, 2018.
- 46. Mills JL Sr, Conte MS, Armstrong DG, Pomposelli FB, Schanzer A, Sidawy AN, Andros G; Society for Vascular Surgery Lower Extremity Guidelines C . The society for vascular surgery lower extremity threatened limb classification system: risk stratification based on wound, ischemia, and foot infection (WIfI). J Vasc Surg. 2014;59:220–34.e1–2. [DOI] [PubMed] [Google Scholar]
- 47. Royston P, Altman DG. External validation of a Cox prognostic model: principles and methods. BMC Med Res Methodol. 2013;13:33. [DOI] [PMC free article] [PubMed] [Google Scholar]
- 48. Weng SF, Reps J, Kai J, Garibaldi JM, Qureshi N. Can machine‐learning improve cardiovascular risk prediction using routine clinical data? PLoS One. 2017;12:e0174944. [DOI] [PMC free article] [PubMed] [Google Scholar]
- 49. Rocca WA, Grossardt BR, Brue SM, Bock‐Goodner CM, Chamberlain AM, Wilson PM, Finney Rutten LJ, St Sauver JL. Data resource profile: Expansion of the Rochester Epidemiology Project medical records‐linkage system (E‐REP). Int J Epidemiol. 2018;47:368–368j. [DOI] [PMC free article] [PubMed] [Google Scholar]
- 50. St Sauver JL, Grossardt BR, Yawn BP, Melton LJ III, Pankratz JJ, Brue SM, Rocca WA. Data resource profile: the Rochester Epidemiology Project (REP) medical records‐linkage system. Int J Epidemiol. 2012;41:1614–24. [DOI] [PMC free article] [PubMed] [Google Scholar]
- 51. Afzal N, Sohn S, Abram S, Scott CG, Chaudhry R, Liu H, Kullo IJ, Arruda‐Olson AM. Mining peripheral arterial disease cases from narrative clinical notes using natural language processing. J Vasc Surg. 2017;65:1753–1761. [DOI] [PMC free article] [PubMed] [Google Scholar]
- 52. Institute of Medicine . Capturing Social and Behavioral Domains and Measures in Electronic Health Records: Phase 2. Washington, DC: The National Academies Press; 2014. Available at: https://www.nap.edu/catalog/18951/capturing-social-and-behavioral-domains-and-measures-in-electronic-health-records. Accessed July 25, 2018. [PubMed] [Google Scholar]
- 53. Franks P, Winters PC, Tancredi DJ, Fiscella KA. Do changes in traditional coronary heart disease risk factors over time explain the association between socio‐economic status and coronary heart disease? BMC Cardiovasc Disord. 2011;11:28. [DOI] [PMC free article] [PubMed] [Google Scholar]
- 54. Fiscella K, Tancredi D, Franks P. Adding socioeconomic status to Framingham scoring to reduce disparities in coronary risk assessment. Am Heart J. 2009;157:988–94. [DOI] [PubMed] [Google Scholar]
- 55. Dachun X, Jue L, Liling Z, Yawei X, Dayi H, Pagoto SL, Yunsheng M. Sensitivity and specificity of the ankle–brachial index to diagnose peripheral artery disease: a structured review. Vasc Med. 2010;15:361–9. [DOI] [PubMed] [Google Scholar]
- 56. Grenon SM, Gagnon J, Hsiang Y. Video in clinical medicine. Ankle‐brachial index for assessment of peripheral arterial disease. N Engl J Med. 2009;361:e40. [DOI] [PubMed] [Google Scholar]
- 57. Savova GK, Fan J, Ye Z, Murphy SP, Zheng J, Chute CG, Kullo IJ. Discovering peripheral arterial disease cases from radiology notes using natural language processing. AMIA Ann Symp Proc. 2010;2010:722–6. [PMC free article] [PubMed] [Google Scholar]
Associated Data
This section collects any data citations, data availability statements, or supplementary materials included in this article.
Supplementary Materials
Table S1. ICD‐9 Codes Used to Identify Comorbidities
Table S2. Variable Coding