

Abstract
Background
We sought to study longer term survival in patients with aortic stenosis (AS) and nondialysis chronic kidney disease (CKD).
Methods and Results
We studied 839 patients (aged 78±9 years and 51% male) with CKD and AS on echocardiogram from 2005 to 2012. Longer term all‐cause and cardiovascular mortality was compared with a CKD group without AS, propensity matched for age, sex, race, left ventricular ejection fraction and CKD stage. Cox models were used to evaluate all‐cause mortality and competing‐risks regression models censored at time of aortic valve replacement to evaluate cardiac mortality in patients with AS and CKD. Overall, 511 (61%), 252 (30%), and 76 (9%) patients had CKD stages 3a, 3b, and 4, respectively; 93% had hypertension, 28% had diabetes mellitus, and 37% had coronary artery disease. In total, 185 (22%) had mild AS, 355 (42%) had moderate AS, and 299 (36%) had severe AS (66 symptomatic). Patients with CKD and AS had higher cardiac and all‐cause mortality compared with controls with CKD and no AS (P<0.001). Among patients with AS and CKD, there were 156 (19%) aortic valve replacements and 454 (54%) deaths (203 cardiac deaths) at 4.0±2.3 years of follow‐up. Lower estimated glomerular filtration rate (hazard ratio per 10 mL/min per 1.73 m2: 1.18; 95% CI, 1.08–1.29) was associated with increased risk of all‐cause mortality but not cardiac mortality (hazard ratio: 1.12; 95% CI, 0.97–1.30; P=0.13). Of patients undergoing aortic valve replacement, 61% had improvement in estimated glomerular filtration rate within 1 year (median percentage change=+2.8% per month).
Conclusions
Among patients with nondialysis CKD, AS is associated with significantly higher cardiac and all‐cause mortality; lower estimated glomerular filtration rate is associated with increased mortality, and aortic valve replacement was associated with improved survival.
Keywords: aortic stenosis, chronic kidney disease, survival
Subject Categories: Echocardiography, Valvular Heart Disease, Cardiorenal Syndrome
Clinical Perspective
What Is New?
Among 839 patients with aortic stenosis and nondialysis chronic kidney disease, the presence of AS was associated with higher cardiac and all‐cause mortality than was found in matched controls with chronic kidney disease.
Although lower aortic valve area was associated with increased all‐cause and cardiac mortality in these patients, lower estimated glomerular filtration rate was associated with increased all‐cause but not cardiac mortality.
Aortic valve replacement (AVR) was associated with improved survival, and 60% of patients undergoing AVR had improvement in renal function after AVR.
What Are the Clinical Implications?
The presence of chronic kidney disease in patients with aortic stenosis should not by itself lead to lower referral to AVR, as these patients have improved survival and may have improvements in renal function after AVR.
Additional studies are needed among patients with aortic stenosis and moderate to severe chronic kidney disease to help us elucidate optimal clinical follow‐up, testing, and benefit from procedures such as AVR.
Introduction
Aortic stenosis (AS) is the most common valvular disease in developed countries and affects 2% to 4% of adults.1 The disease progresses slowly over many years, ranging from asymptomatic mild thickening of the valve without significant narrowing (aortic sclerosis) to severe symptomatic AS.2, 3 Mortality in earlier stages of AS is similar to an age‐ and sex‐matched general population; however, it increases progressively with increasing severity of AS, to >60% at 2 years once the patient develops symptomatic severe AS.4, 5, 6
Chronic kidney disease (CKD) is a widely prevalent comorbid disease affecting ≈8% of US adults.7 CKD is also associated with a greater risk of major cardiovascular events and related mortality that increases to >3 times that of the general population as kidney function continues to decline.8 Earlier stages of both CKD and end‐stage renal disease are associated with increased coronary and aortic and mitral valvular calcification9, 10, 11 owing to increased parathyroid hormone, calcium–phosphate products, and excess 1,25 hydroxy vitamin D among other metabolic dysregulations.9 Valve calcification is also associated with a faster rate of progression of AS and worse outcomes.12 Dialysis patients with concomitant AS have a higher rate of progression13, 14, 15 and cardiovascular and all‐cause mortality16 compared with patients with normal renal function. However, information is limited regarding history of progression and long‐term outcomes in AS patients who have less severe forms of CKD and reduced estimated glomerular filtration rate (eGFR) but are not yet on maintenance dialysis.17
CKD is present in up to 50% of all patients with AS18 and is one of the factors associated with an increased rate of progression of AS.19 CKD is also associated with increased mortality20 and poor outcomes after surgical aortic valve replacement (SAVR) or transcatheter aortic valve replacement (TAVR).21, 22, 23, 24, 25 However, some of these studies are limited by inclusion of a very small number of patients with CKD and do not evaluate the independent association of outcomes with progressively decreasing eGFR. In the present study, we aimed to assess long‐term cardiovascular and all‐cause mortality outcomes of AS in a large electronic health record–based CKD registry of patients with CKD stages 3 to 4 before initiation of dialysis. Furthermore, we sought to identify factors that independently contribute to long‐term poor outcomes in this population.
Methods
Study Population
This was a cohort study of all patients aged ≥18 years with at least mild AS and CKD stages 3 to 4 who were seen at our institution from 2005 to 2012. We used our electronic health record–based CKD registry to identify our patients; development and validation of the registry have been described in detail in a prior publication.26 Patients were included in the CKD registry once they met the following criteria: (1) had at least 1 face‐to‐face outpatient encounter with a Cleveland Clinic healthcare provider and (2) had at least ≥2 eGFRs <60 mL/min per 1.73 m2 that were at least 90 days apart (using the Chronic Kidney Disease Epidemiology Collaboration [CKD‐EPI] equation),27, 28 with the second being 15 to 59.9 mL/min per 1.73 m2. Patients who were known to have end‐stage renal disease needing dialysis or who had a renal transplant before CKD diagnosis were excluded.
Our study included patients with AS identified on an initial transthoracic echocardiogram within 1 year before or any time after the date of the second eGFR <60 mL/min per m2. We excluded patients with a moderate or higher degree of concomitant valvular disease (aortic regurgitation, mitral stenosis or regurgitation, pulmonic stenosis or regurgitation, tricuspid stenosis or regurgitation; n=305), prior history of aortic valvuloplasty or aortic valve replacement (AVR; n=118), or history of heart transplant (n=4) and those with left ventricular ejection fraction (LVEF) <50% (n=189). Nonresidents of Ohio or patients with missing Social Security numbers were also excluded from mortality analyses (Figure 1).
Figure 1.
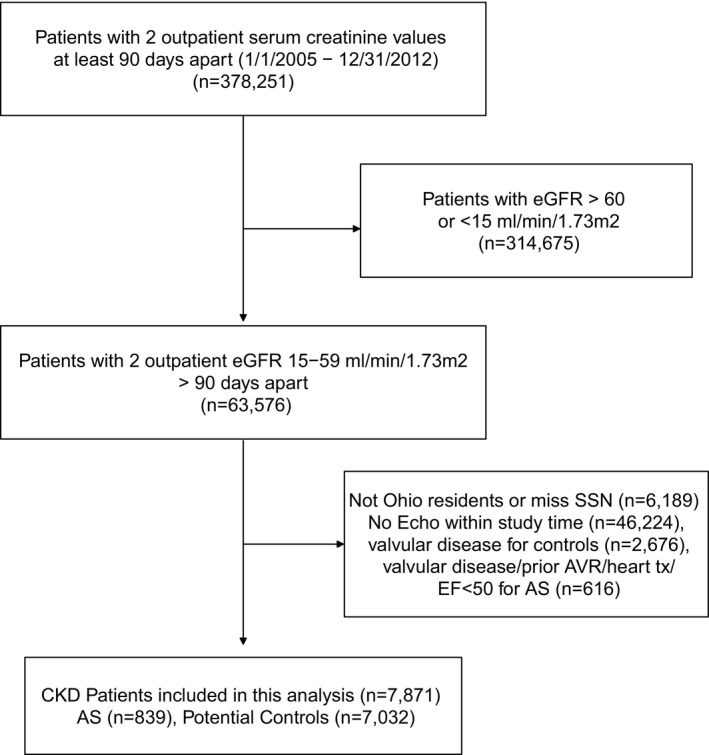
Flow diagram of study population. AS indicates aortic stenosis; AVR, aortic valve replacement; CKD, chronic kidney disease; EF, ejection fraction; eGFR, estimated glomerular filtration rate; SSN, Social Security number; tx, transplant.
The control group included patients without documented AS but with CKD stages 3 to 4 from the same CKD registry. Control patients with more than mild mitral, aortic, tricuspid, or pulmonic stenosis or regurgitation were excluded. The propensity‐matching criteria for cases and controls are described in detail below.
The data, analytic methods, and study materials will not be made available to other researchers for purposes of reproducing the results or replicating the procedure. The study was approved by the institutional review board at the Cleveland Clinic, and the requirement of informed consent was waived.
Baseline Demographic and Clinical Characteristics
Baseline demographics and clinical characteristics (risk factors, medications, and laboratory parameters) using prespecified validated definitions26 were extracted from electronic health records. Symptom presence at onset was determined by manual chart review, and a 10% sample was cross‐validated with 100% accuracy (K.K.P. and S.Y.S.). Patients were considered symptomatic if they had angina, dyspnea, syncope, presyncope, or congestive heart failure determined by the evaluating physician to be secondary to AS. Fatigue, being nonspecific, was not included unless specified by the evaluating physician.
Renal Function
For eGFR calculation, we applied the CKD‐EPI equation to patients who had 2 outpatient serum creatinine levels separated by at least 90 days in our health system.27 All creatinine measurements were performed by standardized isotope dilution mass spectrometry assays using the modified kinetic Jaffe reaction on a Hitachi D2400 Modular Chemistry Analyzer (Roche Diagnostics) in our laboratory. CKD was defined according to Kidney Disease: Improving Global Outcomes guidelines as follows: stage 3 CKD (eGFR 30–50 mL/min per 1.73 m2; subdivided into stage 3a eGFR 45–59 mL/min per 1.73 m2 and stage 3b 30–44 mL/min per 1.73 m2), and stage 4 CKD (eGFR 15–29 mL/min per 1.73 m2).29
Echocardiographic Data
All patients underwent a comprehensive transthoracic echocardiographic evaluation using commercial instruments during the study. Peak aortic jet velocity was obtained using continuous‐wave Doppler in multiple transducer positions. Peak and mean gradients across the aortic valve were calculated using a modified Bernoulli equation, and aortic valve area (AVA) was calculated using the continuity equation. Left ventricular (LV) mass, LV dimensions, left atrial size, right ventricular systolic pressure (RVSP), and LVEF were calculated according to standardized guidelines.30, 31 AS was classified as (1) mild (AVA >1.5 cm2), (2) moderate (AVA 1–1.5 cm2), or (3) severe (AVA ≤1 cm2), subclassified as symptomatic or asymptomatic severe based on the presence of symptoms at the time of the echocardiogram.4, 30
Follow‐up and Outcomes
The inception date for time‐to‐event models was the date of the initial echocardiogram showing AS or the date of the second eGFR <60 mL/min per 1.73 m2, whichever came later. We performed chart reviews (K.K.P. and S.Y.S.) to extract the indication for and date of AVR (surgical or transcatheter). The primary end point was all‐cause mortality, and the secondary end point was cardiovascular mortality. Date of death and nature of death (cardiac versus noncardiac) were determined from the Ohio Department of Health mortality files and review of electronic health records. Last date of follow‐up was December 31, 2013, or date of death.
Statistical Analysis
Continuous variables are expressed as mean (SD) or median (interquartile range) for skewed distributions, and categorical variables are expressed as percentages. For comparison of survival among patients with CKD and AS and patients with CKD in absence of AS or other significant valvular disease, propensity‐score and greedy matching was used to match CKD patients with AS to potential controls with CKD but without AS. The propensity score included age, sex, race, eGFR, year of echocardiogram, and LVEF. Patient characteristics were compared before and after the match, using standardized differences (Table S1). Kaplan–Meier survival curves and the log‐rank test were used to compare all‐cause and cardiovascular survival of patients with CKD and AS and matched patients with CKD without AS.
Baseline characteristics and echocardiographic parameters were compared across groups of mild, moderate, severe asymptomatic, and severe symptomatic AS using ANOVA or the Kruskal–Wallis test for continuous variables and the Pearson χ2 test for categorical variables. Overall survival was compared among the different stages of severity of AS within our study population using Kaplan–Meier survival curves. Of the patients undergoing AVR on follow‐up, we calculated the change in eGFR from before the AVR/TAVR to the first follow‐up eGFR in months 1 to 12 after AVR. We also report the percentage of patients with any eGFR increase and the change per month of follow‐up. Cardiac and other‐cause mortality was evaluated across AS severity groups using cumulative incidence functions for competing risks (Fine and Gray models). Cox proportional hazards analysis was used to evaluate factors associated with all‐cause mortality (primary outcome), and competing‐risks regression analysis was used to evaluate factors associated with cardiovascular mortality (secondary outcome), with other causes of death as a competing risk. A combination of demographic, laboratory, and clinical variables (Table S2) decided a priori with a plausible relationship to all‐cause mortality were tested in univariate models. Univariable Cox all‐cause mortality and competing‐risks analyses were censored at AVR but not multivariable Cox analysis. AVR was included as a time‐dependent covariate in the multivariable Cox model of all‐cause survival, along with age, sex, race, eGFR, smoking, diabetes mellitus, coronary artery disease, congestive heart failure, cerebrovascular disease, peripheral vascular disease, hyperlipidemia, hypertension, malignancy, angiotensin‐converting enzyme inhibitor or angiotensin receptor blocker, β‐blocker, diuretic, vasodilator, hemoglobin, albumin, calcium, log alkaline phosphatase, AVA, RVSP, ejection fraction, indexed LV end‐diastolic diameter, indexed LV mass, indexed left atrial diameter, degree of diastolic dysfunction, and presence of symptoms. The multivariable competing risks regression model of cardiovascular mortality included age, sex, race, eGFR, diabetes mellitus, coronary artery disease, hypertension, malignancy, hemoglobin, calcium, log alkaline phosphatase, AVA, RVSP, ejection fraction, indexed LV end‐diastolic diameter, indexed LV mass, indexed left atrial diameter, degree of diastolic dysfunction, and presence of symptoms.
The following variables were missing for a percentage of patients: body mass index for 3%, hemoglobin for 15%, albumin for 14%, calcium for 1%, alkaline phosphatase for 14%, AVA for 3%, RVSP for 14%, indexed LV end‐diastolic diameter for 9%, indexed LV mass for 10%, indexed left atrial size for 16%, and degree of diastolic dysfunction for 20%. We used multiple imputations (SAS proc MI) with the Markov chain Monte Carlo method and a single chain to impute 5 data sets. All multivariable Cox models were performed on each of the 5 imputed data sets, and parameter estimates were combined using SAS MIanalyze. All analyses were conducted using Linux SAS v9.4 (SAS Institute), and graphs were created using R 3.3.2 (R Foundation for Statistical Computing) and the cmprsk package.
Results
Of 11 183 patients with CKD stages 3 to 4 with an echocardiogram in our registry who were Ohio residents, 1455 patients had concomitant AS. After excluding 606 patients according to the exclusion criteria defined earlier (Figure 1), 839 patients with AS and CKD were included in the final study cohort. The mean age of the population was 78 years, half (50.8%) were men, and 91% were white. At baseline, 511 (60.9%), 252 (30%), and 76 (9.1%) of patients had CKD stages 3a, 3b, and 4, respectively. In our study, 22% (n=185) had mild AS, 42% (n=355) had moderate AS, 28% (n=233) had asymptomatic severe AS, and 8% (n=66) had severe AS with symptoms. Hypertension was present in 93.4%, 28.2% had diabetes mellitus, 37.1% had coronary artery disease, and 27.4% of patients had a history of malignancy (Table 1). Echocardiographic characteristics of the study population are presented in Table 2.
Table 1.
Baseline Characteristics of the Study Population
| Characteristic | Overall (N=839) | Mild AS (n=185) | Moderate AS (n=355) | Severe Asymptomatic AS (n=233) | Severe Symptomatic AS (n=66) | P Value |
|---|---|---|---|---|---|---|
| Age, y | 78.3±8.8 | 75.9±10.0 | 78.0±8.1 | 80.0±8.5 | 80.9±8.3 | <0.001 |
| Male | 426 (50.8) | 104 (56.2) | 184 (51.8) | 112 (48.1) | 26 (39.4) | 0.092 |
| Black | 70 (8.3) | 16 (8.6) | 34 (9.6) | 14 (6.0) | 6 (9.1) | 0.486 |
| Body mass index, kg/m2 | 29.7±6.6 | 30.7±7.1 | 29.7±6.4 | 28.8±6.3 | 29.1±6.9 | 0.029 |
| Systolic blood pressure, mm Hg | 133.0±21.3 | 134.6±22.2 | 132.9±21.3 | 131.3±19.6 | 134.8±24.2 | 0.405 |
| Diastolic blood pressure, mm Hg | 69.9±11.2 | 69.5±12.1 | 69.8±11.4 | 70.6±10.3 | 69.0±10.5 | 0.670 |
| Hypertension | 784 (93.4) | 176 (95.1) | 331 (93.2) | 219 (94.0) | 58 (87.9) | 0.227 |
| Diabetes mellitus | 237 (28.2) | 62 (33.5) | 101 (28.5) | 60 (25.8) | 14 (21.2) | 0.182 |
| Hyperlipidemia | 716 (85.3) | 150 (81.1) | 300 (84.5) | 207 (88.8) | 59 (89.4) | 0.110 |
| Coronary artery disease | 311 (37.1) | 50 (27.0) | 138 (38.9) | 92 (39.5) | 31 (47.0) | 0.008 |
| CHF | 87 (10.4) | 24 (13.0) | 33 (9.3) | 22 (9.4) | 8 (12.1) | 0.527 |
| Smoking | 39 (4.6) | 8 (4.3) | 19 (5.4) | 9 (3.9) | 3 (4.5) | 0.622 |
| Cerebrovascular disease | 138 (16.4) | 28 (15.1) | 63 (17.7) | 34 (14.6) | 13 (19.7) | 0.624 |
| Peripheral vascular disease | 57 (6.8) | 11 (5.9) | 25 (7.0) | 20 (8.6) | 1 (1.5) | 0.228 |
| History of malignancy | 230 (27.4) | 55 (29.7) | 105 (29.6) | 61 (26.2) | 9 (13.6) | 0.050 |
| CKD stage (eGFR range) | 0.766 | |||||
| Stage 3a (45–59 mL/min/1.73 m2) | 511 (60.9) | 111 (60.0) | 221 (62.3) | 141 (60.5) | 38 (57.6) | |
| Stage 3b (30–44 mL/min/1.73 m2) | 252 (30.0) | 56 (30.3) | 98 (27.6) | 75 (32.2) | 23 (34.8) | |
| Stage 4 (15–29 mL/min/1.73 m2) | 76 (9.1) | 18 (9.7) | 36 (10.1) | 17 (7.3) | 5 (7.6) | |
| Proteinuria | 112 (27.4) | 30 (32.3) | 51 (29.1) | 25 (22.3) | 6 (20.7) | 0.323 |
| eGFR, mL/min/1.73 m2 a | 46.0±10.4 | 46.0±10.8 | 46.2±10.7 | 45.9±9.7 | 45.3±10.7 | 0.933 |
| Hemoglobin, mg/dL | 12.3±1.9 | 12.0±2.0 | 12.3±1.9 | 12.5±1.7 | 12.4±2.0 | 0.054 |
| Albumin, g/dL | 4.0±0.49 | 3.9±0.54 | 4.0±0.53 | 4.1±0.39 | 4.0±0.33 | 0.003 |
| Calcium, mg/dL | 9.4±0.59 | 9.3±0.65 | 9.4±0.59 | 9.5±0.56 | 9.4±0.51 | |
| Alkaline phosphatase, U/L | 80.0 (65.0–101.0) | 80.0 (67.0–100.0) | 78.5 (64.0–101.0) | 80.0 (65.0–101.0) | 82.0 (65.0–100.0) | 0.944a |
| β‐Blocker | 533 (63.5) | 110 (59.5) | 232 (65.4) | 149 (63.9) | 42 (63.6) | 0.604 |
| ACEI/ARB | 617 (73.5) | 133 (71.9) | 263 (74.1) | 176 (75.5) | 45 (68.2) | 0.623 |
| Diuretic | 655 (78.1) | 154 (83.2) | 278 (78.3) | 174 (74.7) | 49 (74.2) | 0.169 |
| Statin | 576 (68.7) | 118 (63.8) | 242 (68.2) | 166 (71.2) | 50 (75.8) | 0.226 |
| Vasodilator | 222 (26.5) | 50 (27.0) | 96 (27.0) | 53 (22.7) | 23 (34.8) | 0.248 |
| Phosphate binder | 24 (2.9) | 7 (3.8) | 8 (2.3) | 6 (2.6) | 3 (4.5) | 0.619 |
Summary statistics are mean±SD, median (interquartile range), or n (%). CHF refers to history of previous hospitalizations deemed to be secondary to CHF. Continuous variables were compared using ANOVA for normally distributed variables and the Kruskal–Wallis test for nonnormally distributed variables, and categorical variables were compared using the Pearson χ2 test. Missing: body mass index, n=23; blood pressure, n=23; proteinuria, n=430; hemoglobin, n=126; albumin, n=114; calcium, n=6; alkaline phosphatase, n=116. ACEI indicates angiotensin‐converting enzyme inhibitor; ARB, angiotensin receptor blocker; AS, aortic stenosis; CHF, congestive heart failure; CKD, chronic kidney disease; eGFR, glomerular filtration rate (calculated using the Chronic Kidney Disease Epidemiology Collaboration equation).
Nonnormally distributed variable.
Table 2.
Baseline Echocardiographic Characteristics of the Study Population
| Echocardiography Findings | Overall (N=839) | Mild AS (n=185) | Moderate AS (n=355) | Severe Asymptomatic AS (n=233) | Severe Symptomatic AS (n=66) | P Value |
|---|---|---|---|---|---|---|
| AVA | 1.2±0.42 | 1.8±0.30 | 1.3±0.14 | 0.82±0.15 | 0.79±0.16 | <0.001 |
| Peak aortic jet velocity, m/s | 3.0±0.82 | 2.4±0.36 | 2.7±0.47 | 3.7±0.76 | 3.9±0.78 | <0.001 |
| Mean gradient, mm Hg | 21.7±13.6 | 11.8±3.7 | 16.7±6.7 | 32.6±13.8 | 37.0±17.5 | <0.001 |
| RVSP, mm Hg | 36.4±11.7 | 36.2±12.3 | 35.4±11.8 | 37.4±10.5 | 38.6±13.3 | 0.125 |
| <35 mm Hg | 373 (51.4) | 81 (51.3) | 181 (57.6) | 89 (44.9) | 22 (40.0) | |
| 35–44 mm Hg | 221 (30.5) | 47 (29.7) | 83 (26.4) | 68 (34.3) | 23 (41.8) | |
| 45–59 mm Hg | 96 (13.2) | 24 (15.2) | 36 (11.5) | 32 (16.2) | 4 (7.3) | |
| ≥60 mm Hg | 35 (4.8) | 6 (3.8) | 14 (4.5) | 9 (4.5) | 6 (10.9) | |
| Indexed LVEDD, cm/m2 | 2.3±0.34 | 2.3±0.35 | 2.3±0.34 | 2.3±0.33 | 2.3±0.33 | 0.757 |
| Indexed LVESD, cm/m2 | 1.4±0.33 | 1.4±0.33 | 1.4±0.32 | 1.4±0.34 | 1.5±0.33 | 0.554 |
| Indexed LA dimension, cm/m2 | 2.2±0.41 | 2.2±0.42 | 2.2±0.39 | 2.3±0.42 | 2.3±0.42 | 0.006 |
| Indexed LV mass, mg/m2 | 112.0±32.6 | 112.4±39.0 | 108.2±29.3 | 114.8±32.6 | 121.1±27.7 | 0.015 |
| Relative wall thickness | 0.58±0.15 | 0.56±0.15 | 0.57±0.13 | 0.60±0.15 | 0.63±0.19 | 0.001 |
| LVOT diameter, cm | 2.0±0.13 | 2.1±0.14 | 2.0±0.13 | 2.0±0.11 | 2.0±0.12 | <0.001 |
| LVOT velocity, m/s | 0.80±3.6 | 1.1±5.5 | 0.81±3.9 | 0.60±0.38 | 0.60±0.24 | 0.552 |
| LVEF, % | 59.0±5.4 | 59.8±5.6 | 58.6±5.3 | 58.9±5.3 | 59.1±6.4 | 0.113 |
| LV diastolic function | 0.144 | |||||
| Normal | 52 (7.9) | 21 (14.1) | 18 (6.6) | 9 (4.7) | 4 (8.2) | |
| Stage 1 | 517 (78.2) | 109 (73.2) | 215 (78.8) | 152 (80.0) | 41 (83.7) | |
| Stage 2 | 87 (13.2) | 18 (12.1) | 37 (13.6) | 28 (14.7) | 4 (8.2) | |
| Stage 3 | 5 (0.76) | 1 (0.67) | 3 (1.1) | 1 (0.53) | 0 (0.0) |
Summary statistics are mean±SD or n (%). Continuous variables were compared using ANOVA, and categorical variables were compared using the Pearson χ2 test. AS indicates aortic stenosis; AVA, aortic valve area; LA, left atrial; LV, left ventricular; LVEDD, left ventricular end‐diastolic diameter; LVEF, left ventricular ejection fraction; LVESD, left ventricular end‐systolic diameter; LVOT, left ventricular outflow tract; RVSP, right ventricular systolic pressure.
Survival Compared With Matched Controls With CKD in the Absence of AS
We were able to propensity match all CKD patients with AS to patients with CKD but no AS. Standardized differences of the variables included in the match (age, sex, race, ejection fraction, and eGFR) were <10% after matching and were <10% for each year of testing except 2011, for which it was 11%. Patients with CKD and AS had higher cardiac and all‐cause mortality compared with matched controls with CKD and no AS. Survival rates at 1, 3, and 5 years in patients with CKD and AS were 86.2%, 67.7%, and 51.3%, respectively. Propensity‐score matched controls with CKD but no AS had survival rates of 90.5%, 74.8%, and 63.0% at 1, 3, and 5 years, respectively. Cardiovascular survival rates for patients with AS were 95.5%, 85.1%, and 74.4% at 1, 3, and 5 years, respectively, and 97.0%, 91.5%, and 85.2% for those with no AS (Figure 2).
Figure 2.
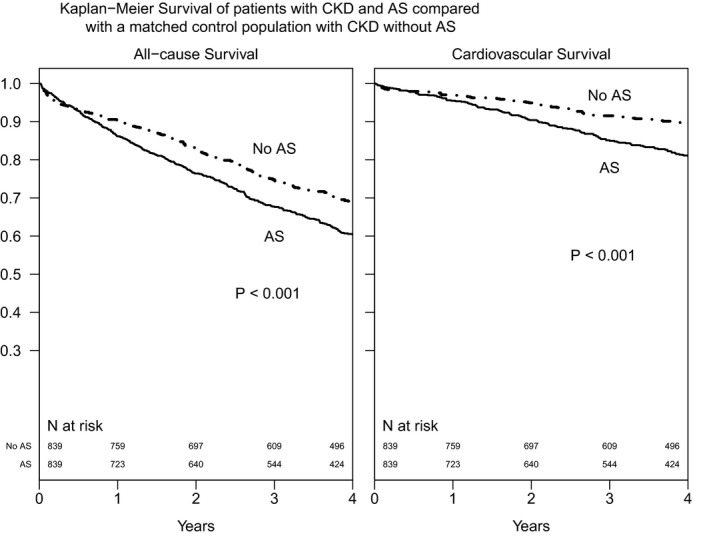
Kaplan–Meier survival curves of patients with CKD and AS compared with a matched control population of patients with CKD without AS. Cases and controls were propensity matched on age, sex, race, estimated glomerular filtration rate, ejection fraction, and year of echocardiogram. AS indicates aortic stenosis; CKD, chronic kidney disease.
Survival Among Patients With AS and CKD
At 4.0.3±2.3 years of follow‐up, there were 454 (54%) deaths, 203 (45%) of which were noted secondary to cardiovascular causes. There were 156 (19%) patients who underwent SAVR (96%) or TAVR (4%) during follow‐up. Primary indications for AVR were symptoms in 127 (81%), critical AS without symptoms in 16 (10%), concurrent coronary artery bypass grafting in 7 (4%), and rapid progression with severe calcification in 6 (4%). Among patients with CKD and severe symptomatic AS (n=66), 53% did not undergo AVR during follow‐up. Of 156 patients who underwent AVR on follow‐up, information on follow‐up eGFR between 1 and 12 months after AVR was available for 100 patients. Of those, 61 of 100 (61%) had some increase in eGFR after AVR. The median change in eGFR on follow‐up after AVR was an increase of 1.5 mL/min per 1.73 m2 per month (interquartile range: −1.6 to 5.1). The median percentage change in eGFR per month was an increase of 2.8% (interquartile range [P25]: −3.1% to 10.2%) compared with pre‐AVR eGFR values. Figure 3 shows the cumulative incidence of cardiovascular and other‐cause mortality as competing risks for all stages of AS. Figure S1 shows Kaplan–Meier survival curves for all‐cause mortality for all stages of AS. The unadjusted cumulative incidence of other‐cause and cardiac mortality, respectively, for patients with mild AS and CKD was 13% and 3% at 1 year, 23% and 9% at 3 years, and 35% and 15% at 5 years of follow‐up. Patients with CKD and mild or moderate AS had greater competing risks of noncardiac mortality than cardiac mortality, and long‐term mortality estimates were similar for patients with mild or moderate AS and CKD. Patients with severe AS had similar risks of cardiac and noncardiac mortality on follow‐up. Noncardiac and cardiac mortality, respectively, for patients with severe asymptomatic AS was 11% and 11% at 1 year, 20% and 27% at 3 years, and 26% and 37% at 5 years. Noncardiac and cardiac mortality, respectively, for patients with severe AS with symptoms was 25% and 13% at 1 year, 35% and 34% at 3 years, and 38% and 38% at 5 years.
Figure 3.
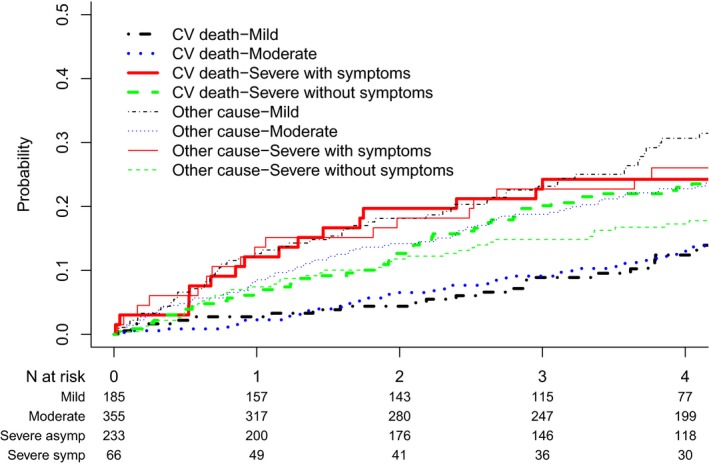
Cumulative incidence of cardiovascular (CV) and noncardiovascular mortality as competing risks in patients with aortic stenosis and concomitant chronic kidney disease based on severity of aortic stenosis.
On Cox multivariable analysis, age (hazard ratio [HR] per 10‐year increase: 1.35; 95% CI, 1.18–1.56), lower eGFR (HR per 10 mL/min per 1.73 m2: 1.18; 95% CI, 1.08–1.29), diabetes mellitus (HR: 1.28; 95% CI, 1.02–1.62), ejection fraction (HR per 5% lower: 1.15; 95% CI, 1.04–1.26), and higher RVSP (HR per 10‐mm Hg increase: 1.17; 95% CI, 1.07–1.28) were associated with greater risk of death, whereas AVR (time‐dependent covariate HR: 0.63; 95% CI, 0.45–0.88), higher albumin (HR per 1‐mg/dL increase: 0.77; 955 CI, 0.60–0.98), and hemoglobin (HR per 1‐mg/dL increase: 0.94; 95% CI, 0.88–0.996) were associated with lower risk of death (Table 3).
Table 3.
Predictors of All‐Cause Mortality in Patients With Concomitant AS and CKD
| HR (95% CI) | P Value | |
|---|---|---|
| Age per 10‐y increase | 1.35 (1.18–1.55) | <0.0001 |
| eGFR per 10‐mL/min/1.73 m2 decrease | 1.18 (1.08–1.29) | <0.001 |
| Diabetes mellitus | 1.28 (1.02–1.62) | 0.037 |
| Malignancy | 1.43 (1.15–1.77) | 0.001 |
| Hemoglobin per 1‐mg/dL increase | 0.94 (0.88–0.996) | 0.039 |
| Calcium per 1‐mg/dL increase | 0.84 (0.68–1.02) | 0.084 |
| Log alkaline phosphatase per 1‐U increase | 1.16 (0.89–1.50) | 0.271 |
| AVA per 0.1‐cm2 lower | 1.03 (0.996–1.05) | 0.087 |
| Presence of symptoms | 1.30 (1.02–1.66) | 0.035 |
| RVSP per 10‐mm/Hg increase | 1.17 (1.07–1.28) | <0.001 |
| LVEF per 5% decrease | 1.15 (1.04–1.26) | 0.005 |
| Indexed LA diameter, cm/m2 | 1.32 (0.98–1.78) | 0.068 |
| AVR/TAVR (time‐dependent) | 0.63 (0.45–0.88) | 0.006 |
Parameter estimates were derived using Cox proportional hazards models. P values obtained using MI analyze on 5 imputed data sets. The Cox model also adjusted for sex, race, body mass index, smoking, hypertension, hyperlipidemia, coronary artery disease, CHF, cerebrovascular disease, peripheral vascular disease, angiotensin‐converting enzyme inhibitor/angiotensin receptor blocker, β‐blocker, diuretic, vasodilator, serum albumin, serum alkaline phosphatase, indexed LVEDD, indexed LV mass, and degree of diastolic dysfunction. ACEI indicates angiotensin‐converting enzyme inhibitor; ARB, angiotensin receptor blocker; AS, aortic stenosis; AVA, aortic valve area; AVR, aortic valve replacement; CHF, congestive heart failure; CKD, chronic kidney disease; eGFR, glomerular filtration rate (calculated using the Chronic Kidney Disease Epidemiology Collaboration equation); HR, hazard ratio; LA, left atrial; LV, left ventricular; LVEDD, left ventricular end‐diastolic diameter; LVEF, left ventricular ejection fraction; RVSP, right ventricular systolic pressure; TAVR, transcatheter aortic valve replacement.
On competing‐risks multivariable analysis of cardiovascular mortality, age (subdistribution HR per 10‐year increase: 1.35; 95% CI, 1.08–1.69], AVA (subdistribution HR per 1‐cm2 decrease: 2.22; 95% CI, 1.31–3.7), and LV mass (subdistribution HR per 1‐g/m2 increase: 1.01; 95% CI, 1.001–1.01) were associated with higher risks for cardiovascular death. The eGFR was not a significant independent predictor of cardiac mortality in patients with AS on competing‐risks regression (P=0.129; Table 4).
Table 4.
Independent Predictors of Cardiac Mortality in Patients With AS and CKD
| sHR (95% CI) | P Value | |
|---|---|---|
| Age per 10‐y increase | 1.35 (1.08–1.69) | 0.008 |
| Male vs female sex | 0.89 (0.61–1.28) | 0.526 |
| Black vs white race | 0.98 (0.55–1.73) | 0.935 |
| Body mass index, kg/m2 | ||
| <25 | Ref | |
| 25–29.9 | 0.64 (0.42–0.97) | 0.036 |
| ≥30 | 0.85 (0.53–1.35) | 0.496 |
| eGFR per 10 mL/min/1.73 m2 lower | 1.12 (0.97–1.30) | 0.129 |
| Diabetes mellitus | 1.04 (0.71–1.51) | 0.855 |
| Coronary artery disease | 1.23 (0.87–1.74) | 0.249 |
| Hypertension | 0.69 (0.37–1.30) | 0.252 |
| Hemoglobin per 1‐mg/dL increase | 1.00 (0.91–1.10) | 0.990 |
| Calcium per 1‐mg/dL increase | 0.97 (0.73–1.30) | 0.853 |
| Log(alkaline phosphatase) per 1‐U increase | 1.38 (0.96–1.98) | 0.084 |
| AVA per 0.1‐cm2 lower | 1.08 (1.03–1.14) | 0.003 |
| RVSP per 10‐mm/Hg increase | 1.11 (0.96–1.29) | 0.169 |
| LVEF per 5% lower | 1.14 (0.97–1.33) | 0.108 |
| Indexed LVEDD | 1.15 (0.65–2.06) | 0.630 |
| Indexed LV mass | 1.01 (1.001–1.01) | 0.018 |
| Indexed LA size | 1.40 (0.89–2.20) | 0.143 |
| Degree of diastolic dysfunction | ||
| Normal | Ref | |
| Abnormal relaxation | 0.97 (0.46–2.01) | 0.924 |
| Stage 2 or 3 | 1.08 (0.48–2.43) | 0.856 |
| Presence of symptoms | 1.36 (0.92–2.00) | 0.124 |
Parameter estimates for sHRs for cardiac mortality derived using competing‐risks regression models for cardiac mortality censored at SAVR or TAVR. P values obtained using MI analyze on 5 imputed data sets. AS indicates aortic stenosis; AVA, aortic valve area; CKD, chronic kidney disease; eGFR, glomerular filtration rate (calculated using the Chronic Kidney Disease Epidemiology Collaboration equation); LA, left atrial; LV, left ventricular; LVEDD, left ventricular end‐diastolic diameter; LVEF, left ventricular ejection fraction; Ref, reference; RVSP, right ventricular systolic pressure; SAVR, surgical aortic valve replacement; sHR, subdistribution hazard ratio; TAVR, transcatheter aortic valve replacement.
Discussion
CKD affects up to 16 million US adults.7 It is associated with increased prevalence of other cardiovascular risk factors as well as noncardiac morbidities,32 and patients with CKD have significantly greater cardiovascular and all‐cause mortality8, 32 compared with patients with normal renal function. Our study provides important insights in the natural history of patients with AS and comorbid CKD. We examined long‐term outcomes in a cohort of 839 patients with AS and CKD and found that presence of AS was associated with >50% mortality at a mean follow‐up of 4 years. Cardiovascular deaths account for half of these deaths, significantly higher than in a matched population of CKD patients without AS. Although patients with mild and moderate AS and CKD had a higher competing risk of noncardiac mortality, patients with severe AS and CKD had a greater risk of cardiac mortality with time. In patients with AS and CKD, kidney function was associated with a greater risk of all‐cause mortality, with 18% higher hazard of death with every 10‐mL/min per 1.73 m2 decrease in eGFR, but was not independently associated with cardiac cause of death.
In patients without CKD, mild to moderate AS is associated with 75% event‐free survival at 2 years and 60% to 65% event‐free survival at 5 years.12, 33 Patients with asymptomatic severe AS in the absence of CKD have event‐free survival of 57% to 67% at 2 years and 33% at 5 years.20, 34 Notably, these studies included symptoms,20 AVR,12, 20, 33 and other cardiac events such as MI, stroke, and congestive heart failure33 in addition to death as outcomes, whereas our study focuses only on hard end points of cardiovascular and all‐cause mortality. CKD has been identified as an independent predictor of mortality in patients with severe asymptomatic AS in a study of 622 asymptomatic patients; however, only 4% of these patients had renal dysfunction.20 Samad et al recently published more contemporary data showing significantly worse 5‐year survival in patients with AS and CKD compared with those with AS without CKD, but cardiac and other‐cause mortality were not differentiated.17 In addition, these studies17, 20 defined CKD with a single cross‐sectional eGFR measurement and not 2 measurements separated by ≥3 months, as clinically recommended by CKD guidelines,29 which yields a more accurate assessment of reduced renal function. Our study extends the findings of Samad et al by reporting similar estimates of long‐term survival in patients with AS and CKD, and we report the contribution of cardiac and noncardiac causes toward mortality in this population. Although mild and moderate AS and CKD are associated with increased mortality on follow‐up, mortality is predominantly noncardiac and might not be secondary to AS. Presence of severe AS and CKD was associated with >50% mortality at 3 and 5 years, at least half cardiac in nature. Patients with severe symptomatic AS in the absence of AVR have 43% and 36% survival at 3 and 5 years, respectively, in the absence of AVR.35 High surgical risk and poor long‐term outcomes after AVR in patients with CKD are common reasons why these patients are not offered AVR. In our cohort, half of patients with symptomatic severe AS and CKD did not receive AVR, possibly because of increased surgical risk, and patients with symptomatic severe AS and CKD had significantly lower survival. However, AVR was also associated with improved survival in our cohort. Moreover, of people undergoing AVR, 60% had some improvement in their eGFR within 1 year after AVR. Although most people undergoing AVR in our cohort underwent surgical AVR, these estimates are higher than those reported in inoperable and high‐risk patients from the PARTNER 1 (Placement of Aortic Transcatheter Valve Trial) trial, in which 42% of 821 patients with reduced eGFR at baseline had improvement in eGFR after TAVR.36 This suggests that in many patients with AS and CKD, decreased renal perfusion from a low‐output state caused by severe AS may contribute to worsening kidney function that may improve once AS is resolved after AVR.
Our study also identifies factors associated with greater cardiac and all‐cause mortality in patients with AS and CKD. Most important, we found that each 10‐mL/min per 1.73 m2 decrease in eGFR in patients with CKD and AS was associated with a 18% increase in the risk of all‐cause death; however, decreased eGFR was not associated with increased risk of cardiac death in a competing‐risks analysis. Each 0.1‐cm2 decrease in AVA was associated with an 8% increase in risk of cardiac death. Pulmonary hypertension is a known risk factor for poor outcomes in patients with AS in the absence of valve replacement and after SAVR and TAVR.37, 38, 39, 40 Pulmonary hypertension is also very prevalent in patients with CKD without valvular disease and is independently associated with poor long‐term outcomes.41, 42 In our study cohort, almost half of all patients with AS and CKD had elevated pulmonary pressures (>35 mm Hg) on echocardiogram, and that result was associated with an increase in the risk of all‐cause mortality but not cardiac mortality in these patients. Diabetes mellitus and coronary disease were not independently associated with cardiac mortality, likely because of the possibility that AS (and, more important, AVR) was a much stronger factor associated with survival compared with diabetes mellitus or coronary artery disease. It is likely that patients with critical coronary artery disease were revascularized during AVR. In addition, it might be possible that in patients with advanced CKD, the fact that they tend to be sicker related to CKD might have outweighed the risk of coronary artery disease.
Our study has some important limitations. It is an observational cohort study, which limits any causal interpretation. These data were derived from a single large healthcare system; therefore, the results may not be generalizable to other healthcare systems and CKD populations with or without AS. We included only patients with AS and preserved LVEF because we did not want prior LV dysfunction to confound our outcomes. Consequently, we could not examine outcomes in patients with low‐flow, low‐gradient AS with comorbid CKD. Increased serum phosphorus and tertiary hyperparathyroidism play important roles in coronary and valvular calcification in CKD and have been associated with increased mortality in this population.9, 43 Because we did not have serum phosphorus and parathyroid hormone levels for all our patients, we could not adjust for those factors in our mortality analysis. We also could not examine the degree of calcification of the aortic valve and how that would contribute to outcomes, which has been shown to be related to event‐free survival in AS patients in some studies.12 Data on stroke‐volume index were not uniformly available for all patients and thus was not reported. Our study included patients enrolled from 2005 to 2012, with follow‐up through the end of 2013. Given that adoption of TAVR for higher risk patients such as those with CKD has increased since then, longer, more contemporary follow‐up would potentially increase the number of TAVRs on follow‐up in our cohort, which we were unable to do in the current study. Nevertheless, our study provides important information on the natural history of this high‐risk population of patients with AS and nondialysis CKD, which has not been well studied in the past. Finally, we obtained cause‐specific death data from the Ohio State Death Index files, which provide data to the National Death Index and were not independently verified. However, these death indexes have been considered reliable and used in several prior studies.44
In conclusion, patients with AS and concomitant CKD have poor survival compared with patients with CKD or AS alone. Although patients with CKD and mild or moderate AS had a greater proportion of noncardiac deaths on follow‐up, those with severe AS and CKD had similar risks of cardiac and all‐cause death, and both rates were significantly greater than those of patients with CKD or AS alone. Worsening kidney function manifested by eGFR reduction was independently associated with an increase in all‐cause mortality in this high‐risk population. However, we found that AVR was independently associated with improved survival. Our findings support the need for additional studies, including clinical trials among patients with moderate to severe CKD, to help us elucidate optimal clinical follow‐up, testing, and benefits from procedures such as AVR.
Disclosures
Patel is supported by the National Heart, Lung, and Blood Institute of the National Institutes of Health under award no. T32HL110837. The content is solely the responsibility of the authors and does not necessarily represent the official views of the National Institutes of Health. Desai is supported by the Haslam Family Endowed Chair in cardiovascular medicine. The remaining authors have no disclosures to report.
Supporting information
Table S1. Patient Characteristics Before and After Propensity Match
Table S2. Univariate Predictors of All‐Cause Mortality in Patients With Concomitant Aortic Stenosis and Chronic Kidney Disease
Figure S1. Kaplan–Meier survival curves of all‐cause mortality in patients with aortic stenosis and concomitant chronic kidney disease based on severity of aortic stenosis.
(J Am Heart Assoc. 2019;8:e009980 DOI: 10.1161/JAHA.118.009980.)
References
- 1. Nkomo VT, Gardin JM, Skelton TN, Gottdiener JS, Scott CG, Enriquez‐Sarano M. Burden of valvular heart diseases: a population‐based study. Lancet. 2006;368:1005–1011. [DOI] [PubMed] [Google Scholar]
- 2. Faggiano P, Antonini‐Canterin F, Erlicher A, Romeo C, Cervesato E, Pavan D, Piazza R, Huang G, Nicolosi GL. Progression of aortic valve sclerosis to aortic stenosis. Am J Cardiol. 2003;91:99–101. [DOI] [PubMed] [Google Scholar]
- 3. Cosmi JE, Kort S, Tunick PA, Rosenzweig BP, Freedberg RS, Katz ES, Applebaum RM, Kronzon I. The risk of the development of aortic stenosis in patients with “benign” aortic valve thickening. Arch Intern Med. 2002;162:2345–2347. [DOI] [PubMed] [Google Scholar]
- 4. Nishimura RA, Otto CM, Bonow RO, Carabello BA, Erwin JP, Guyton RA, O'Gara PT, Ruiz CE, Skubas NJ, Sorajja P. 2014 AHA/ACC guideline for the management of patients with valvular heart disease: a report of the American College of Cardiology/American Heart Association Task Force on Practice Guidelines. Circulation. 2014;129:2440–2492. [DOI] [PubMed] [Google Scholar]
- 5. Otto CM, Prendergast B. Aortic‐valve stenosis—from patients at risk to severe valve obstruction. N Engl J Med. 2014;371:744–756. [DOI] [PubMed] [Google Scholar]
- 6. Makkar RR, Fontana GP, Jilaihawi H, Kapadia S, Pichard AD, Douglas PS, Thourani VH, Babaliaros VC, Webb JG, Herrmann HC, Bavaria JE, Kodali S, Brown DL, Bowers B, Dewey TM, Svensson LG, Tuzcu M, Moses JW, Williams MR, Siegel RJ, Akin JJ, Anderson WN, Pocock S, Smith CR, Leon MB. Transcatheter aortic‐valve replacement for inoperable severe aortic stenosis. N Engl J Med. 2012;366:1696–1704. [DOI] [PubMed] [Google Scholar]
- 7. Coresh J, Selvin E, Stevens LA, Manzi J, Kusek JW, Eggers P, Van Lente F, Levey AS. Prevalence of chronic kidney disease in the United States. JAMA. 2007;298:2038–2047. [DOI] [PubMed] [Google Scholar]
- 8. Go AS, Chertow GM, Fan D, McCulloch CE, Hsu C‐Y. Chronic kidney disease and the risks of death, cardiovascular events, and hospitalization. N Engl J Med. 2004;351:1296–1305. [DOI] [PubMed] [Google Scholar]
- 9. Rattazzi M, Bertacco E, Del Vecchio A, Puato M, Faggin E, Pauletto P. Aortic valve calcification in chronic kidney disease. Nephrol Dial Transplant. 2013;28:2968–2976. [DOI] [PubMed] [Google Scholar]
- 10. Maher ER, Young G, Smyth‐Walsh B, Pugh S, Curtis JR. Aortic and mitral valve calcification in patients with end‐stage renal disease. Lancet. 1987;2:875–877. [DOI] [PubMed] [Google Scholar]
- 11. Ix JH, Shlipak MG, Katz R, Budoff MJ, Shavelle DM, Probstfield JL, Takasu J, Detrano R, O'Brien KD. Kidney function and aortic valve and mitral annular calcification in the Multi‐Ethnic Study of Atherosclerosis (MESA). Am J Kidney Dis. 2007;50:412–420. [DOI] [PubMed] [Google Scholar]
- 12. Rosenhek R, Klaar U, Schemper M, Scholten C, Heger M, Gabriel H, Binder T, Maurer G, Baumgartner H. Mild and moderate aortic stenosis. Natural history and risk stratification by echocardiography. Eur Heart J. 2004;25:199–205. [DOI] [PubMed] [Google Scholar]
- 13. Perkovic V, Hunt D, Griffin SV, du Plessis M, Becker GJ. Accelerated progression of calcific aortic stenosis in dialysis patients. Nephron Clin Pract. 2003;94:c40–c45. [DOI] [PubMed] [Google Scholar]
- 14. Kim D, Shim CY, Hong G‐R, Cho IJ, Chang H‐J, Ha J‐W, Chung N. Effect of end‐stage renal disease on rate of progression of aortic stenosis. Am J Cardiol. 2016;117:1972–1977. [DOI] [PubMed] [Google Scholar]
- 15. Kume T, Kawamoto T, Akasaka T, Watanabe N, Toyota E, Neishi Y, Wada N, Okahashi N, Yoshida K. Rate of progression of valvular aortic stenosis in patients undergoing dialysis. J Am Soc Echocardiogr. 2006;19:914–918. [DOI] [PubMed] [Google Scholar]
- 16. London GM, Pannier B, Marchais SJ, Guerin AP. Calcification of the aortic valve in the dialyzed patient. J Am Soc Nephrol. 2000;11:778–783. [DOI] [PubMed] [Google Scholar]
- 17. Samad Z, Sivak JA, Phelan M, Schulte PJ, Patel U, Velazquez EJ. Prevalence and outcomes of left‐sided valvular heart disease associated with chronic kidney disease. J Am Heart Assoc. 2017;6:e006044 DOI: 10.1161/JAHA.117.006044. [DOI] [PMC free article] [PubMed] [Google Scholar]
- 18. Faggiano P, Antonini‐Canterin F, Baldessin F, Lorusso R, D'Aloia A, Dei Cas L. Epidemiology and cardiovascular risk factors of aortic stenosis. Cardiovasc Ultrasound. 2006;4:1. [DOI] [PMC free article] [PubMed] [Google Scholar]
- 19. Palta S, Pai AM, Gill KS, Pai RG. New insights into the progression of aortic stenosis: implications for secondary prevention. Circulation. 2000;101:2497–2502. [DOI] [PubMed] [Google Scholar]
- 20. Pellikka PA, Sarano ME, Nishimura RA, Malouf JF, Bailey KR, Scott CG, Barnes ME, Tajik AJ. Outcome of 622 adults with asymptomatic, hemodynamically significant aortic stenosis during prolonged follow‐up. Circulation. 2005;111:3290–3295. [DOI] [PubMed] [Google Scholar]
- 21. D'Errigo P, Moretti C, D'Ascenzo F, Rosato S, Biancari F, Barbanti M, Santini F, Ranucci M, Miceli A, Tamburino C, Onorati F, Santoro G, Grossi C, Fusco D, Seccareccia F; OBSERVANT Research Group . Transcatheter aortic valve implantation versus surgical aortic valve replacement for severe aortic stenosis in patients with chronic kidney disease stages 3b to 5. Ann Thorac Surg. 2016;102:540–547. [DOI] [PubMed] [Google Scholar]
- 22. Gargiulo G, Capodanno D, Sannino A, Perrino C, Capranzano P, Stabile E, Trimarco B, Tamburino C, Esposito G. Moderate and severe preoperative chronic kidney disease worsen clinical outcomes after transcatheter aortic valve implantation: meta‐analysis of 4992 patients. Circ Cardiovasc Interv. 2015;8:e002220. [DOI] [PubMed] [Google Scholar]
- 23. Mohananey D, Griffin BP, Svensson LG, Popovic ZB, Tuzcu EM, Rodriguez LL, Kapadia SR, Desai MY. Comparative outcomes of patients with advanced renal dysfunction undergoing transcatheter aortic valve replacement in the United States from 2011 to 2014. Circ Cardiovasc Interv. 2017;10:e005477. [DOI] [PubMed] [Google Scholar]
- 24. Tamburino C, Capodanno D, Ramondo A, Petronio AS, Ettori F, Santoro G, Klugmann S, Bedogni F, Maisano F, Marzocchi A, Poli A, Antoniucci D, Napodano M, De Carlo M, Fiorina C, Ussia GP. Incidence and predictors of early and late mortality after transcatheter aortic valve implantation in 663 patients with severe aortic stenosis. Circulation. 2011;123:299–308. [DOI] [PubMed] [Google Scholar]
- 25. Gupta T, Goel K, Kolte D, Khera S, Villablanca PA, Aronow WS, Bortnick AE, Slovut DP, Taub CC, Kizer JR, Pyo RT, Abbott JD, Fonarow GC, Rihal CS, Garcia MJ, Bhatt DL. Association of chronic kidney disease with in‐hospital outcomes of transcatheter aortic valve replacement. JACC Cardiovasc Interv. 2017;10:2050–2060. [DOI] [PubMed] [Google Scholar]
- 26. Navaneethan SD, Jolly SE, Schold JD, Arrigain S, Saupe W, Sharp J, Lyons J, Simon JF, Schreiber MJ, Jain A. Development and validation of an electronic health record–based chronic kidney disease registry. Clin J Am Soc Nephrol. 2011;6:40–49. [DOI] [PMC free article] [PubMed] [Google Scholar]
- 27. Levey AS, Stevens LA, Schmid CH, Zhang YL, Castro AF, Feldman HI, Kusek JW, Eggers P, Van Lente F, Greene T. A new equation to estimate glomerular filtration rate. Ann Intern Med. 2009;150:604–612. [DOI] [PMC free article] [PubMed] [Google Scholar]
- 28. Levey AS, Stevens LA. Estimating GFR using the CKD Epidemiology Collaboration (CKD‐EPI) creatinine equation: more accurate GFR estimates, lower CKD prevalence estimates, and better risk predictions. Am J Kidney Dis. 2010;55:622–627. [DOI] [PMC free article] [PubMed] [Google Scholar]
- 29. Levin A, Stevens P, Bilous R, Coresh J, De Francisco A, De Jong P, Griffith K, Hemmelgarn B, Iseki K, Lamb E. Kidney Disease: Improving Global Outcomes (KDIGO) CKD Work Group: KDIGO 2012 clinical practice guideline for the evaluation and management of chronic kidney disease. Kidney Int Suppl. 2013;3:e150. [Google Scholar]
- 30. Baumgartner H, Hung J, Bermejo J, Chambers JB, Evangelista A, Griffin BP, Iung B, Otto CM, Pellikka PA, Quiñones M. Echocardiographic assessment of valve stenosis: EAE/ASE recommendations for clinical practice. J Am Soc Echocardiogr. 2009;22:442. [DOI] [PubMed] [Google Scholar]
- 31. Lang RM, Bierig M, Devereux RB, Flachskampf FA, Foster E, Pellikka PA, Picard MH, Roman MJ, Seward J, Shanewise JS, Solomon SD, Spencer KT, Sutton MS, Stewart WJ. Recommendations for chamber quantification: a report from the American Society of Echocardiography's Guidelines and Standards Committee and the Chamber Quantification Writing Group, developed in conjunction with the European Association of Echocardiography, a branch of the European Society of Cardiology. J Am Soc Echocardiogr. 2005;18:1440–1463. [DOI] [PubMed] [Google Scholar]
- 32. Sarnak MJ, Levey AS, Schoolwerth AC, Coresh J, Culleton B, Hamm LL, McCullough PA, Kasiske BL, Kelepouris E, Klag MJ, Parfrey P, Pfeffer M, Raij L, Spinosa DJ, Wilson PW. Kidney disease as a risk factor for development of cardiovascular disease: a statement from the American Heart Association Councils on Kidney in Cardiovascular Disease, High Blood Pressure Research, Clinical Cardiology, and Epidemiology and Prevention. Hypertension. 2003;42:1050–1065. [DOI] [PubMed] [Google Scholar]
- 33. Rossebo AB, Pedersen TR, Boman K, Brudi P, Chambers JB, Egstrup K, Gerdts E, Gohlke‐Barwolf C, Holme I, Kesaniemi YA, Malbecq W, Nienaber CA, Ray S, Skjaerpe T, Wachtell K, Willenheimer R. Intensive lipid lowering with simvastatin and ezetimibe in aortic stenosis. N Engl J Med. 2008;359:1343–1356. [DOI] [PubMed] [Google Scholar]
- 34. Rosenhek R, Binder T, Porenta G, Lang I, Christ G, Schemper M, Maurer G, Baumgartner H. Predictors of outcome in severe, asymptomatic aortic stenosis. N Engl J Med. 2000;343:611–617. [DOI] [PubMed] [Google Scholar]
- 35. Chizner MA, Pearle DL, deLeon AC Jr. The natural history of aortic stenosis in adults. Am Heart J. 1980;99:419–424. [DOI] [PubMed] [Google Scholar]
- 36. Beohar N, Doshi D, Thourani V, Jensen H, Kodali S, Zhang F, Zhang Y, Davidson C, McCarthy P, Mack M, Kapadia S, Leon M, Kirtane A. Association of transcatheter aortic valve replacement with 30‐day renal function and 1‐year outcomes among patients presenting with compromised baseline renal function: experience from the PARTNER 1 trial and registry. JAMA Cardiol. 2017;2:742–749. [DOI] [PMC free article] [PubMed] [Google Scholar]
- 37. Barbash IM, Escarcega RO, Minha S, Ben‐Dor I, Torguson R, Goldstein SA, Wang Z, Okubagzi P, Satler LF, Pichard AD, Waksman R. Prevalence and impact of pulmonary hypertension on patients with aortic stenosis who underwent transcatheter aortic valve replacement. Am J Cardiol. 2015;115:1435–1442. [DOI] [PubMed] [Google Scholar]
- 38. Ben‐Dor I, Goldstein SA, Pichard AD, Satler LF, Maluenda G, Li Y, Syed AI, Gonzalez MA, Gaglia MA Jr, Wakabayashi K, Delhaye C, Belle L, Wang Z, Collins SD, Torguson R, Okubagzi P, Aderotoye A, Xue Z, Suddath WO, Kent KM, Epstein SE, Lindsay J, Waksman R. Clinical profile, prognostic implication, and response to treatment of pulmonary hypertension in patients with severe aortic stenosis. Am J Cardiol. 2011;107:1046–1051. [DOI] [PubMed] [Google Scholar]
- 39. Malouf JF, Enriquez‐Sarano M, Pellikka PA, Oh JK, Bailey KR, Chandrasekaran K, Mullany CJ, Tajik AJ. Severe pulmonary hypertension in patients with severe aortic valve stenosis: clinical profile and prognostic implications. J Am Coll Cardiol. 2002;40:789–795. [DOI] [PubMed] [Google Scholar]
- 40. Melby SJ, Moon MR, Lindman BR, Bailey MS, Hill LL, Damiano RJ Jr. Impact of pulmonary hypertension on outcomes after aortic valve replacement for aortic valve stenosis. J Thorac Cardiovasc Surg. 2011;141:1424–1430. [DOI] [PMC free article] [PubMed] [Google Scholar]
- 41. Navaneethan SD, Wehbe E, Heresi GA, Gaur V, Minai OA, Arrigain S, Nally JV Jr, Schold JD, Rahman M, Dweik RA. Presence and outcomes of kidney disease in patients with pulmonary hypertension. Clin J Am Soc Nephrol. 2014;9:855–863. [DOI] [PMC free article] [PubMed] [Google Scholar]
- 42. Navaneethan SD, Roy J, Tao K, Brecklin CS, Chen J, Deo R, Flack JM, Ojo AO, Plappert TJ, Raj DS, Saydain G, Sondheimer JH, Sood R, Steigerwalt SP, Townsend RR, Dweik RA, Rahman M; Chronic Renal Insufficiency Cohort I . Prevalence, predictors, and outcomes of pulmonary hypertension in CKD. J Am Soc Nephrol. 2016;27:877–886. [DOI] [PMC free article] [PubMed] [Google Scholar]
- 43. Palmer SC, Hayen A, Macaskill P, Pellegrini F, Craig JC, Elder GJ, Strippoli GF. Serum levels of phosphorus, parathyroid hormone, and calcium and risks of death and cardiovascular disease in individuals with chronic kidney disease: a systematic review and meta‐analysis. JAMA. 2011;305:1119–1127. [DOI] [PubMed] [Google Scholar]
- 44. Use of National Death Index in Health Research. Available at: https://www.cdc.gov/nchs/data/ndi/ndi_bibliography_health_research.pdf. Accessed May 29, 2018.
Associated Data
This section collects any data citations, data availability statements, or supplementary materials included in this article.
Supplementary Materials
Table S1. Patient Characteristics Before and After Propensity Match
Table S2. Univariate Predictors of All‐Cause Mortality in Patients With Concomitant Aortic Stenosis and Chronic Kidney Disease
Figure S1. Kaplan–Meier survival curves of all‐cause mortality in patients with aortic stenosis and concomitant chronic kidney disease based on severity of aortic stenosis.