

Abstract
Background
Atherosclerotic cardiovascular disease (ASCVD) accounts for approximately one third of deaths in women. Although there is an established relationship between positive patient experiences, health‐related quality of life, and improved health outcomes, little is known about gender differences in patient‐reported outcomes among ASCVD patients. We therefore compared gender differences in patient‐centered outcomes among individuals with ASCVD.
Methods and Results
Data from the 2006 to 2015 Medical Expenditure Panel Survey, a nationally representative US sample, were used for this study. Adults ≥18 years with a diagnosis of ASCVD, ascertained by International Classification of Diseases, Ninth Revision (ICD‐9) codes and/or self‐reported data, were included. Linear and logistic regression were used to compare self‐reported patient experience, perception of health, and health‐related quality of life by gender. Models adjusted for demographics, socioeconomic status, and comorbidities. There were 21 353 participants included, with >10 000 (47%‐weighted) of the participants being women, representing ≈11 million female adults with ASCVD nationwide. Compared with men, women with ASCVD were more likely to experience poor patient–provider communication (odds ratio 1.25 [95% confidence interval 1.11–1.41]), lower healthcare satisfaction (1.12 [1.02–1.24]), poor perception of health status (1.15 [1.04–1.28]), and lower health‐related quality of life scores. Women with ASCVD also had lower use of aspirin and statins, and greater odds of ≥2 Emergency Department visits/y.
Conclusions
Women with ASCVD were more likely to report poorer patient experience, lower health‐related quality of life, and poorer perception of their health when compared with men. These findings have important public health implications and require more research towards understanding the gender‐specific differences in healthcare quality, delivery, and ultimately health outcomes among individuals with ASCVD.
Keywords: cardiovascular disease, health outcomes, health‐related quality of life, secondary prevention, women
Subject Categories: Women, Cardiovascular Disease, Quality and Outcomes, Health Services
Clinical Perspective
What Is New?
Among individuals with atherosclerotic cardiovascular disease, women were more likely to report poor communication with their healthcare providers, poor satisfaction with their healthcare experience, and poor self‐perception of health compared with their male counterparts, even after accounting for sociodemographic factors and other comorbidities.
Women with atherosclerotic cardiovascular disease were less likely to report aspirin and statin use and had increased use of the Emergency Department compared with their male counterparts.
There was no significant association between patient–provider gender concordance/discordance with respect to the majority of patient‐reported outcomes among individuals with atherosclerotic cardiovascular disease; however, female patients treated by female providers reported better health‐related quality of life in the physical component score.
What Are the Clinical Implications?
Women with atherosclerotic cardiovascular disease have worse patient‐reported outcomes.
This has important public health implications, and measures should be undertaken to promote equitable healthcare delivery.
More work is needed to understand why women report poorer communication with their healthcare providers and worse healthcare experience compared with men.
Introduction
Atherosclerotic cardiovascular disease (ASCVD) is one of the leading causes of morbidity and mortality,1, 2, 3 accounting for at least one third of deaths in women worldwide.4 In the United States, almost 48 million women are affected by ASCVD.4 The excess mortality from ASCVD in women compared with men5 has generated much interest in women's cardiovascular health in recent decades. Research studies have demonstrated an increased risk of hospitalization and higher healthcare expenditure among women compared with men with ASCVD.6, 7 Some studies have also shown that compared with men, women with ASCVD were more likely to experience delays in undergoing lifesaving revascularization procedures,8, 9 and less likely to undergo cardiac rehabilitation,10, 11, 12 or receive recommended preventive pharmacotherapies.13, 14 Major cardiovascular risk factors such as smoking, obesity, and diabetes mellitus also appear to be more deleterious in women than in men.15, 16 These overwhelming results have led to the intensification of research, focusing on the influence of sex and gender in cardiovascular disease.17 These efforts have improved the understanding of gender‐specific differences in cardiovascular disease and have resulted in an ≈30% reduction in female mortality from ASCVD.16
However, among individuals living with ASCVD, little is known regarding the health‐related quality of life (HRQoL) and patient healthcare experience based on gender, even though these patient‐reported matrices have been demonstrated to be associated with improved health outcomes among ASCVD patients.3 To bridge this gap in knowledge, using a nationally representative US sample of individuals with ASCVD, we compared the patient‐reported outcomes of their healthcare experience, self‐perception of health and HRQoL, based on gender. Understanding potential gender disparities in patient‐centered metrics could provide opportunities for more favorable healthcare delivery and outcomes among individuals with ASCVD.
Methods
Data Availability Statement
The authors will not directly release the data and materials from this project. However, the Medical Expenditure Panel Survey (MEPS) data sets used in this project are made available from the Agency for Healthcare Research and Quality to prospective researchers and are easily replicable from the methods described in the article.
Study Design and Sampling
Data from the MEPS were used to conduct this retrospective study. MEPS data are collected and sponsored by the Agency for Healthcare Research and Quality through national series of surveys containing information on individuals and families, their health service providers, and employers. The MEPS is reported annually and collects information on sociodemographic characteristics, patient experience, medical conditions, prescription medication, health resource utilization, associated costs, and sources of payment, reported in different data files. Additional information on healthcare utilization and cost is collected from physicians, hospitals, and pharmacies. To be nationally representative, person‐weight and variance estimation stratum are assigned to each respondent to account for survey nonresponse and the characteristics of the national population of the survey year.
To obtain comprehensive information on each participant, using unique person identifiers, we merged 3 different yearly MEPS files: full‐year consolidated data files, medical conditions files, and the prescription medicine files, each of which contains specific information on the participants. The full‐year consolidated data files contain sociodemographic information, health resource utilization, and information related to patient healthcare experience and healthcare expenditure. The medical conditions files contain information on self‐reported and International Classification of Diseases, Ninth Revision, Clinical Modification (ICD‐9‐CM) diagnoses of medical conditions. The prescription medicine files contain information on names of medications, drug codes, and dates. According to the Department of Health and Human Services guidelines, this study was exempt from Institutional Review Board review because MEPS is a de‐identified, publicly available data set.
We pooled information from 2006 to 2015 MEPS data (Figure 1). For this analysis, individuals ≥18 years of age with a diagnosis of ASCVD (coronary artery disease, stroke, and/or peripheral artery disease, ascertained by self‐report or any of the following ICD‐9‐CM codes: 410, 413, 414, 433–437, 440, and 443, respectively) with positive sampling weights (for national representativeness) were included.
Figure 1.
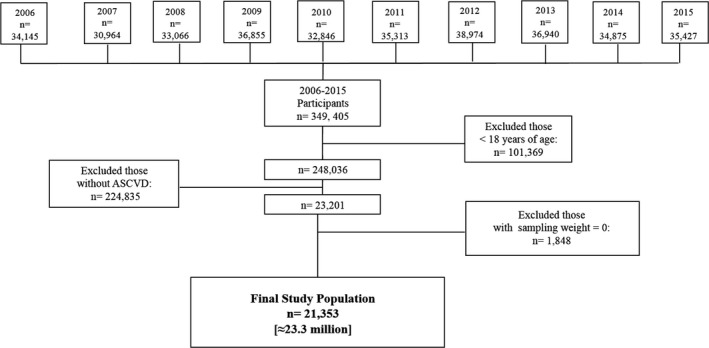
Flow chart of the patient selection process. ASCVD indicates atherosclerotic cardiovascular disease.
Study Variables
Patient–provider communication
Annually, participants of the MEPS answered questionnaires derived from the Consumer Assessment of Healthcare Providers and Systems survey. Responses to the following communication‐related questions recommended by the Consumer Assessment of Healthcare Providers and Systems consortium were used to assess patient–provider communication (PPC): (1) How often healthcare providers explained things in a way that was easy to understand? (2) How often providers showed respect for what you had to say? (3) How often providers spent enough time with you? (4) How often providers listened carefully to you? The responses to these questions were reported on a 4‐point Likert scale: 1‐never, 2‐sometimes, 3‐usually, and 4‐always. Healthcare provider refers to both physicians and nonphysicians. As recommended by Consumer Assessment of Healthcare Providers and Systems, “never” and “sometimes” responses were collapsed into a single variable labeled “never/sometimes.”3 The responses were therefore recoded and labeled as 1‐never/sometimes, 2‐usually, and 3‐always (Table S1). The responses to these 4 questions were summed up to give a total score ranging from 4 to 12. We generated a weighted average response from 1 to 3, represented as 1—“Poor PPC,” 2—“Average PPC,” 3—“Optimal PPC,” and then combined “Average” and “Optimal” PPC to obtain a binary variable (Poor PPC versus Average/Optimal PPC), using poor PPC as the outcome.3 Similarly, in the analysis of the responses to each of the PPC‐related questions, “never/sometimes” responses were used as the outcome of interest (“never/sometimes” versus “usually/always”) (Table S1). The responses to the PPC‐related questions are also components of the ALERT model (Always, Listen Carefully, Explain Things Understandably, Respect What the Patient Has to Say, Time Management), designed to help physicians recall the Consumer Assessment of Healthcare Providers and Systems questions.3, 18
Patient satisfaction
Patient satisfaction with health care received was assessed using participants’ response to the question: “Rating of health care from all doctors and other health providers,” from 0 (worst health care possible) to 10 (best health care possible). To truly identify unsatisfied respondents, we classified this variable into 2 categories: “Poor Patient Satisfaction” (scores ≥0 to ≤3) or “Excellent/Good Patient Satisfaction” (scores ≥4 to ≤10).
Healthcare‐related quality of life and perception of health status
We defined HRQoL using the summary scores from the physical‐health component score (PCS) and the mental‐health component score (MCS) of the 12‐item Short Form version 2, with PCS and MCS scores ranging from 0 (worst health status possible) to 100 (best health status possible). To detect the mean difference in HRQoL based on gender, we analyzed these summary scores as continuous variables. We also further divided the summary scores into quartiles, using the lowest quartile in both the physical and mental component to reflect poor HRQoL.
Information on self‐perception of overall health was collected at 3 different points annually. The responses were provided on a 5‐point Likert scale: 1‐excellent, 2‐very good, 3‐good, 4‐fair, and 5‐poor. It was further dichotomized it into a binary variable, with fair and poor responses as a single variable labeled as “Poor” (average score ≥4) and excellent, very good and good responses combined and labeled as “Good” (average score <4).
ASCVD medication utilization
Given the established role of aspirin and statin medications for the secondary prevention management of ASCVD, we ascertained the utilization of these medications by gender as a quality‐of‐care indicator among these individuals with ASCVD.3 During the data collection process, MEPS participants provided the names of their prescribed medications and where they were obtained. Agency for Healthcare Research and Quality researchers collected more detailed information on these medications, from the drug stores and pharmacies, with the consent of the respondents.3 Lipid‐lowering medications containing a 3‐hydroxy‐3‐methylglutaryl coenzyme A agent were coded as statins.3 A self‐reported response to the question posed by the Agency for Healthcare Research and Quality researchers: “does the person take aspirin frequently?” was used to measure aspirin use.3
Healthcare resource utilization
Information on the total number of Emergency Department visits and hospitalizations per survey year is contained in the MEPS full‐year consolidated file. Two or more Emergency Department visits or hospitalizations per survey year were used as a measure of increased health resource utilization.3
Gender of the respondent and other covariates
The gender of the MEPS participants was used as the primary predictor variable. Additional variables used for this study include age, race/ethnicity, family income, health insurance, education, geographical region, marital status, employment status, modified Charlson Comorbidity Index (without cardiovascular components) and cardiovascular modifiable risk factor (CRF) profile. We classified sociodemographic characteristics into various subgroups: 4 categories were used for age (18–39, 40–64, 65–74, and ≥75 years); 4 categories for race/ethnicity (non‐Hispanic White, black, Asian, and Hispanic); 4 categories for family income (poor/very low income [<125% of the federal poverty level], low income [125% to <200% federal poverty level], middle income [200% to <400% federal poverty level], and high income [≥400% federal poverty level]); 5 categories for health insurance (uninsured, Medicaid, private, Medicare, and a combination of private and public insurance); 3 for education (less than high school, high school/Graduate Educational Development, and some college or higher); 4 for geographical region (Northeast, Midwest, South, and West); 5 for marital status (married, widowed, divorced, separated, and never married); 3 for employment status (currently unemployed, currently employed, and currently unemployed but was employed within the past 12 months); and 3 categories for modified Charlson Comorbidity Index (0, 1, and ≥2). Individuals with self‐report and/or ICD‐9 diagnosis of hypertension; ICD‐9 code 401, diabetes mellitus; ICD‐9 code 250, and dyslipidemia; ICD‐9 code 272, received a score of “1” for each unfavorable cardiovascular risk factor (Table S2). Individuals reporting inadequate physical exercise (lack of participation in moderate‐vigorous physical activity for ≥30 minutes, for ≥5 times/wk), currently smoking, and obese (body mass index ≥30 kg/m2) also received a score of “1” for each unfavorable risk factor (Table S2). The total of the unfavorable risk factors per individual was used to classify their CRF profile into 3 categories: “Poor CRF Profile” (≥4 CRFs), “Average CRF Profile” (2–3 CRFs), or “Optimal CRF Profile” (0–1 CRFs). The responses of the MEPS participants to the question “Is Your Provider Male or Female” were used to identify the gender of the healthcare provider. We gender‐matched the respondents and their healthcare providers to evaluate the influence of patient–provider gender concordance/discordance on patient‐reported outcomes among individuals with ASCVD.
Statistical Analysis
All statistical analyses were conducted using Stata, version 13.1 (StataCorp, LP, College Station, TX), with a P<0.05 considered as statistically significant. All analyses took into consideration the complex survey‐specific design of MEPS, and used appropriate variance estimation and person‐level weights to achieve national representativeness. We used χ2 tests to compare demographic characteristics in the study sample. Linear regression models were used to measure the association of gender (comparing women with men) with the HRQoL scores (continuous), and logistic regression models were applied for all other binary outcomes. All linear and logistic regression models were adjusted for age, race/ethnicity, region, level of income, level of education, health insurance, Charlson Comorbidity Index, and modifiable risk factors of ASCVD. Similar measures of association were used to compare patient‐reported outcomes, based on patient–provider gender match. A patient–provider pair was said to be concordant if they were of the same gender, and discordant if they were of different gender. Finally, we included an interaction term between the gender of the participants and patient–provider gender concordance to assess for any statistically significant effect modification on the various patient‐reported outcomes measured.
Results
Sample Characteristics
There were 349 405 individuals sampled in the MEPS from 2006 to 2015, of which 21 353 were included in our study, translating to about 23.3 million noninstitutionalized US civilian adults with ASCVD (Figure 1). A description of the sample population is shown in Table 1. Over 10 000 (47%) of the participants were women (representing ≈11 million female adults with ASCVD nationwide). The majority of the participants were non‐Hispanic white, middle‐aged, from the southern region of the country, and of higher socioeconomic strata. Women were more likely than men to be unemployed, have less than a high school education, and be widowed/divorced but more likely to have a regular healthcare provider.
Table 1.
Weighted Sample Characteristics of Noninstitutionalized US Adults With ASCVD
| Women | Men | P Value | |
|---|---|---|---|
| N | 10 036 | 11 317 | |
| Weighted sample | 10 940 309 | 12 336 944 | |
| Age groups (y) (weighted %) | |||
| 18–39 | 5.3 | 4.5 | <0.001 |
| 40–64 | 35.9 | 39.4 | |
| 65–74 | 22.8 | 28.2 | |
| ≥75 | 36.0 | 27.9 | |
| Race/ethnicity (weighted %) | |||
| Non‐Hispanic white | 74.5 | 79.5 | <0.001 |
| Black | 13.6 | 9.2 | |
| Asians | 2.1 | 2.7 | |
| Hispanics | 9.8 | 8.6 | |
| Insurance status (weighted %) | |||
| Uninsured | 5.6 | 6.2 | <0.001 |
| Private | 21.3 | 26.2 | |
| Medicaid | 10.9 | 8.0 | |
| Medicare | 47.3 | 44.3 | |
| Private+public | 14.9 | 15.3 | |
| Education (weighted %) | |||
| Less than high school | 27.1 | 24.3 | <0.001 |
| High school/GED | 48.5 | 46.6 | |
| Some college or higher | 24.4 | 29.1 | |
| Marital status (weighted %) | |||
| Married | 40.0 | 66.7 | <0.001 |
| Widowed | 31.7 | 8.9 | |
| Divorced | 16.8 | 13.6 | |
| Separated | 2.9 | 2.3 | |
| Never married | 8.6 | 8.5 | |
| Level of income (weighted %) | |||
| High income | 25.3 | 38.2 | <0.001 |
| Middle income | 28.9 | 29.6 | |
| Low income | 19.2 | 15.1 | |
| Poor/very low income | 26.6 | 17.1 | |
| Region (weighted %) | |||
| Northeast | 18.2 | 18.5 | <0.001 |
| Midwest | 22.6 | 23.0 | |
| South | 40.9 | 39.4 | |
| West | 18.3 | 19.1 | |
| Employment status (weighted %) | |||
| Currently unemployed | 76.3 | 63.8 | <0.001 |
| Currently employed | 21.8 | 33.7 | |
| Currently unemployed but was employed within the past 12 mo | 1.9 | 2.5 | |
| Regular healthcare provider (weighted %) | |||
| Has a regular healthcare provider | 92.7 | 91.6 | <0.03 |
| Does not have a regular healthcare provider | 7.3 | 8.4 | |
ASCVD indicates atherosclerotic cardiovascular disease; GED, Graduate Educational Development.
Patient Experience
A greater proportion of women with ASCVD reported poor communication with their healthcare providers (12% of men versus 15% of women, P<0.001) (Figure 2). In analyses adjusted for demographics, socioeconomic factors, and comorbidities (Table 2), compared with men, women with ASCVD were more likely to report an overall worse healthcare experience, having a higher odds of reporting that their healthcare provider never/sometimes listened (odds ratio [OR] 1.23, 95% confidence interval [CI] 1.07–1.42), never/sometimes showed respect for their opinion (OR 1.20, 95% CI 1.04–1.38), and never/sometimes spent enough time with them (OR 1.36, 95% CI 1.20–1.54) (Table 2). Overall, compared with men, women with ASCVD had 25% higher odds of experiencing poor communication with their healthcare providers (summary score, OR 1.25, 95% CI 1.11–1.41).
Figure 2.
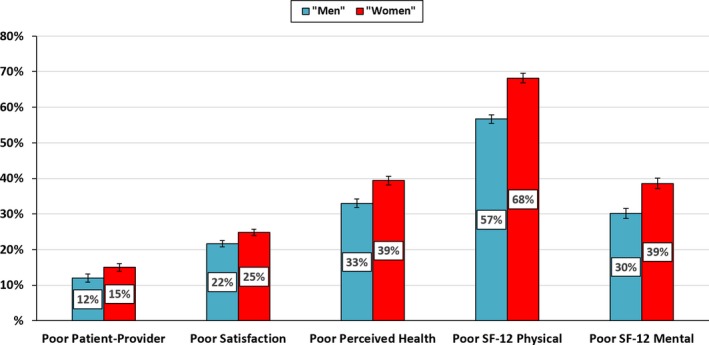
Poor patient‐reported outcomes among US adults with ASCVD, stratified by gender. Poor Patient‐Provider refers to Communication. ASCVD indicates atherosclerotic cardiovascular disease; SF‐12, 12‐item Short Form.
Table 2.
| OR (95% CI)a | |
|---|---|
| Patient healthcare experience (in women compared with men) | |
| Patient–provider communication | |
| Poor patient–provider communication (summary score) | 1.25 (1.11–1.41) |
| Individual components of patient–provider communication | |
| Doctor never/sometimes listened to you | 1.23 (1.07–1.42) |
| Doctor never/sometimes explained so you understood | 1.07 (0.92–1.25) |
| Doctor never/sometimes showed respect | 1.20 (1.04–1.38) |
| Doctor never/sometimes spent enough time with you | 1.36 (1.20–1.54) |
| Patient satisfaction with health care | |
| Poor patient satisfaction | 1.12 (1.02–1.24) |
| Patient perception of general health (in women compared with men) | |
| Poor perceived health status | 1.15 (1.04–1.28) |
| Healthcare‐Related Quality of Life (in Women Compared With Men) | Adjusted Mean Difference (95% CI)b |
|---|---|
| SF‐12 PCS | −2.08 (−2.55 to −1.61) |
| SF‐12 MCS | −1.57 (−2.01 to −1.13) |
ASCVD indicates atherosclerotic cardiovascular disease; CI, confidence interval; MCS, mental‐health component score; MEPS, Medical Expenditure Panel Survey; OR, odds ratios; PCS, physical‐health component score; SF‐12, 12‐item short form.
ORs were from logistic regression models.
Beta‐coefficients were from linear regression models.
All models compared women with men and were adjusted for age, race/ethnicity, level of income, region, health insurance, educational status, modified Charlson Comorbidity Index (without the cardiovascular component), and cardiovascular risk factors.
One in 4 women with ASCVD were dissatisfied with the health care received from their providers. A lesser proportion of men reported dissatisfaction with their healthcare providers (22% of men versus 25% of women, P<0.001) (Figure 2). Women also had 12% higher adjusted odds of reporting poor satisfaction with health care, when compared with men (OR 1.12, 95% CI 1.02–1.24) (Table 2).
Perception of Health and HRQoL
More women than men self‐perceived their health status as poor (33% of men versus 39% of women, P<0.001) (Figure 2). Among those with ASCVD, an individual's gender was significantly associated with the perception of overall health status; compared with men, women had 15% higher adjusted odds of reporting that their health status was poor (OR 1.15, 95% CI 1.04–1.28) (Table 2).
There were gender‐specific differences in HRQoL among individuals with ASCVD; women with ASCVD had worse HRQoL when compared with men. Overall, women had significantly lower scores on both the 12‐item short form PCS and MCS scales, used to assess HRQoL, with women reporting poorer scores for both the PCS and MCS measurements when compared with men (68% versus 57%, and 39% versus 30%, respectively) (Figure 2). In adjusted linear regression analyses (Table 2), women with ASCVD were more likely to have worse HRQoL scores with a mean difference of −2.08 (95% CI −2.55, −1.61) in PCS and −1.57 (95% CI −2.01, −1.13) in MCS when compared with men. Results were similar in models further adjusted for provider type and provider gender (Table S3).
As displayed in Table 3, female participants were less likely to perceive their health status as poor if they were gender‐concordant with their healthcare provider (OR 0.78, 95% CI 0.64, 0.94) and were more likely to attain higher scores in the physical component of the HRQoL item, when compared with a gender‐discordant pair. Overall, patient–provider gender concordance/discordance did not seem to show any significant association with the majority of patient‐reported outcomes among individuals with ASCVD (Table 3). There were no significant interactions between the gender of the participants and patient–provider gender concordance on any of the patient‐reported outcome measures, with the exception of the physical component score of the HRQoL item; P for interaction=0.03.
Table 3.
Patient–Provider Gender Match and Patient‐Reported Outcomes Among US Adults With ASCVD, Stratified by the Gender of the Patient—MEPS 2006–2015.a , b , c , d , e , f
| Patient‐Reported Health Outcomes | Patient–Provider Gender Match | |
|---|---|---|
| Male Participants | Female Participants | |
| Concordance vs Discordance | Concordance vs Discordance | |
| Patient healthcare experience | ||
| Patient–provider communication | ||
| Poor patient–provider communication (summary score)—(OR [95% CI])a | 1.10 (0.78–1.56) | 1.12 (0.88–1.43) |
| Individual components of patient–provider communication | ||
| Doctor never/sometimes listened to you (OR [95% CI])a | 1.18 (0.79–1.74) | 1.16 (0.87–1.56) |
| Doctor never/sometimes explained so you understood (OR [95% CI])a | 0.99 (0.69–1.41) | 1.19 (0.88–1.62) |
| Doctor never/sometimes showed respect [OR (95% CI)]a | 1.10 (0.74–1.66) | 1.21 (0.92–1.59) |
| Doctor never/sometimes spent enough time with you (OR [95% CI])a | 1.12 (0.81–1.54) | 0.99 (0.75–1.29) |
| Patient satisfaction with health care | ||
| Poor patient satisfaction—(OR [95% CI])a | 0.98 (0.73–1.31) | 1.08 (0.88–1.33) |
| Patient perception of general health | ||
| Poor perceived health status—(OR [95% CI])a | 0.96 (0.76–1.21) | 0.78 (0.64–0.94) |
| Healthcare‐related quality of life | ||
| SF‐12 PCS (adjusted mean difference [95% CI])b , e | −0.34 (−1.35 to 0.67) | 1.66 (0.81–2.50) |
| SF‐12 MCS (adjusted mean difference [95% CI])b | 0.43 (−0.53 to 1.38) | −0.22 (−1.16 to 0.73) |
ASCVD indicates atherosclerotic cardiovascular disease; CI, confidence interval; MCS, mental component score; MEPS, Medical Expenditure Panel Survey; OR, odds ratio; PCS, physical component score; SF‐12, 12‐item short form.
ORs were from logistic regression models.
Beta‐coefficients were from linear regression models.
All models compared patient–provider gender‐concordant groups with discordant groups and were adjusted for age, race/ethnicity, level of income, region, health insurance, educational status, modified Charlson Comorbidity Index (without the cardiovascular component), and cardiovascular risk factors.
There were no significant interactions between the gender of the participants and patient–provider gender concordance on any of the patient‐reported outcome measures, with the exception of the PCS of the health‐related quality of life item as noted.
P for interaction (participant gender×patient–provider gender concordance) on SF‐12 PCS=0.03.
Concordance—participant and healthcare provider are of the same gender; Discordance—participant and healthcare provider are not of the same gender.
In Table 4, the gender‐specific differences in the surrogate indicators for quality of cardiovascular care and health resource utilization are shown. Compared with men with ASCVD, women less likely to report use of aspirin (OR 0.65, 95% CI 0.58, 0.72) and statin use (OR 0.55, 95% CI 0.48, 0.62). Women with ASCVD were 1.28 times more likely to utilize the Emergency Department 2 or more times per survey year, compared with men (OR 1.28, 95% CI 1.11, 1.46).
Table 4.
Gender Differences in Surrogate Clinical Outcomes Among Individuals With ASCVD, MEPS 2006–2015a
| Yes vs No; OR (95% CI)a | |
|---|---|
| Surrogate measures for clinical outcomes (in women compared with men) | |
| Statin use | 0.55 (0.48–0.62) |
| Aspirin use | 0.65 (0.58–0.72) |
| ≥2 ED visits/y | 1.28 (1.11–1.46) |
| ≥2 hospitalizations visits/y | 1.05 (0.88–1.25) |
ASCVD indicates atherosclerotic cardiovascular disease; CI, confidence interval; ED, Emergency Department; MEPS, Medical Expenditure Panel Survey; OR, odds ratio.
ORs were from logistic regression models. Models compared women with men and were adjusted for age, race/ethnicity, level of income, region, health insurance, educational status, modified Charlson Comorbidity Index (without the cardiovascular component), and cardiovascular risk factors.
Further analyses also showed that trends in gender differences in patient‐reported outcomes among individuals with ASCVD remained mostly the same, even after stratification by race/ethnicity, age, level of income, and insurance status (Figures S1 through S5).
Discussion
In a nationally representative sample of the US population with ASCVD, women were more likely to report a poor patient experience (poorer patient–provider communication and lower satisfaction with the health care received) when compared with men. Additionally, women were more likely to have a poor perception of their health status and a lower HRQoL when compared with men.
Patient experience is a key element of patient‐centered care. Evidence on the influence of gender on patient experience has been conflicting; some studies suggest that women report more effective communication,19 and are more satisfied with their health care when compared with men.20 In contrast, other studies report that women are more likely to be dissatisfied with the health care received than men.21, 22, 23 A prior analysis using data from the 2002 MEPS found that among all US adults who had a healthcare experience in the past year, women were less likely than men to feel their providers always spent enough time with them.24 This is consistent with our findings from the 2006 to 2015 MEPS showing that women with ASCVD were more likely to report poorer patient–provider communication than men.
Although a positive healthcare experience has been shown to be associated with improved health outcomes among ASCVD patients,3 there is a paucity of information on the influence of gender on patient experience among ASCVD patients specifically. This current study demonstrates that among individuals with ASCVD, women are more likely to have a negative healthcare experience when compared with men. Our results are similar to the findings shown among surgical patients, which demonstrated lower satisfaction among women compared with men.25, 26, 27, 28 Although the exact mechanism underlying the poor patient experience among female patients is unclear, women may be more assertive, have higher expectations and/or desire more participatory and interactive encounters with their healthcare providers.19 These social expectations may influence the interpretation of the communication skills of the healthcare provider to a greater degree, hence impacting the overall patient satisfaction with health care. Negative patient experience may be a contributing factor to some of the worse outcomes demonstrated among women with ASCVD. It is therefore important to explore the likely mechanisms responsible for the poor patient experience among women with ASCVD and possible solutions to address these disparities, which may provide better chances for improved and equitable healthcare delivery.
Certain characteristics of the healthcare provider, such as type of provider (physician versus nonphysician)29, 30 and gender of the healthcare provider have been associated with patient‐reported outcomes.31, 32, 33 Although there is a scarcity of information addressing the interplay between these patient and provider characteristics among individuals with ASCVD, overall, reports on the influence of the gender of the healthcare provider and patient–provider gender concordance on patient experience has been mixed.31, 32, 33, 34, 35 Of note, a recent study by Greenwood et al of patients with acute myocardial infarction found a higher mortality for female patients treated by male physicians, but similar outcomes for both male and female patients treated by female physicians.34 This study and others35 suggest that outcomes may be better for female patients treated by female physicians. In the study by Greenwood et al, the authors did find an association of better outcomes for female patients if the treating male physicians had worked with more female colleagues and had more experience in treating women patients in the past, compared with male physicians who had not.
Gender disparities in perceived patient–provider communication may be 1 possible explanation for worse outcomes in women with ASCVD. The findings in this current study, which demonstrated poorer patient‐reported outcomes among women with ASCVD when compared with men, remained grossly the same after adjusting for provider factors including provider gender. However, female participants had higher scores on the physical component of the HRQoL item if they were gender concordant with their healthcare provider (versus gender discordant), whereas there was no association by provider concordance status in male patients.
Positive patient‐reported outcomes such as HRQoL and perception of health have been demonstrated to be associated with improved survival and health outcomes, playing a particularly important role among cancer patients.36 However, these patient‐centered measures have been shown to be poor among individuals with cardiovascular disease,37 with some gender‐specific differences; in post–myocardial infarction patients, HRQoL and self‐perception of cardiovascular risk factors have been demonstrated to be worse among women when compared with men.38, 39, 40 Across all indications for coronary angiography, women reported lower HRQoL than men irrespective of the severity or treatment for coronary artery disease.41 These results align with those generated from this study, as we show that women with ASCVD had a lower HRQoL, which was more prominent in the physical functioning aspect of their quality of life, and a poorer perception of their overall health status when compared with men.
Gender‐specific differences have also been described in the management of cardiovascular disease. Compared with men, women were less likely to undergo a coronary artery bypass graft42 and were less likely to receive evidence‐based pharmacological and preventive therapies at discharge following revascularization and/or myocardial infarction, which can contribute to worse clinical outcomes.42, 43, 44 This current study also found that women with ASCVD were less likely to report the use of ASCVD‐preventive therapies (eg, aspirin and statins), when compared with men. With the “Go Red For Women” campaign introduced by the American Heart Association and the National Heart, Lung, and Blood Institute in 2001–2002, there has been an increase in the awareness of cardiovascular disease among women.43 However, significant gender differences still exist in the management and outcomes of cardiovascular disease, so there is still more work that needs to be done to optimize cardiovascular health in women.
Aside from biological sex differences in the manifestation of ASCVD, gender plays a major role in the social, environmental, and psychological aspects of life, influencing health expectations, healthcare‐seeking behavior, and perception of health.45 Women experience an escalated demand for domestic and caregiving responsibilities, and this is particularly prominent among families of ethnic minorities.46 This is often associated with psychosocial stress that is more common in women,47, 48, 49, 50 with less time for optimal self‐care, symptom neglect, poor perception of health, lower quality of life,46 and worse health outcomes overall. Although several other determinants of health such as level of education, race/ethnicity, and level of income may influence health outcomes, in this current study, the vulnerability of women to worse patient‐reported outcomes persisted even after taking these factors into consideration. Gender differences in cardiovascular outcomes are beyond the influence of biological and medical factors,4 as they extend to the psychosocial and patient‐centered determinants of health. Improved recognition and understanding of these gender‐specific differences and challenges among women with ASCVD will be vital to the improvement of women's cardiovascular health.
Strengths and Limitations
This study has some limitations. Since MEPS has a cross‐sectional design, we cannot establish causal mechanisms between gender and patient‐reported outcomes among individuals with ASCVD. Since there is no standardized definition for the components of patient experience, all the factors that might influence these measures may not have been accounted for. Also, since our study population includes self‐reported diagnosis of ASCVD, the risk of underestimation of the cohort size is a possibility. The timeliness of the MEPS may influence the responses of the participants, hence there is the possibility of a recall bias, although it should be minimal at best. Also, we could not address the underlying reasons for the gender‐specific differences in patient‐reported health outcomes, which could be because of treatment differences and referrals, indications and contraindications, patient preference, or other medical‐social factors that could contribute to differences in health outcomes. Finally, patient‐reported data were used to identify the gender of the MEPS participants, which was reported as either male or female; we therefore could not account for the transgender population.
On the other hand, our study has many strengths, including the design and execution of the MEPS with its multilevel ascertainment of information obtained from survey participants and weighting to make our results generalizable to all noninstitutionalized US adults living with ASCVD.
Conclusions
In conclusion, women with ASCVD were more likely to report poorer patient experience, lower HRQoL, and poorer perception of their health when compared with men. This has important public health implications, given the established relationship between positive patient experiences, HRQoL, and improved health outcomes. Continued research towards understanding the gender‐specific differences in patient‐reported matrices may provide an opportunity to improve perception of healthcare quality, delivery, and ultimately health outcomes among women with ASCVD.
Sources of Funding
Dr Michos is supported by the Blumenthal Scholars Fund for Preventive Cardiology Research.
Disclosures
None.
Supporting information
Table S1. Patient–Provider Communication Score Questions and Patient Satisfaction Questions
Table S2. ICD‐9‐CM Codes of Diseases and Self‐Report Information
Table S3. Patient‐Reported Outcomes Among US Adults With ASCVD Stratified by Gender—MEPS 2006–2015 (Odds Ratios Includes Adjustment for Type of Provider and Gender of Provider)
Figure S1. A through D, Gender differences in poor patient–provider communication among US adults with ASCVD, stratified by sociodemographic characteristics. ASCVD indicates atherosclerotic cardiovascular disease.
Figure S2. A through D, Gender differences in poor patient satisfaction among US adults with ASCVD, stratified by sociodemographic characteristics. ASCVD indicates atherosclerotic cardiovascular disease.
Figure S3. A through D, Gender differences in poor perception of health status among US adults with ASCVD, stratified by sociodemographic characteristics. ASCVD indicates atherosclerotic cardiovascular disease.
Figure S4. A through D, Gender differences in poor physical component score among US adults with ASCVD, stratified by sociodemographic characteristics. ASCVD indicates atherosclerotic cardiovascular disease.
Figure S5. A through D, Gender differences in poor mental component score among US adults with ASCVD, stratified by sociodemographic characteristics. ASCVD indicates atherosclerotic cardiovascular disease.
(J Am Heart Assoc. 2018;7:e010498 DOI: 10.1161/JAHA.118.010498)
An abstract of this work was presented at the American Heart Association Scientific Sessions, November 10 to 12, 2018, in Chicago, IL.
References
- 1. Benjamin EJ, Virani SS, Callaway CW, Chamberlain AM, Chang AR, Cheng S, Chiuve SE, Cushman M, Delling FN, Deo R, de Ferranti SD, Ferguson JF, Fornage M, Gillespie C, Isasi CR, Jimenez MC, Jordan LC, Judd SE, Lackland D, Lichtman JH, Lisabeth L, Liu S, Longenecker CT, Lutsey PL, Mackey JS, Matchar DB, Matsushita K, Mussolino ME, Nasir K, O'Flaherty M, Palaniappan LP, Pandey A, Pandey DK, Reeves MJ, Ritchey MD, Rodriguez CJ, Roth GA, Rosamond WD, Sampson UKA, Satou GM, Shah SH, Spartano NL, Tirschwell DL, Tsao CW, Voeks JH, Willey JZ, Wilkins JT, Wu JH, Alger HM, Wong SS, Muntner P; American Heart Association Council on Epidemiology and Prevention Statistics Committee and Stroke Statistics Subcommittee . Heart disease and stroke statistics—2018 update: a report from the American Heart Association. Circulation. 2018;137:e67–e492. [DOI] [PubMed] [Google Scholar]
- 2. Joseph P, Leong D, McKee M, Anand SS, Schwalm JD, Teo K, Mente A, Yusuf S. Reducing the global burden of cardiovascular disease, part 1: the epidemiology and risk factors. Circ Res. 2017;121:677–694. [DOI] [PubMed] [Google Scholar]
- 3. Okunrintemi V, Spatz ES, Di Capua P, Salami JA, Valero‐Elizondo J, Warraich H, Virani SS, Blaha MJ, Blankstein R, Butt AA, Borden WB, Dharmarajan K, Ting H, Krumholz HM, Nasir K. Patient‐provider communication and health outcomes among individuals with atherosclerotic cardiovascular disease in the United States: Medical Expenditure Panel Survey 2010 to 2013. Circ Cardiovasc Qual Outcomes. 2017;10:e003635. [DOI] [PubMed] [Google Scholar]
- 4. Aggarwal NR, Patel HN, Mehta LS, Sanghani RM, Lundberg GP, Lewis SJ, Mendelson MA, Wood MJ, Volgman AS, Mieres JH. Sex differences in ischemic heart disease: advances, obstacles, and next steps. Circ Cardiovasc Qual Outcomes. 2018;11:e004437. [DOI] [PubMed] [Google Scholar]
- 5. AlBadri A, Wei J, Mehta PK, Shah R, Herscovici R, Gulati M, Shufelt C, Bairey Merz N. Sex differences in coronary heart disease risk factors: rename it ischaemic heart disease! Heart. 2017;103:1567–1568. [DOI] [PMC free article] [PubMed] [Google Scholar]
- 6. Bairey Merz CN, Shaw LJ, Reis SE, Bittner V, Kelsey SF, Olson M, Johnson BD, Pepine CJ, Mankad S, Sharaf BL, Rogers WJ, Pohost GM, Lerman A, Quyyumi AA, Sopko G; WISE Investigators . Insights from the NHLBI‐Sponsored Women's Ischemia Syndrome Evaluation (WISE) Study: part II: gender differences in presentation, diagnosis, and outcome with regard to gender‐based pathophysiology of atherosclerosis and macrovascular and microvascular coronary disease. J Am Coll Cardiol. 2006;47:S21–S29. [DOI] [PubMed] [Google Scholar]
- 7. Shaw LJ, Bugiardini R, Merz CN. Women and ischemic heart disease: evolving knowledge. J Am Coll Cardiol. 2009;54:1561–1575. [DOI] [PMC free article] [PubMed] [Google Scholar]
- 8. D'Onofrio G, Safdar B, Lichtman JH, Strait KM, Dreyer RP, Geda M, Spertus JA, Krumholz HM. Sex differences in reperfusion in young patients with ST‐segment‐elevation myocardial infarction: results from the VIRGO study. Circulation. 2015;131:1324–1332. [DOI] [PMC free article] [PubMed] [Google Scholar]
- 9. Daly C, Clemens F, Lopez Sendon JL, Tavazzi L, Boersma E, Danchin N, Delahaye F, Gitt A, Julian D, Mulcahy D, Ruzyllo W, Thygesen K, Verheugt F, Fox KM; Euro Heart Survey Investigators . Gender differences in the management and clinical outcome of stable angina. Circulation. 2006;113:490–498. [DOI] [PubMed] [Google Scholar]
- 10. Colella TJ, Gravely S, Marzolini S, Grace SL, Francis JA, Oh P, Scott LB. Sex bias in referral of women to outpatient cardiac rehabilitation? A meta‐analysis. Eur J Prev Cardiol. 2015;22:423–441. [DOI] [PubMed] [Google Scholar]
- 11. Samayoa L, Grace SL, Gravely S, Scott LB, Marzolini S, Colella TJ. Sex differences in cardiac rehabilitation enrollment: a meta‐analysis. Can J Cardiol. 2014;30:793–800. [DOI] [PubMed] [Google Scholar]
- 12. Supervía M, Medina‐Inojosa JR, Yeung C, Lopez‐Jimenez F, Squires RW, Pérez‐Terzic CM, Brewer LC, Leth SE, Thomas RJ. Cardiac Rehabilitation for Women: A Systematic Review of Barriers and Solutions. Mayo Clinic proceedings. 2017;17:S0025–6196. [DOI] [PMC free article] [PubMed] [Google Scholar]
- 13. Zhao M, Vaartjes I, Graham I, Grobbee D, Spiering W, Klipstein‐Grobusch K, Woodward M, Peters SA. Sex differences in risk factor management of coronary heart disease across three regions. Heart. 2017;103:1587–1594. [DOI] [PMC free article] [PubMed] [Google Scholar]
- 14. Blomkalns AL, Chen AY, Hochman JS, Peterson ED, Trynosky K, Diercks DB, Brogan GX Jr, Boden WE, Roe MT, Ohman EM, Gibler WB, Newby LK; CRUSADE Investigators . Gender disparities in the diagnosis and treatment of non‐ST‐segment elevation acute coronary syndromes: large‐scale observations from the CRUSADE (Can Rapid Risk Stratification of Unstable Angina Patients Suppress Adverse Outcomes With Early Implementation of the American College of Cardiology/American Heart Association Guidelines) National Quality Improvement Initiative. J Am Coll Cardiol. 2005;45:832–837. [DOI] [PubMed] [Google Scholar]
- 15. McKibben RA, Al Rifai M, Mathews LM, Michos ED. Primary prevention of atherosclerotic cardiovascular disease in women. Curr Cardiovasc Risk Rep. 2016;10:1. [DOI] [PMC free article] [PubMed] [Google Scholar]
- 16. Rosen SE, Henry S, Bond R, Pearte C, Mieres JH. Sex‐specific disparities in risk factors for coronary heart disease. Curr Atheroscler Rep. 2015;17:49. [DOI] [PubMed] [Google Scholar]
- 17. Gulati M. Improving the cardiovascular health of women in the nation: moving beyond the bikini boundaries. Circulation. 2017;135:495–498. [DOI] [PubMed] [Google Scholar]
- 18. Hardee JT, Kasper IK. A clinical communication strategy to enhance effectiveness and CAHPS scores: the ALERT model. Perm J. 2008;12:70–74. [DOI] [PMC free article] [PubMed] [Google Scholar]
- 19. Bertakis KD, Franks P, Epstein RM. Patient‐centered communication in primary care: physician and patient gender and gender concordance. J Womens Health. 2009;18:539–545. [DOI] [PubMed] [Google Scholar]
- 20. Weiss GL. Patient satisfaction with primary medical care. Evaluation of sociodemographic and predispositional factors. Med Care. 1988;26:383–392. [DOI] [PubMed] [Google Scholar]
- 21. Woods SE, Heidari Z. The influence of gender on patient satisfaction. J Gend Specif Med. 2003;6:30–35. [PubMed] [Google Scholar]
- 22. Kaplan SH. Satisfaction surveys: does the information make a difference? Clin Perform Qual Health Care. 1996;4:216–217. [PubMed] [Google Scholar]
- 23. Teunissen TAM, Rotink ME, Lagro‐Janssen ALM. Gender differences in quality of care experiences during hospital stay: a contribution to patient‐centered healthcare for both men and women. Patient Educ Couns. 2016;99:631–637. [DOI] [PubMed] [Google Scholar]
- 24. DeVoe JE, Wallace LS, Fryer GE Jr. Measuring patients’ perceptions of communication with healthcare providers: do differences in demographic and socioeconomic characteristics matter? Health Expect. 2009;12:70–80. [DOI] [PMC free article] [PubMed] [Google Scholar]
- 25. Shabat S, Folman Y, Arinzon Z, Adunsky A, Catz A, Gepstein R. Gender differences as an influence on patients’ satisfaction rates in spinal surgery of elderly patients. Eur Spine J. 2005;14:1027–1032. [DOI] [PubMed] [Google Scholar]
- 26. Thomas T, Robinson C, Champion D, McKell M, Pell M. Prediction and assessment of the severity of post‐operative pain and of satisfaction with management. Pain. 1998;75:177–185. [DOI] [PubMed] [Google Scholar]
- 27. Baker PN, van der Meulen JH, Lewsey J, Gregg PJ; National Joint Registry for England and Wales . The role of pain and function in determining patient satisfaction after total knee replacement. Data from the National Joint Registry for England and Wales. J Bone Joint Surg Br. 2007;89:893–900. [DOI] [PubMed] [Google Scholar]
- 28. Gehrchen PM, Dahl B, Katonis P, Blyme P, Tondevold E, Kiaer T. No difference in clinical outcome after posterolateral lumbar fusion between patients with isthmic spondylolisthesis and those with degenerative disc disease using pedicle screw instrumentation: a comparative study of 112 patients with 4 years of follow‐up. Eur Spine J. 2002;11:423–427. [DOI] [PMC free article] [PubMed] [Google Scholar]
- 29. Lenz ER, Mundinger MO, Kane RL, Hopkins SC, Lin SX. Primary care outcomes in patients treated by nurse practitioners or physicians: two‐year follow‐up. Med Care Res Rev. 2004;61:332–351. [DOI] [PubMed] [Google Scholar]
- 30. Mundinger MO, Kane RL, Lenz ER, Totten AM, Tsai WY, Cleary PD, Friedewald WT, Siu AL, Shelanski ML. Primary care outcomes in patients treated by nurse practitioners or physicians: a randomized trial. JAMA. 2000;283:59–68. [DOI] [PubMed] [Google Scholar]
- 31. Bertakis KD, Azari R. Patient‐centered care: the influence of patient and resident physician gender and gender concordance in primary care. J Womens Health. 2012;21:326–333. [DOI] [PMC free article] [PubMed] [Google Scholar]
- 32. Derose KP, Hays RD, McCaffrey DF, Baker DW. Does physician gender affect satisfaction of men and women visiting the emergency department? J Gen Intern Med. 2001;16:218–226. [DOI] [PMC free article] [PubMed] [Google Scholar]
- 33. Roter DL, Hall JA. Physician gender and patient‐centered communication: a critical review of empirical research. Annu Rev Public Health. 2004;25:497–519. [DOI] [PubMed] [Google Scholar]
- 34. Greenwood BN, Carnahan S, Huang L. Patient‐physician gender concordance and increased mortality among female heart attack patients. Proc Natl Acad Sci USA. 2018;115:8569–8574. [DOI] [PMC free article] [PubMed] [Google Scholar]
- 35. Tsugawa Y, Jena AB, Figueroa JF, Orav EJ, Blumenthal DM, Jha AK. Comparison of hospital mortality and readmission rates for Medicare patients treated by male vs female physicians. JAMA Intern Med. 2017;177:206–213. [DOI] [PMC free article] [PubMed] [Google Scholar]
- 36. Beer TM, Miller K, Tombal B, Cella D, Phung Holmstrom S, Ivanescu C, Skaltsa K, Naidoo S. The association between health‐related quality‐of‐life scores and clinical outcomes in metastatic castration‐resistant prostate cancer patients: exploratory analyses of AFFIRM and PREVAIL studies. Eur J Cancer. 2017;87:21–29. [DOI] [PubMed] [Google Scholar]
- 37. Xie J, Wu EQ, Zheng ZJ, Sullivan PW, Zhan L, Labarthe DR. Patient‐reported health status in coronary heart disease in the United States: age, sex, racial, and ethnic differences. Circulation. 2008;118:491–497. [DOI] [PubMed] [Google Scholar]
- 38. Agewall S, Berglund M, Henareh L. Reduced quality of life after myocardial infarction in women compared with men. Clin Cardiol. 2004;27:271–274. [DOI] [PMC free article] [PubMed] [Google Scholar]
- 39. Shumaker SA, Brooks MM, Schron EB, Hale C, Kellen JC, Inkster M, Wimbush FB, Wiklund I, Morris M. Gender differences in health‐related quality of life among postmyocardial infarction patients: brief report. CAST Investigators. Cardiac Arrhythmia Suppression Trials. Womens Health. 1997;3:53–60. [PubMed] [Google Scholar]
- 40. Leifheit‐Limson EC, D'Onofrio G, Daneshvar M, Geda M, Bueno H, Spertus JA, Krumholz HM, Lichtman JH. Sex differences in cardiac risk factors, perceived risk, and health care provider discussion of risk and risk modification among young patients with acute myocardial infarction: the VIRGO study. J Am Coll Cardiol. 2015;66:1949–1957. [DOI] [PMC free article] [PubMed] [Google Scholar]
- 41. Gijsberts CM, Agostoni P, Hoefer IE, Asselbergs FW, Pasterkamp G, Nathoe H, Appelman YE, de Kleijn DP, den Ruijter HM. Gender differences in health‐related quality of life in patients undergoing coronary angiography. Open Heart. 2015;2:e000231. [DOI] [PMC free article] [PubMed] [Google Scholar]
- 42. Angraal S, Khera R, Wang Y, Lu Y, Jean R, Dreyer RP, Geirsson A, Desai NR, Krumholz HM. Sex and race differences in the utilization and outcomes of coronary artery bypass grafting among Medicare beneficiaries, 1999–2014. J Am Heart Assoc. 2018;7:e009014 DOI: 10.1161/JAHA.118.009014. [DOI] [PMC free article] [PubMed] [Google Scholar]
- 43. Liakos M, Parikh PB. Gender disparities in presentation, management, and outcomes of acute myocardial infarction. Curr Cardiol Rep. 2018;20:64. [DOI] [PubMed] [Google Scholar]
- 44. Khan E, Brieger D, Amerena J, Atherton JJ, Chew DP, Farshid A, Ilton M, Juergens CP, Kangaharan N, Rajaratnam R, Sweeny A, Walters DL, Chow CK. Differences in management and outcomes for men and women with ST‐elevation myocardial infarction. Med J Aust. 2018;209:118–123. [DOI] [PubMed] [Google Scholar]
- 45. Pharr JR, Dodge Francis C, Terry C, Clark MC. Culture, caregiving, and health: exploring the influence of culture on family caregiver experiences. ISRN Public Health. 2014;2014:8. [Google Scholar]
- 46. Humphries KH, Izadnegahdar M, Sedlak T, Saw J, Johnston N, Schenck‐Gustafsson K, Shah RU, Regitz‐Zagrosek V, Grewal J, Vaccarino V, Wei J, Bairey Merz CN. Sex differences in cardiovascular disease—impact on care and outcomes. Front Neuroendocrinol. 2017;46:46–70. [DOI] [PMC free article] [PubMed] [Google Scholar]
- 47. Mathews L, Ogunmoroti O, Nasir K, Blumenthal RS, Utuama OA, Rouseff M, Das S, Veledar E, Feldman T, Agatston A, Zhao D, Michos ED. Psychological factors and their association with ideal cardiovascular health among women and men. J Womens Health. 2018;27:709–715. [DOI] [PMC free article] [PubMed] [Google Scholar]
- 48. Dreyer RP, Dharmarajan K, Kennedy KF, Jones PG, Vaccarino V, Murugiah K, Nuti SV, Smolderen KG, Buchanan DM, Spertus JA, Krumholz HM. Sex differences in 1‐year all‐cause rehospitalization in patients after acute myocardial infarction: a prospective observational study. Circulation. 2017;135:521–531. [DOI] [PMC free article] [PubMed] [Google Scholar]
- 49. Vaccarino V, Wilmot K, Al Mheid I, Ramadan R, Pimple P, Shah AJ, Garcia EV, Nye J, Ward L, Hammadah M, Kutner M, Long Q, Bremner JD, Esteves F, Raggi P, Quyyumi AA. Sex differences in mental stress‐induced myocardial ischemia in patients with coronary heart disease. J Am Heart Assoc. 2016;5:e003630 DOI: 10.1161/JAHA.116.003630. [DOI] [PMC free article] [PubMed] [Google Scholar]
- 50. Vaccarino V, Sullivan S, Hammadah M, Wilmot K, Al Mheid I, Ramadan R, Elon L, Pimple PM, Garcia EV, Nye J, Shah AJ, Alkhoder A, Levantsevych O, Gay H, Obideen M, Huang M, Lewis TT, Bremner JD, Quyyumi AA, Raggi P. Mental stress‐induced‐myocardial ischemia in young patients with recent myocardial infarction: sex differences and mechanisms. Circulation. 2018;137:794–805. [DOI] [PMC free article] [PubMed] [Google Scholar]
Associated Data
This section collects any data citations, data availability statements, or supplementary materials included in this article.
Supplementary Materials
Table S1. Patient–Provider Communication Score Questions and Patient Satisfaction Questions
Table S2. ICD‐9‐CM Codes of Diseases and Self‐Report Information
Table S3. Patient‐Reported Outcomes Among US Adults With ASCVD Stratified by Gender—MEPS 2006–2015 (Odds Ratios Includes Adjustment for Type of Provider and Gender of Provider)
Figure S1. A through D, Gender differences in poor patient–provider communication among US adults with ASCVD, stratified by sociodemographic characteristics. ASCVD indicates atherosclerotic cardiovascular disease.
Figure S2. A through D, Gender differences in poor patient satisfaction among US adults with ASCVD, stratified by sociodemographic characteristics. ASCVD indicates atherosclerotic cardiovascular disease.
Figure S3. A through D, Gender differences in poor perception of health status among US adults with ASCVD, stratified by sociodemographic characteristics. ASCVD indicates atherosclerotic cardiovascular disease.
Figure S4. A through D, Gender differences in poor physical component score among US adults with ASCVD, stratified by sociodemographic characteristics. ASCVD indicates atherosclerotic cardiovascular disease.
Figure S5. A through D, Gender differences in poor mental component score among US adults with ASCVD, stratified by sociodemographic characteristics. ASCVD indicates atherosclerotic cardiovascular disease.
Data Availability Statement
The authors will not directly release the data and materials from this project. However, the Medical Expenditure Panel Survey (MEPS) data sets used in this project are made available from the Agency for Healthcare Research and Quality to prospective researchers and are easily replicable from the methods described in the article.