

Abstract
Background
We have demonstrated that the antihypertensive effect of the angiotensin‐converting enzyme inhibitor, captopril (CAP), is associated with beneficial effects on gut pathology. Coupled with the evidence that CAP exerts prolonged reduction in blood pressure (BP) after discontinuation of treatment, we investigate whether persistent beneficial actions of CAP are linked to alterations of gut microbiota and improvement of hypertension‐induced gut pathology.
Methods and Results
Spontaneously hypertensive rats (SHR) and Wistar Kyoto rats were treated with CAP (250 mg/kg/day) for 4 weeks followed by withdrawal for 16 weeks. Gut microbiota, gut pathology, BP, and brain neuronal activity were assessed. CAP resulted in a ≈60 mm Hg decrease in systolic BP after 3 weeks of treatment in SHR, and the decrease remained significant at least 5 weeks after CAP withdrawal. In contrast, CAP caused modest decrease in systolic BP in Wistar Kyoto. 16S rRNA gene‐sequencing–based gut microbial analyses in SHR showed sustained alteration of gut microbiota and increase in Allobaculum after CAP withdrawal. Phylogenetic investigation of communities by reconstruction of unobserved states analysis revealed significant increase in bacterial sporulation upon CAP treatment in SHR. These were associated with persistent improvement in gut pathology and permeability. Furthermore, manganese‐enhanced magnetic resonance imaging showed significantly decreased neuronal activity in the posterior pituitary of SHR 4 weeks after withdrawal.
Conclusions
Decreased BP, altered gut microbiota, improved gut pathology and permeability, and dampened posterior pituitary neuronal activity were maintained after CAP withdrawal in the SHR. They suggest that CAP influences the brain‐gut axis to maintain the sustained antihypertensive effect of CAP after withdrawal.
Keywords: angiotensin‐converting enzyme inhibitor, antihypertensive agent, blood pressure, brain imaging, brain‐gut axis, gut microbiota, hypertension
Subject Categories: Hypertension, Cardiovascular Disease, Treatment
Clinical Perspective
What Is New?
This study presents a novel observation demonstrating that antihypertensive effect of the angiotensin‐converting enzyme inhibitor, captopril, have sustained influence on the brain‐gut axis even after the withdrawal of captopril.
What Are the Clinical Implications?
Our study suggests that the antihypertensive drug, captopril, may persistently lower blood pressure through its sustained impacts on a unique microbial population/pattern.
A novel concept that antihypertensive drug efficacy is modulated by its interaction with gut microbiota may be novel for therapeutic consideration.
Introduction
Captopril (CAP), an angiotensin‐converting enzyme inhibitor (ACEi), lowers blood pressure (BP) through its suppressive effect on the renin‐angiotensin system at both peripheral and central sites1, 2 Although the half‐life of CAP in vivo is ≈2 hours3, significant, long‐lasting effects on BP have been observed in both human hypertensive subjects4, 5 and rodent models6, 7 Subsequent studies have demonstrated persistent improvements of endothelial cell function and the cardiovascular system after CAP withdrawal8, 9 Early CAP treatment of spontaneously hypertensive rats (SHR) from in utero through 1 to 2 months of age leads to sustained reduction in BP until at least 12 months of age, and this beneficial effect on BP has been associated with protection against cardiovascular remodeling9, 10 and improvement of endothelial function.8 However, the mechanism of this long‐term protection remains elusive.
Recently, gut microbiota has become a key player in a variety of diseases, and its alteration has been linked to hypertension.11, 12, 13, 14 Fecal microbiota transplantation from hypertensive donors to normotensive recipients leads to increase in BP12, 15 and angiotensin II–induced hypertension is dependent upon the presence of gut microbiota.16 These findings indicate both causative and contributory effects of gut microbiota in hypertension. In addition to alterations in intestinal microbes, hypertension‐linked gut pathophysiology has also been demonstrated17 Moreover, CAP‐mediated reduction of BP in hypertension animal models was accompanied by improvement of gut pathology.17 Therefore, the impacts of CAP on gut microbiota, a novel BP regulator, are of interest to investigate.
Neurogenic components play a critical role in the onset and progression of hypertension.18, 19 The impact of neural inflammation, activation of central renin‐angiotensin system, and their interactions and synergism have been demonstrated to elicit an increase in BP20, 21 In addition, neuronal activity in central cardioregulatory regions is also highly involved in the pathogenesis of hypertension. Shonis et al demonstrated that neuronal activity in the posterior hypothalamus was higher in the SHR than Wistar Kyoto (WKY), attributed to both a higher spontaneous firing rate and more neurons with a bursting discharge pattern.22 Bardgett et al found that increased neuronal activity in the paraventricular nucleus (PVN) supported established hypertension in the angiotensin II/salt model23 Furthermore, a single bolus intraperitoneal injection of Ang II at the dose of 36 μg/kg resulted in prolonged neuronal activation in the subfornical organ (SFO), PVN, and rostral ventrolateral medulla, all of which may sensitize the autonomic nervous system.24
In the current study, given the evidence of regulation of BP by the brain‐gut axis18 and the beneficial effects of CAP on gut17 and brain1, 2 we investigated the effects of short‐term oral CAP on long‐term alterations of brain‐gut communication. This was examined by studying maintained shifts in gut microbiota and improvement of gut pathology as well as persistent impacts on central neuronal activity in the SHR postwithdrawal of CAP, all of which may alter brain‐gut communication.
Materials and Methods
The authors declare that all supporting data are available within the article and its online supplementary files.
Animals
Experimental procedures used in this study were approved by the University of Florida Institutional Animal Care and Use Committee and were conducted in accord with the NIH Guide for the Care and Use of Laboratory Animals. Male rats were purchased from Charles River Laboratories (Wilmington, MA) and housed in the animal facility under specific pathogen‐free conditions with a 12:12‐hour light‐dark cycle and controlled temperature at the University of Florida (Gainesville, FL). Rats (2 rats/cage) were housed in positive pressure‐ventilated racks, supplied with autoclaved corn‐cob bedding (Lab Supply, Fort Worth, TX) and cages, ad libitum irradiated diets (#7912; Envigo, Indianapolis, IN), and sterile water or CAP‐containing water. The rats were housed for two weeks in the facility prior to the outlined experiments.
Ten‐week‐old male WKY and SHR were used in the current study (N=4–10/group). The time point before initiation of captopril treatment was marked as week 0. CAP group (WKY and SHR) rats received CAP (250 mg/kg/day) from week 0 to week 4. After week 4, all rats were maintained on sterile water until the end of the study. Different sets of rats were used to avoid potential intraexperimental impacts of different treatments. BP, gut pathology, gut permeability, and fecal microbiota analysis were obtained from 1 set of rats, whereas manganese enhanced magnetic resonance imaging (MEMRI) was obtained from another set of experiments.
BP Measurement
Rat systolic BP was measured by tail cuff on a BP‐2000 series II (Visitech Systems, Apex, NC) with plate temperature set at 35°C on weeks 3 (CAP on), 5 (CAP off), and 8 (CAP off).
16S rRNA Gene Sequencing
Fecal samples were collected at week 0 (CAP on), week 4 (CAP on) and week 8 (CAP off). The preparation of 16S library for MiSeq sequencing (Illumina, San Diego, CA) was conducted as previously described11. Briefly, fecal DNA was extracted by using quick‐DNA fecal/soil microbe kit (Zymoresearch, Irvine, CA). V4 to V5 variable region was amplified in each fecal sample using a pair of primers containing Illumina standard adaptors and unique barcode combination. Amplicons were purified by a QIAquick gel extraction kit (QIAGEN, Hilden, Germany) and pooled for a library with an equal amount of each amplicon. The library was quantified and quality checked by Qubit (Thermo Fisher Scientific, Waltham, MA) and qPCR (Kapa Biosystems, Wilmington, MA), before Miseq sequencing with a 2 by 250 base pairs v2 kit (Illumina, San Diego, CA). Raw data and metadata files can be viewed at NCBI SRA accession PRJNA506423.
Bioinformatics Analysis
Raw paired‐reads obtained from MiSeq (Illumina) were processed by QIIME1.9.1. Reads were subjected to chimera picking and additionally trimmed to remove bases with Phred scores lower than 30. Quality‐filtering parameters were set as previously optimized25 Open reference operational taxonomic unit (OTU) picking and taxonomical assignment to the generated OTUs were performed with 97% identity against Greengenes database 13.8. Alpha diversity and unweighted principal coordinate analyses (PCoAs) plots using the phylogenic‐tree–based UniFrac distance metric were generated using scripts from the QIIME package. Bacterial interaction networks and a hierarchical clustering heatmap (Greengenes database) were generated by using Calypso26
Phylogenetic investigation of communities by reconstruction of unobserved states was performed to predict the entire metagenome of our samples. Predicted metagenomes were subsequently subjected to collapse predictions into Kyoto Encyclopedia of Genes and Genomes pathways. The obtained data are presented as relative abundance of predicted functions within the samples. Additionally, predicted functional contents across samples were subjected to linear discriminant analysis with effect‐size measurements using Galaxy differentiated significant features at each KEGG pathway level.
Manganese Enhanced Magnetic Resonance Imaging
MEMRI was performed on WKY and SHR rats at week 4 and week 8, as recently described27 Briefly, MnCl2 (Sigma‐Aldrich, St. Louis, MO) was dissolved in sterile filtered ddH2O before use. Twenty‐four hours before imaging, intraperitoneal injection to all rats was performed at the dose of 70 mg/kg as previously optimized to trace brain activity in rodents28 On the day of testing, rats were initially anesthetized under 3% to 4% isoflurane delivered in 100% medical grade oxygen for 30 to 60 seconds (flow rate 1 L/min), and 1.5% to 2% of isoflurane was then maintained throughout the entire setup and imaging. Rats were placed on a plastic cradle with a respiratory pillow connected to a force transducer placed underneath the abdomen. Body temperatures were maintained using a warm‐air recirculation system that received feedback from a fiber optic thermocouple probe (SA Instruments, Inc, Stony Brook, NY). Respiratory rates were between 50 and 70 breaths per minute during the experiment. Images were collected on a 4.7 Tesla Magnex Scientific MR scanner controlled by Agilent Technologies VnmrJ 3.1 console software (Agilent Technologies, Santa Clara, CA). A 38‐mm quadrature transmit/receive radiofrequency coil tuned to 200.6 MHz was used (airmri, LLC, Holden, MA). Images were acquired using a T1‐weighted multislice, multiecho sequence with the following parameters: repetition time = 460 ms, echo time = 16 ms, data matrix 256 × 256, field of view 30 × 30 mm, and 20 slices at 1.2 mm thickness. Slices were in axial view (coronal in the rat), with the first slice starting at the rostral‐most extension of the prefrontal/motor cortex and excluding the olfactory bulb. Scan time was 52 minutes per rat for 30 averages.
MEMRI data were processed and analyzed using previously published methods.27 Briefly, brain masks were manually drawn over T1 anatomical scans using the drawing tool in itkSNAP (http://www.itksnap.org). Masks were then used to remove nonbrain signal from each scan. The resulting cropped images were aligned with a rat brain template (Ekamsolutions, LLC, Holden, MA) using the FMRIB Software Library's automated linear registration tool flirt as previously described.27 Cropped T1 scans were converted to z‐score maps through a voxel‐wise signal‐to‐noise processing step. Global mean signal intensity (representing intensity of signal) of activation (representing the area of activation of each region) was evaluated for each region of interest.
Gut Pathology
Paraffin‐embedded small intestine sections were stained with hematoxylin‐eosin and Masson‐trichrome to evaluate general morphology and collagen formation using standard histochemical methods. Villus length, fibrosis, number of goblet cells, and thickness of tunica muscularis layer were quantified as previously described.17
ELISA Assay
Blood collected at the different time points was centrifuged at 10 000g for 10 minutes. Supernatant serum was aliquoted and stored at −80°C and assayed for intestinal fatty acid binding protein 2 (I‐FABP; R&D Systems, Minneapolis, MN) by ELISA, according to the manufacturer's instructions. Serum samples were diluted at 1:100 for I‐FABP measurement in duplicate wells. Optical density of sample was measured at optical density 450, with correction of optical imperfections obtained by optical density 540.
Statistical Analysis
Unweighted unifrac was performed to calculate the distance/dissimilarity between each pair of samples. The complete unifrac matrix was plotted in 2‐ and 3‐dimensional PCoA for visualization of the data. A greater distance between each pair of samples indicates greater dissimilarity. Analysis of similarity (ANOSIM) was performed to compare variation in the gut microbiota PCoA analysis using the QIIME script. All bar graphs in this article are presented as mean±SEM. Two‐way ANOVA (no matching), followed by Tukey's multiple comparisons, was conducted in GraphPad Prism software (version 6; GraphPad Software Inc, La Jolla, CA) in the analyses, including bacterial alpha diversity; phylum and Allobaculum, Parabacteroides, and Mucispirillum abundances; gut pathology quantification; I‐FABP plasma level; and quantified signal intensity in MEMRI. Phylogenetic investigation of communities by reconstruction of unobserved states results were analyzed using the Kruskal–Wallis sum‐rank test in linear discriminant analysis with effect‐size measurements.
Results
Persistent Alterations in Gut Microbiota Following CAP Withdrawal
It has been established that short‐term treatment of CAP exhibited persistent BP‐lowering effects9 Therefore, the first objective of our study was to confirm this observation in the current experimental setting (Figure 1A). WKY rats and SHR were supplemented with CAP in drinking water for 4 weeks, followed by its withdrawal for 16 weeks. Administration of CAP for 3 weeks resulted in an ≈60 mm Hg decrease in systolic BP in SHR (control 166.6±7.1 mm Hg versus CAP on 107.0±5.4 mm Hg; N=4; Figure S1). CAP also caused a modest decrease in systolic BP in WKY (control 115.1±2.8 mm Hg versus CAP 99.3±3.2 mm Hg; N=4). In addition, the reduction in systolic BP in SHR was maintained until at least 5 weeks after withdrawal of CAP (control 166.6±7.1 mm Hg versus CAP off 135.5 ±7.4 mm Hg; Figure S1).
Figure 1.
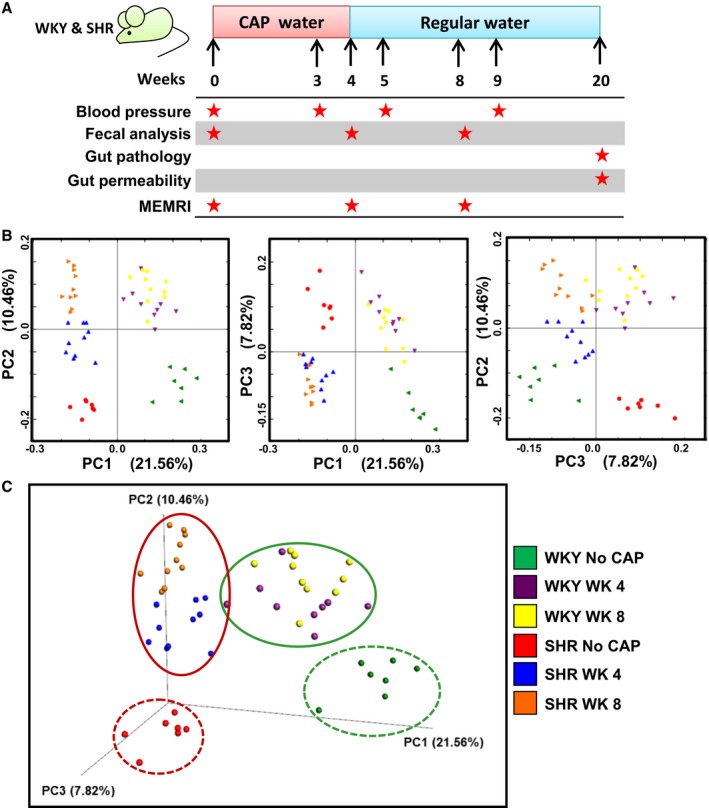
Significant differences in gut microbial compositions between CAP treatment (on and off) and no CAP treatment in WKY and SHR. A, Schematic diagram shows the experimental design of CAP treatment and withdrawal. Star indicates time of obtained data. B, 2D PCoA and (C) 3D plots of gut microbiota in WKY and SHR, grouped by no CAP, CAP on (WK4) and CAP off (WK8). P and R values obtained by ANOSIM analyses are shown in Table. ANOSIM indicates analysis of similarities; CAP, captopril; MEMRI, manganese enhanced magnetic resonance imaging; SHR, spontaneously hypertensive rat; WKY, Wistar Kyoto (rat).
We performed 16S rRNA gene sequencing to analyze gut microbial composition in these rats. Unweighted PCoA analysis of the gut microbiota is presented as 2‐dimensional (Figure 1B) and 3‐dimensional (Figure 1C). The obtained data showed significant separation of clusters between control WKY and SHR (ANOSIM, P=0.001; R=0.9922), consistent with our previously published observation11 CAP treatment resulted in shifts of gut microbiota at week 4 (CAP on) in both WKY (ANOSIM, P=0.001; R=0.6987) and SHR (ANOSIM, P=0.001; R=0.8139). Interestingly, this shift was not restored at week 8 (CAP off) in WKY (ANOSIM, P=0.001; R=0.9398 versus week 0) or SHR (P=0.001; R=0.9823 versus week 0). Furthermore, differences in gut microbiota between week 4 and week 8 were less significant than differences between no CAP and week 4 in both WKY and SHR (Table), indicating relatively stable microbiota communities after withdrawal of CAP.
Table 1.
ANOSIM Analyses of Gut Microbial Composition
| Group 1 | Group 2 | P Value | R Value |
|---|---|---|---|
| WKY No CAP | SHR No CAP | 0.001 | 0.9922 |
| WKY No CAP | WKY W4 | 0.001 | 0.6987 |
| WKY No CAP | WKY W8 | 0.001 | 0.9398 |
| WKY W4 | WKY W8 | 0.001 | 0.4793 |
| SHR No CAP | SHR W4 | 0.001 | 0.8139 |
| SHR No CAP | SHR W8 | 0.001 | 0.9823 |
| SHR W4 | SHR W8 | 0.001 | 0.6698 |
| WKY W4 | SHR W4 | 0.001 | 0.8689 |
| WKY W8 | SHR W8 | 0.001 | 0.9823 |
ANOSIM indicates analysis of similarities; CAP, captopril; SHR, spontaneously hypertensive rat; WKY, Wistar Kyoto (rat).
Alpha diversity parameters were compared among different groups, which showed interesting changes (Figure 2A). Alpha diversity scores (ie, Chao1 richness, OTUs, and Shannon diversity) in SHR at week 4 (CAP on) tended to increase compared with the no CAP SHR control, resulting in significant differences between WKY and SHR at week 4 (CAP on) in all alpha diversity scores. However, comparisons of SHR between no CAP, week 4 (CAP on), and week 8 (CAP off) showed no major differences (Figure 2A). In addition, there were significant increases in Chao1 richness, observed OTU, evenness, Shannon diversity, and Simpson diversity scores in WKY week 8 (CAP off), compared with those at week 4 (CAP on).
Figure 2.
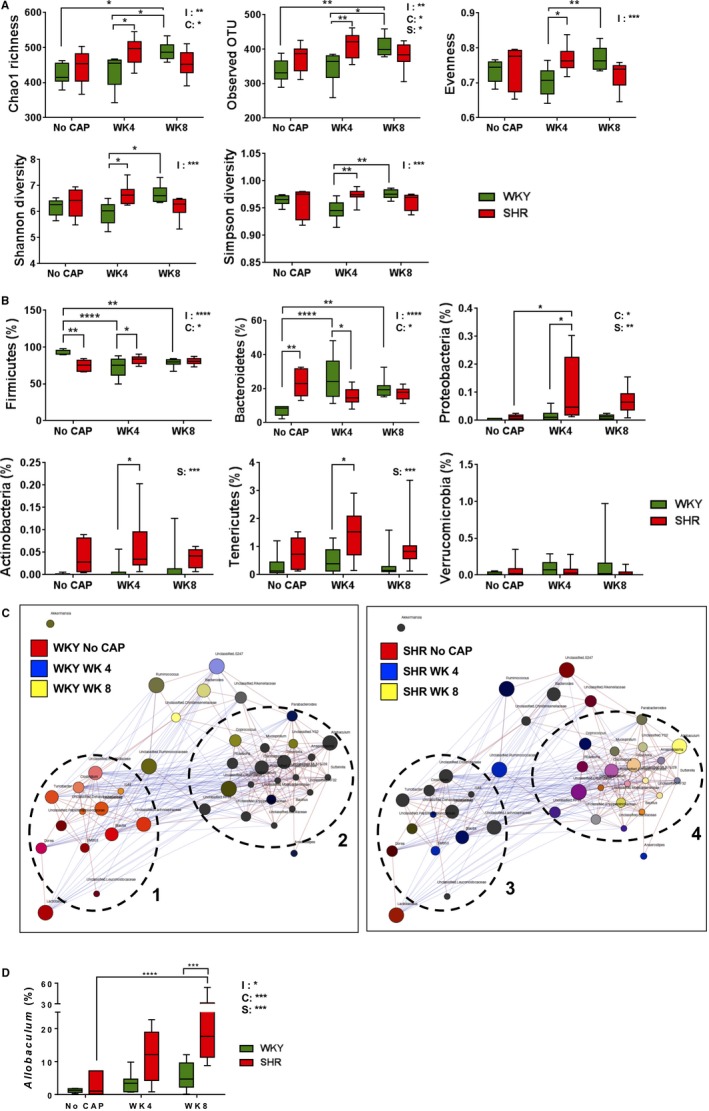
Distinct responsiveness of WKY and SHR gut microbiota to CAP. A, Changes of alpha‐diversity parameters (ie, Chao 1 richness, Observed OTU, Evenness, Shannon diversity, Simpson diversity) and (B) major phyla were different in WKY and SHR across the duration of experiments. C, Network analysis within rat strains presented with co‐occurring bacterial genera indicated by red edges and nonconcurrent by blue edges. Genera are represented as circles (nodes) colored based on the strength of their association with the selected treatment groups. Two major clusters were identified in the gut microbiota of both WKY and SHR rats, indicated by dashed circles. D, Changes in Allobaculum genus upon CAP treatment. The 2 factors and their interaction in 2‐way ANOVA are indicated as: I for interaction; C for CAP; S for rat strains. *P<0.05; **P<0.01; ***P<0.001; ****P<0.0001 in 2‐way ANOVA and its followed Tukey's multiple comparisons. CAP indicates captopril; OTU, operational taxonomic unit; SHR, spontaneously hypertensive rat; WKY, Wistar Kyoto (rat).
At the phylum level, week 4 (CAP on) SHR, compared with week 4 WKY, was characterized by significant enrichment in Firmicutes, Proteobacteria, Actinobacteria, and Tenericutes and decrease in Bacteroidetes (Figure 2B). These resulted in increased trends in the evenness in SHR at week 4 (CAP on; Figure 2A). Interestingly, differences in aforementioned phyla were not significant between WKY and SHR at week 8 (CAP off), though average values of each phylum followed the same pattern as week 4 between strains (Figure 2B). Therefore, CAP treatment increased abundance of several phyla in SHR at week 4 (CAP on), and the trend of these increases was observed at week 8 (CAP off).
To better demonstrate co‐occurrence of gut microbes and effects of CAP on these associated bacterial genera, we performed network analyses in WKY and SHR rats at the genus level. There were 2 major clusters, indicated in dashed circles, in both WKY and SHR (Figure 2C). Each cluster was composed of co‐occurring bacterial genera (nodes linked by red lines). Bacterial genera belonging to different clusters were mainly negatively correlated (nodes linked by blue lines). Nodes representing bacterial genera were colored based on the strength of their association with the selected groups (eg, black/dark brown for the presence in all 3 groups; orange for the presence in red and yellow groups). Cluster 3 contained bacterial genera mainly present at all times examined (week 0, week 4, and week 8) in SHR. Nodes in cluster 4 exhibited diverse colors. However, there were some bacterial genera (eg, Mucispirillum, Parabacteroides) in cluster 4 blooming mainly in SHR at week 4 (CAP on) and week 8 (CAP off; Figure 2C, right panel; Figure S2). Distinct from SHR, cluster 1 in WKY rats mainly contained genera (orange‐like) enriched in no CAP WKY and WKY at week 8 (CAP off) rats. In addition, bacterial genera in cluster 2 in WKY did not respond to CAP significantly (Figure 2C, left panel). Overall, our network analyses suggested that although the 2 major co‐occurring bacterial clusters responded to CAP distinctly, Mucispirillum and Parabacteroides were the 2 bacterial genera positively associated with persistently lowered BP in the SHR. Because of its high abundance at week 8 in SHR, Allobaculum was colored yellow in this analysis. However, we observed that Allobaculum was significantly associated with lowered BP in SHR, because its relative increase in abundance at week 4 (CAP on) persisted until week 8 (CAP off; Figure 2D).
Next, the top 50 most abundant OTUs were analyzed and formatted in a hierarchical clustering heatmap to demonstrate the association between gut microbial OTUs and CAP treatment. Consistent with the PCoA analysis, divergent microbial OTUs were clustered among rats based on strain and treatment group (Figure S3). SHR bacterial OTUs indicated in the dashed rectangle showed similar patterns at week 4 (CAP on) and week 8 (CAP off), both of which are different from no CAP SHR control. These bacterial OTUs (including 1 Allobaculum OTU) could potentially play a role in the maintenance of lowered BP in SHR.
Finally, phylogenetic investigation of communities by reconstruction of unobserved states analysis was performed to determine functional changes in the gut microbiota by CAP in both strains of rats. We observed significant differences in responsiveness between WKY and SHR (Figure 3). Whereas control WKY exhibited predominance of pathways linked to membrane transport, ATP‐binding cassette transporters, transcription factors, and transferase system, phosphotransferase system, etc, WKY at week 4 (CAP on) were enriched in Kyoto Encyclopedia of Genes and Genomes pathways relevant to genetic information processing, replication repair machinery, metabolism of nucleotides and proteins, sorting and degradation, etc. WKY at week 8 (CAP off) showed enriched pathways relevant to cellular processes, bacterial motility proteins, flagellar assembly, lipid metabolism, lysozyme, etc. Furthermore, increases in lipid metabolism, pathways relevant to bacterial integrity, and movement in WKY at week 8 (CAP off) rats suggest that CAP withdrawal promotes reassembly of gut bacterial integrity and motility and restores lipid metabolism (Figure 3A).
Figure 3.
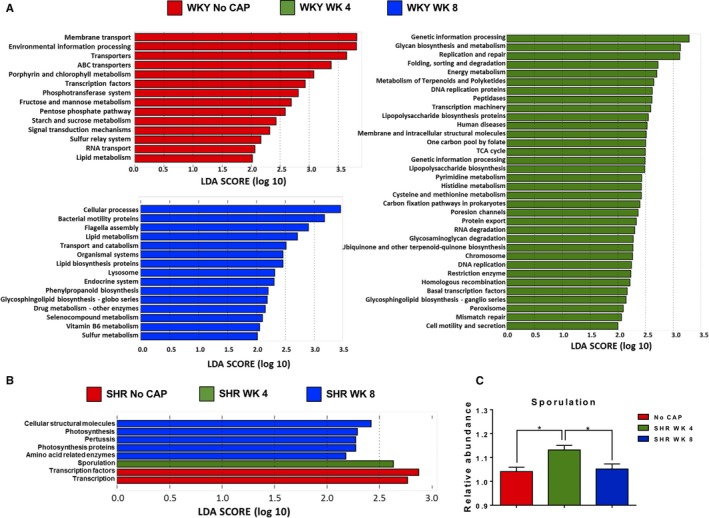
Distinct functional responsiveness of WKY and SHR gut microbiota to CAP. A, PICRUSt analysis of WKY gut microbiota, followed by LefSe analysis show the significant predicted microbial functions at indicated time points. B, PICRUSt analysis of SHR gut microbiota, followed by LefSe analysis to show the significant predicted microbial functions at indicted time points. C, The relative abundance of sporulation was significantly increased in the SHR at week 4 (CAP ON), compared with the other 2 groups. The P value of 1‐way ANOVA analysis is 0.0064. *P<0.05 in Tukey's multiple comparison. ABC indicates ATP‐binding cassette; CAP, captopril; LDA, linear discriminant analysis; LefSe, linear discriminant analysis effect size; PICRUSt, phylogenetic investigation of communities by reconstruction of unobserved states; SHR, spontaneously hypertensive rat; TCA, tricarboxylic acid; WKY, Wistar Kyoto (rat).
In contrast to dynamic, presumably protective, effects on beneficial pathways in WKY, significantly fewer CAP‐induced functional changes were observed in SHR at week 4 (CAP on) and week 8 (CAP off). Although transcription and transcription factors were dominant pathways in no CAP SHR, sporulation was the only functional change in the gut microbial communities observed in SHR at week 4 (CAP on; Figure 3B and 3C).
Sustained Improvement in Gut Pathology and Permeability Following CAP Withdrawal
We have previously demonstrated that hypertension is associated with significant gut pathology and that antihypertensive effects of CAP were accompanied by improvement of this pathology in the SHR17 In this study, we evaluated whether this improvement in gut pathology would be preserved in SHR at week 20 (CAP off) that continue to exhibit lower BP. We observed a decrease in fibrotic area (untreated, 12.98±0.81% versus week 20, 10.23±0.69%; P=0.036; Figure 4A and 4B), increase in numbers of goblet cells (untreated, 39±3.57 cells/villi versus week 20, 65±5.29 cells/villi; P=0.0006; Figure 4C and 4D), and villi length (untreated, 271.4±9.85 μm versus week 20, 388.8±12.29 μm; P<0.0001; Figure 4C and 4E) 16 weeks following CAP withdrawal. No significant effect of CAP was observed in these parameters in WKY at week 20 (CAP off; Figure 4).
Figure 4.
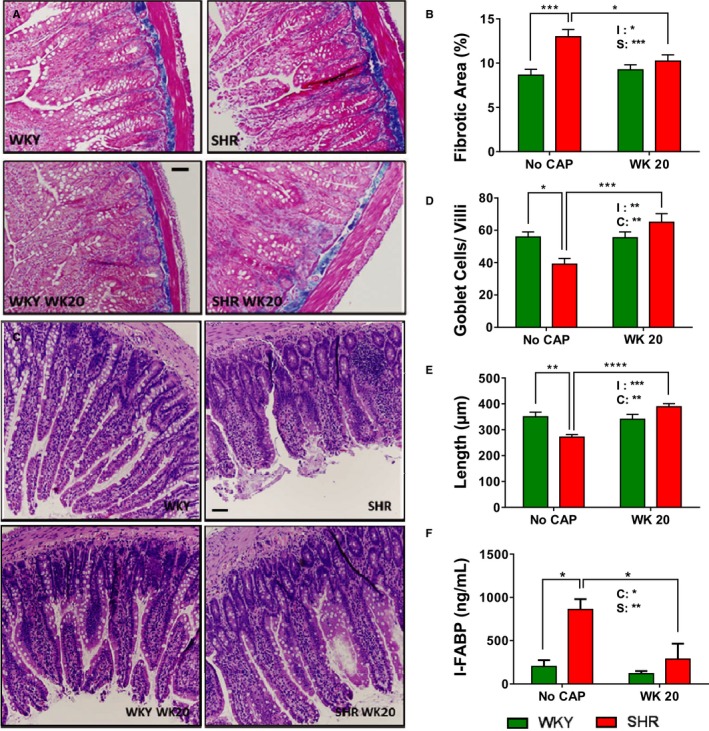
Sustained CAP‐induced improvement of gut pathology and permeability in the SHR. A, Pictures and (B) quantitative analysis of trichrome staining of ileum collected at week 20 demonstrated long‐lasting improvement of fibrosis in the SHR. C, Pictures and quantitative analysis of ileum collected at week 20 showed increased goblet cell numbers/villi (D) and villi length (E) in the SHR. F, Measurement of intestinal FABP levels in serum at week 20 indicating improved gut permeability in the SHR with CAP. The 2 factors and their interaction in 2‐way ANOVA are indicated as: I for interaction; C for CAP; S for rat strains. *P<0.05; **P<0.01; ***P<0.001; ****P<0.0001 in 2‐way ANOVA and its followed Tukey's multiple comparisons. CAP indicates captopril; FABP, fatty acid binding protein; SHR, spontaneously hypertensive rat; WKY, Wistar Kyoto (rat).
I‐FABP has been used as a marker of gut permeability,29 and we have shown increased circulating I‐FABP in human hypertension.30, 31 There was a significant attenuation of serum I‐FABP in SHR 16 weeks after CAP withdrawal, compared with untreated SHR (Figure 4F).
Neuronal Activity in Posterior Pituitary Was Decreased in CAP Off SHR
Our studies have established that neuronal activity of certain brain regions relevant to cardiovascular function is enhanced in the SHR32, 33 These and other evidence22, 34 led us to propose a dysfunctional brain‐gut axis in hypertension.35 MEMRI was performed to evaluate whether CAP treatment influences neuronal activity in the brain, especially the central cardiovascular control regions (Figure S4A). Surprisingly, the most significant change in MEMRI signal was observed in posterior pituitary (Figure 5A). Compared with control WKY, control SHR showed 52.7% increase in neuronal activity in posterior pituitary at baseline. This increase was reduced to the level comparable to WKY by 4‐week CAP treatment and maintained at week 8 (CAP off; Figure 5A). There was a different pattern in the PVN; the neuronal activity in WKY gradually increased throughout the duration of CAP treatment, but no change was found in the SHR (Figure 5B). Neuronal activity was diminished in the nucleus of solitary tract of SHR on CAP at week 4 and off CAP at week 8 (Figure 5C). Neuronal activity was induced in SFO of WKY and SHR by CAP (Figure 5D), but SHR SFO seemed to be less responsive to CAP (Figure 5D). Representative MEMRI photographs are shown in Figure S4B.
Figure 5.

Persistent changes of neuronal activity in cardiovascular‐relevant regions by CAP. Quantitative bar graphs of MEMRI signal intensity in posterior pituitary (A), PVN (B), NTS (C), and SFO (D) of the WKY and SHR at week 0 (No CAP), week 4 (CAP on), and week 8 (CAP off). The 2 factors and their interaction in 2‐way ANOVA are indicated as: I for interaction; C for CAP; S for rat strains. *P<0.05; **P<0.01; ***P<0.001 in 2‐way ANOVA and its followed Tukey's multiple comparisons. CAP indicates captopril; MEMRI, manganese enhanced magnetic resonance imaging; NTS, nucleus tractus solitarius; PVN, paraventricular nucleus of hypothalamus; SFO, subfornical organ; SHR, spontaneously hypertensive rat; WKY, Wistar Kyoto (rat).
Discussion
The most significant observation of this study is that CAP, for the first time, was demonstrated to exert significant long‐lasting influences on gut microbial composition, gut permeability and pathology, as well as brain activity in posterior pituitary, even after withdrawal of this ACEi. This was associated with a persistent decrease in high BP in SHR. All of these suggest that CAP's long‐lasting antihypertensive effects could involve rebalancing of the dysfunctional brain‐gut axis associated with hypertension.
Microbiota changes in SHR include: (1) a tendency to increased alpha diversity parameters on CAP followed by a decrease when SHRs were off CAP. Increased alpha diversity was also observed in WKY rats off CAP (Figure 3A). This indicated that CAP had long‐lasting effects on certain bacterial populations that could be termed CAP‐responsive bacteria. This population may be responsible for the gut‐microbiota–mediated elimination of CAP, given that 20% to 30% of CAP is metabolized and eliminated in the gut.36, 37 (2) Analysis of microbial genus composition identifies Parabacteroides, Mucispirillum, and Allobaculum as the CAP responders, Allobaculum being the most significant (Figure 3D). Martinez et al found that OTUs in Allobaculum taxa were negatively correlated with intestinal lipids in hamsters with diet‐induced alterations of cholesterol metabolism, indicating the inhibitory effect of cholesterol and derivatives on the Allobaculum.38 Consistent with this, Allobaculum is increased in lean and low‐fat–fed animals39, 40 that had lower intestinal lipid.41 In our study, Allobaculum was dramatically increased in SHR both on (week 4) and off CAP (week 8), consistent with the other observations that CAP lowered body weight42 Therefore, it is tempting to hypothesize that Allobaculum‐associated body weight loss may contribute to the maintenance of reduction in BP.43 (3) Increased spore formation was the dominant function enriched by CAP treatment in SHR. Therefore, sporulation may temporarily disable certain bacterial metabolic pathways protecting CAP from gastrointestinal metabolism and prolonging bioavailability of CAP in vivo. An encouraging support for this view is derived from our preliminary data showing a trend toward increased spore‐forming bacterial communities in 7 high‐BP patients on the ACEi, lisinopril, compared with high‐BP patients on other antihypertensive drugs. These views are speculative; however, it directs us to a hypothesis worthy of future investigation wherein beneficial manipulation of gut microbiota would enhance the efficiency of antihypertensive drug metabolism44 (4) WKY and SHR showed significantly distinct responsiveness to CAP. There are 2 separate clusters in the microbial interaction analysis (Figure 3D). In WKY, the bacterial genera co‐occurring in cluster 2 were enriched in all 3 groups (no CAP, CAP on, and CAP off). However, cluster 3 was filled with bacterial genera that were enriched in all 3 SHR groups (Figure 3D). All of these, along with the functional PICRUSt analysis (Figure 4) demonstrated significantly different reactions to CAP between the gut microbiota of WKY and SHR.
In addition to impact on gut microbiota, CAP withdrawal maintains beneficial effects on hypertension‐induced gut pathology and permeability. Our previous studies have shown that CAP administration significantly improves gut pathology. What is interesting here is that these improvements are preserved at week 20, even after CAP withdrawal. This suggests that the persistent improvement in gut pathology after CAP withdrawal potentially provides balanced intestinal and plasma environments beneficial to BP reduction.
Finally, CAP demonstrated persistent effects on neuronal activity that may contribute to sustained reduction in BP after CAP withdrawal. This is supported by evidence that: (1) ACEis are found to be beneficial in cognitive disorders in older hypertension patients45 and dementia patients46; (2) CAP modulates central autonomic regulation and neuroinflammation in hypertension47, 48; and (3) inhibition of neuroinflammation in autonomic brain regions attenuates overactivated sympathetic drive to the gut18, 49 and suppression of sympathetic activity to bone marrow rebalances gut microbiota.50 These suggest that dampening of neuronal activity influences the dysfunctional brain‐gut axis. Vasopressin, secreted by posterior pituitary gland, is important in BP regulation and is significantly increased in multiple hypertension models.51, 52 Vasopressin neutralization lowered BP in hypertension.51, 53 In fact, decreased plasma vasopressin has been reported by CAP treatment in SHR off CAP54 Our study compliments this observation by demonstrating a possible link between reduced vasopressin and decreased neuronal activity in the posterior pituitary gland. Interestingly, evidence for a link between gut microbiota and vasopressin has been revealed55, 56 Fields et al found inverse correlation between Lactobacillus abundance and vasopressin gene dosage in the Brattleboro rats,55 whereas we found that the Lactobacillaceae family was positively associated with posterior pituitary activity in SHR (Figure 2C). This suggests that host genetic background is also important in modulation of gut microbiota. It is also interesting to point out that PVN neuronal activity was not significantly affected by CAP in SHR. This would suggest that vasopressin regulation by CAP is at the level of posterior pituitary. However, further experiments are warranted to delineate PVN/pituitary axis regulation by CAP.
Finally, our data show that brain activity in nucleus tractus solitarius neurons is diminished by CAP, probably attributed to the inhibitory effect of CAP on the baroreflex57, 58 It has been shown that elevation of circulating vasopressin facilitates nucleus tractus solitarius processing of baroreceptor afferent inputs and contribiutes to the enhanced barorelfex59 Therefore, the interaction between the posterior pituitary gland and nucleus tractus solitarius may be involved in sustained reduction in BP. SFO activity was increased in the presence of CAP, consistent with a previous finding that subcutaneous injection of CAP induced c‐fos expression in SFO neurons.60 Our data further demonstrated that this increased activity in SFO neurons was not maintained after withdrawal of CAP, indicating the SFO neurons are not involved in the maintenance of decreased BP in SHR.
There are multiple possibilities whereby CAP might elicit changes in the brain‐gut axis. One is that CAP directly inhibits the angiotensin‐converting enzymes in the gut renin‐angiotensin system, which could further impact gut microbiota.61, 62 Alternatively, CAP may have direct effects on the structure of certain gut communities or their metabolism (ie, sporulation), which, in turn, extend CAP bioavailability. Because of to its capability of crossing the blood–brain barrier, CAP may also have direct effect on the brain57, 58, 59 Hence, the potential mechanism of CAP's long‐lasting effect on gut microbiota needs further investigation.
In summary, our observations demonstrate that long‐lasting effects of CAP, even after its withdrawal, are associated with decreased posterior pituitary neuronal activity, attenuation of gut permeability and pathology, and alterations in gut microbiota. Taken together, they suggest that CAP improves the brain‐gut axis, which may play an important role in the sustained antihypertensive effect of CAP after withdrawal. Important questions and clinical implications of our observations remain to be addressed in future studies. It is likely that recalibration of the brain‐gut axis alters the microbial community thus rebalancing host‐microbiota cross‐talk on a long‐term basis. Does CAP's effect last across generations? Experiments with rat F1 and F2 generations are underway to address this question. Currently, little is known about the hemodynamic effect of ACEi after withdrawal. However, a comparative study showed that both Aliskiren and Ramipril had significant prolonged BP‐lowering effects after withdrawal, with Aliskiren being more effective.63 Similar studies are warranted to validate the translational implications of the use of ACEi and their long‐term impacts on gut microbiota.
Sources of Funding
This work was supported by NIH grants R01 HL132448 and HL033610.
Disclosures
None.
Supporting information
Figure S1. CAP persistently decreased systolic BP in the SHR. Systolic BP was obtained by tail‐cuff across the duration of experiment. Significant reduction in systolic BP by CAP treatment (WK3) was maintained after withdrawal of CAP (WK5 and WK9). The 2 factors and their interaction in 2‐way ANOVA are indicated as: I for interaction; C for CAP; S for rat strains. **P<0.01; ***P<0.001; ****P<0.0001 in 2‐way ANOVA and its followed Tukey's multiple comparisons. BP indicates blood pressure; CAP, captopril; SHR, spontaneously hypertensive rat; WKY, Wistar Kyoto (rat).
Figure S2. Relative abundances of Parabacteroides and Mucispirillum. The factor C is for CAP. *P<0.05 in 2‐way ANOVA. CAP indicates captopril.
Figure S3. Hierarchical clustering heatmap was generated based on the correlation between top 50 gut microbiota OTUs and environmental factors (no CAP, CAP on and off). The hierarchical clustering is a multivariate analysis classifying groups of samples based on “most‐like” pairing, followed by subsequent linking of “second most‐like” samples until all samples are linked according to their similarities. Dashed line marks the bacterial OTUs that persistently responded to CAP. CAP indicates captopril; OTU, operational taxonomic unit.
Figure S4. A, Map of investigated brain regions as per Paxinos–Watson. B, Representative photographs of neuronal activity changes, determined by manganese‐enhanced signal in multiple cardiovascular regulatory regions in the WKY and SHR at week 0 (No CAP), week 4 (CAP on), and week 8 (CAP off). CAP indicates captopril; SHR, spontaneously hypertensive rat; WKY, Wistar Kyoto (rat).
(J Am Heart Assoc. 2019;8:e010721 DOI: 10.1161/JAHA.118.010721.)
References
- 1. Evered MD, Robinson MM, Richardson MA. Captopril given intracerebroventricularly, subcutaneously or by gavage inhibits angiotensin‐converting enzyme activity in the rat brain. Eur J Pharmacol. 1980;68:443–449. [DOI] [PubMed] [Google Scholar]
- 2. Schelling P, Felix D. Influence of captopril treatment on angiotensin II receptors and angiotensinogen in the brain of spontaneously hypertensive rats. Hypertension. 1983;5:935–942. [DOI] [PubMed] [Google Scholar]
- 3. Duchin KL, Singhvi SM, Willard DA, Migdalof BH, McKinstry DN. Captopril kinetics. Clin Pharmacol Ther. 1982;31:452–458. [DOI] [PubMed] [Google Scholar]
- 4. Takata Y, Yoshizumi T, Ito Y, Ueno M, Tsukashima A, Iwase M, Kobayashi K, Fujishima M. Comparison of withdrawing antihypertensive therapy between diuretics and angiotensin converting enzyme inhibitors in essential hypertensives. Am Heart J. 1992;124:1574–1580. [DOI] [PubMed] [Google Scholar]
- 5. Vaur L, Bobrie G, Dutrey‐Dupagne C, Dubroca I, Vaisse B, d'Yvoire MB, Elkik F, Chatellier G, Menard J. Short‐term effects of withdrawing angiotensin converting enzyme inhibitor therapy on home self‐measured blood pressure in hypertensive patients. Am J Hypertens. 1998;11:165–173. [DOI] [PubMed] [Google Scholar]
- 6. Wu JN, Berecek KH. Prevention of genetic hypertension by early treatment of spontaneously hypertensive rats with the angiotensin converting enzyme inhibitor captopril. Hypertension. 1993;22:139–146. [DOI] [PubMed] [Google Scholar]
- 7. Kost CK, Li P, Jackson EK. Blood pressure after captopril withdrawal from spontaneously hypertensive rats. Hypertension. 1995;25:82–87. [DOI] [PubMed] [Google Scholar]
- 8. Keaton AK, White CR, Berecek KH. Captopril treatment and its withdrawal prevents impairment of endothelium‐dependent responses in the spontaneously hypertensive rat. Clin Exp Hypertens. 1998;20:847–866. [DOI] [PubMed] [Google Scholar]
- 9. Berecek KH, Reaves P, Raizada M. Effects of early perturbation of the renin‐angiotensin system on cardiovascular remodeling in spontaneously hypertensive rats. Vascul Pharmacol. 2005;42:93–98. [DOI] [PubMed] [Google Scholar]
- 10. Regan CP, Bishop SP, Berecek KH. Early, short‐term treatment with captopril permanently attenuates cardiovascular changes in spontaneously hypertensive rats. Clin Exp Hypertens. 1997;19:1161–1177. [DOI] [PubMed] [Google Scholar]
- 11. Yang T, Santisteban MM, Rodriguez V, Li E, Carvajal JM, Zadeh M, Gong M, Qi Y, Zubcevic J, Sahay B, Pepine CJ, Raizada MK, Mohamadzadeh M. Gut dysbiosis is linked to hypertension. Hypertension. 2015;65:1331–1340. [DOI] [PMC free article] [PubMed] [Google Scholar]
- 12. Li J, Zhao F, Wang Y, Chen J, Tao J, Tian G, Wu S, Liu W, Cui Q, Geng B, Zhang W, Weldon R, Auguste K, Yang L, Liu X, Chen L, Yang X, Zhu B, Cai J. Gut microbiota dysbiosis contributes to the development of hypertension. Microbiome. 2017;5:14. [DOI] [PMC free article] [PubMed] [Google Scholar]
- 13. Yan Q, Gu Y, Li X, Yang W, Jia L, Chen C, Han X, Huang Y, Zhao L, Li P, Fang Z, Zhou J, Guan X, Ding Y, Wang S, Khan M, Xin Y, Li S, Ma Y. Alterations of the gut microbiome in hypertension. Front Cell Infect Microbiol. 2017;7:381. [DOI] [PMC free article] [PubMed] [Google Scholar]
- 14. Carding S, Verbeke K, Vipond DT, Corfe BM, Owen LJ. Dysbiosis of the gut microbiota in disease. Microb Ecol Health Dis. 2015;26:26191. [DOI] [PMC free article] [PubMed] [Google Scholar]
- 15. Adnan S, Nelson JW, Ajami NJ, Venna VR, Petrosino JF, Bryan RM Jr, Dugan DJ. Alterations in the gut microbiota can elicit hypertension in rats. Physiol Genomics. 2017;49:96–104. [DOI] [PMC free article] [PubMed] [Google Scholar]
- 16. Karbach SH, Schönfelder T, Brandão I, Wilms E, Hörmann N, Jäckel S, Schüler R, Finger S, Knorr M, Lagrange J, Brandt M, Waisman A, Kossmann S, Schäfer K, Münzel T, Reinhardt C, Wenzel P. Gut microbiota promote angiotensin II‐induced arterial hypertension and vascular dysfunction. J Am Heart Assoc. 2016;5:e003698 DOI: 10.1161/JAHA.116.003698. [DOI] [PMC free article] [PubMed] [Google Scholar]
- 17. Santisteban MM, Qi Y, Zubcevic J, Kim S, Yang T, Shenoy V, Cole‐Jeffrey CT, Lobaton GO, Stewart DC, Rubiano A, Simmons CS, Garcia‐Pereira F, Johnson RD, Pepine CJ, Raizada MK. Hypertension‐linked pathophysiological alterations in the gut. Circ Res. 2017;120:312–323. [DOI] [PMC free article] [PubMed] [Google Scholar]
- 18. Yang T, Richards EM, Pepine CJ, Raizada MK. The gut microbiota and the brain‐gut‐kidney axis in hypertension and chronic kidney disease. Nat Rev Nephrol. 2018;14:442–456. [DOI] [PMC free article] [PubMed] [Google Scholar]
- 19. Mancia G, Grassi G. The autonomic nervous system and hypertension. Circ Res. 2014;114:1804–1814. [DOI] [PubMed] [Google Scholar]
- 20. Xue B, Zhang Z, Johnson RF, Johnson AK. Sensitization of slow pressor angiotensin II (Ang II)‐initiated hypertension: induction of sensitization by prior Ang II treatment. Hypertension. 2012;59:459–466. [DOI] [PMC free article] [PubMed] [Google Scholar]
- 21. Xue B, Thunhorst RL, Yu Y, Guo F, Beltz TG, Felder RB, Johnson AK. Central renin‐angiotensin system activation and inflammation induced by high‐fat diet sensitize angiotensin II‐elicited hypertension. Hypertension. 2016;67:163–170. [DOI] [PMC free article] [PubMed] [Google Scholar]
- 22. Shonis CA, Waldrop TG. Augmented neuronal activity in the hypothalamus of spontaneously hypertensive rats. Brain Res Bull. 1993;30:45–52. [DOI] [PubMed] [Google Scholar]
- 23. Bardgett ME, Holbein WW, Herrera‐Rosales M, Toney GM. Ang II‐salt hypertension depends on neuronal activity in the hypothalamic paraventricular nucleus but not on local actions of tumor necrosis factor‐α. Hypertension. 2014;63:527–534. [DOI] [PMC free article] [PubMed] [Google Scholar]
- 24. Zubcevic J, Santisteban MM, Perez PD, Arocha R, Hiller H, Malphurs WL, Colon‐Perez LM, Sharma RK, de Kloet A, Krause EG, Febo M, Raizada MK. A single angiotensin II hypertensive stimulus is associated with prolonged neuronal and immune system activation in Wistar‐Kyoto rats. Front Physiol. 2017;8:592. [DOI] [PMC free article] [PubMed] [Google Scholar]
- 25. Bokulich NA, Subramanian S, Faith JJ, Gevers D, Gordon JI, Knight R, Mills DA, Caporaso JG. Quality‐filtering vastly improves diversity estimates from Illumina amplicon sequencing. Nat Methods. 2013;10:57–59. [DOI] [PMC free article] [PubMed] [Google Scholar]
- 26. Zakrzewski M, Proietti C, Ellis JJ, Hasan S, Brion MJ, Berger B, Krause L. Calypso: a user‐friendly web‐server for mining and visualizing microbiome‐environment interactions. Bioinformatics. 2017;33:782–783. [DOI] [PMC free article] [PubMed] [Google Scholar]
- 27. Perez PD, Hall G, Zubcevic J, Febo M. Cocaine differentially affects synaptic activity in memory and midbrain areas of female and male rats: an in vivo MEMRI study. Brain Imaging Behav. 2018;12:201–216. [DOI] [PMC free article] [PubMed] [Google Scholar]
- 28. Brunnquell CL, Hernandez R, Graves SA, Smit‐Oistad I, Nickles RJ, Cai W, Meyerand ME, Suzuki M. Uptake and retention of manganese contrast agents for PET and MRI in the rodent brain. Contrast Media Mol Imaging. 2016;11:371–380. [DOI] [PMC free article] [PubMed] [Google Scholar]
- 29. Stevens BR, Goel R, Seungbum K, Richards EM, Holbert RC, Pepine CJ, Raizada MK. Increased human intestinal barrier permeability plasma biomarkers zonulin and FABP2 correlated with plasma LPS and altered gut microbiome in anxiety or depression. Gut. 2018;67:1555–1557. [DOI] [PMC free article] [PubMed] [Google Scholar]
- 30. Kim S, Goel R, Kumar A, Qi Y, Lobaton G, Hosaka K, Mohammed M, Handberg EM, Richards EM, Pepine CJ, Raizada MK. Imbalance of gut microbiome and intestinal epithelial barrier dysfunction in patients with high blood pressure. Clin Sci (Lond). 2018;132:701–718. [DOI] [PMC free article] [PubMed] [Google Scholar]
- 31. Walejko JM, Kim S, Goel R, Handberg EM, Richards EM, Pepine CJ, Raizada MK. Gut microbiota and serum metabolite differences in African Americans and White Americans with high blood pressure. Int J Cardiol. 2018;271:336–339. [DOI] [PMC free article] [PubMed] [Google Scholar]
- 32. Lu D, Raizada MK. Delivery of angiotensin II type 1 receptor antisense inhibits angiotensin action in neurons from hypertensive rat brain. Proc Natl Acad Sci USA. 1995;92:2914–2918. [DOI] [PMC free article] [PubMed] [Google Scholar]
- 33. Yang H, Raizada MK. Role of phosphatidylinositol 3‐kinase in angiotensin II regulation of norepinephrine neuromodulation in brain neurons of the spontaneously hypertensive rat. J Neurosci. 1999;19:2413–2423. [DOI] [PMC free article] [PubMed] [Google Scholar]
- 34. Geraldes V, Goncalves‐Rosa N, Liu B, Paton JF, Rocha I. Essential role of RVL medullary neuronal activity in the long term maintenance of hypertension in conscious SHR. Auton Neurosci. 2014;186:22–31. [DOI] [PubMed] [Google Scholar]
- 35. Yang T, Zubcevic J. Gut‐brain axis in regulation of blood pressure. Front Physiol. 2017;8:845. [DOI] [PMC free article] [PubMed] [Google Scholar]
- 36. Kripalani KJ, McKinstry DN, Singhvi SM, Willard DA, Vukovich RA, Migdalof BH. Disposition of captopril in normal subjects. Clin Pharmacol Ther. 1980;27:636–641. [DOI] [PubMed] [Google Scholar]
- 37. Worland PJ, Drummer OH, Jarrott B. Gastric and intestinal absorption of captopril in acutely and chronically treated rats: comparison with salicylic acid. J Pharm Sci. 1984;73:1755–1758. [DOI] [PubMed] [Google Scholar]
- 38. Martínez I, Perdicaro DJ, Brown AW, Hammons S, Carden TJ, Carr TP, Eskridge KM, Walter J. Diet‐induced alterations of host cholesterol metabolism are likely to affect the gut microbiota composition in hamsters. Appl Environ Microbiol. 2013;79:516–524. [DOI] [PMC free article] [PubMed] [Google Scholar]
- 39. Ravussin Y, Koren O, Spor A, LeDuc C, Gutman R, Stombaugh J, Knight R, Ley RE, Leibel RL. Responses of gut microbiota to diet composition and weight loss in lean and obese mice. Obesity (Silver Spring). 2012;20:738–747. [DOI] [PMC free article] [PubMed] [Google Scholar]
- 40. Qiao Y, Sun J, Xie Z, Shi Y, Le G. Propensity to high‐fat diet‐induced obesity in mice is associated with the indigenous opportunistic bacteria on the interior of Peyer's patches. J Clin Biochem Nutr. 2014;55:120–128. [DOI] [PMC free article] [PubMed] [Google Scholar]
- 41. Douglass JD, Malik N, Chon SH, Wells K, Zhou YX, Choi AS, Joseph LB, Storch J. Intestinal mucosal triacylglycerol accumulation secondary to decreased lipid secretion in obese and high fat fed mice. Front Physiol. 2012;3:25. [DOI] [PMC free article] [PubMed] [Google Scholar]
- 42. de Kloet AD, Krause EG, Kim DH, Sakai RR, Seeley RJ, Woods SC. The effect of angiotensin‐converting enzyme inhibition using captopril on energy balance and glucose homeostasis. Endocrinology. 2009;150:4114–4123. [DOI] [PMC free article] [PubMed] [Google Scholar]
- 43. Neter JE, Stam BE, Kok FJ, Grobbee DE, Geleijnse JM. Influence of weight reduction on blood pressure: a meta‐analysis of randomized controlled trials. Hypertension. 2003;42:878–884. [DOI] [PubMed] [Google Scholar]
- 44. Qi Y, Aranda JM, Rodriguez V, Raizada MK, Pepine CJ. Impact of antibiotics on arterial blood pressure in a patient with resistant hypertension—a case report. Int J Cardiol. 2015;201:157–158. [DOI] [PMC free article] [PubMed] [Google Scholar]
- 45. Sink KM, Leng X, Williamson J, Kritchevsky SB, Yaffe K, Kuller L, Yasar S, Atkinson H, Robbins M, Psaty B, Goff DC Jr. Angiotensin‐converting enzyme inhibitors and cognitive decline in older adults with hypertension: results from the Cardiovascular Health Study. Arch Intern Med. 2009;169:1195–1202. [DOI] [PMC free article] [PubMed] [Google Scholar]
- 46. Zhuang S, Wang HF, Li J, Wang HY, Wang X, Xing CM. Renin‐angiotensin system blockade use and risks of cognitive decline and dementia: a meta‐analysis. Neurosci Lett. 2016;624:53–61. [DOI] [PubMed] [Google Scholar]
- 47. Asraf K, Torika N, Apte RN, Fleisher‐Berkovich S. Microglial activation is modulated by captopril. Front Cell Neurosci. 2018;12:116. [DOI] [PMC free article] [PubMed] [Google Scholar]
- 48. Warren SE, O'Connor DT, Cohen IM. Autonomic and baroreflex function after captopril in hypertension. Am Heart J. 1983;105:1002–1008. [DOI] [PubMed] [Google Scholar]
- 49. Santisteban MM, Kim S, Pepine CJ, Raizada MK. Brain‐gut‐bone marrow axis: implications for hypertension and related therapeutics. Circ Res. 2016;118:1327–1336. [DOI] [PMC free article] [PubMed] [Google Scholar]
- 50. Yang T, Ahmari N, Schmidt JT, Redler T, Arocha R, Pacholec K, Magee KL, Malphurs W, Owen JL, Krane GA, Li E, Wang GP, Vickroy TW, Raizada MK, Martyniuk CJ, Zubcevic J. Shifts in the gut microbiota composition due to depleted bone marrow beta adrenergic signaling are associated with suppressed inflammatory transcriptional networks in the mouse colon. Front Physiol. 2017;8:220. [DOI] [PMC free article] [PubMed] [Google Scholar]
- 51. Möhring J, Kintz J, Schoun J. Studies on the role of vasopressin in blood pressure control of spontaneously hypertensive rats with established hypertension (SHR, stroke‐prone strain). J Cardiovasc Pharmacol. 1979;1:593–608. [DOI] [PubMed] [Google Scholar]
- 52. van Tol HH, van den Buuse M, de Jong W, Burbach JP. Vasopressin and oxytocin gene expression in the supraoptic and paraventricular nucleus of the spontaneously hypertensive rat (SHR) during development of hypertension. Brain Res. 1988;464:303–311. [DOI] [PubMed] [Google Scholar]
- 53. Sladek CD, Blair ML, Sterling C, Mangiapane ML. Attenuation of spontaneous hypertension in rats by a vasopressin antagonist. Hypertension. 1988;12:506–512. [DOI] [PubMed] [Google Scholar]
- 54. Zhang L, Edwards DG, Berecek KH. Effects of early captopril treatment and its removal on plasma angiotensin converting enzyme (ACE) activity and arginine vasopressin in hypertensive rats (SHR) and normotensive rats (WKY). Clin Exp Hypertens. 1996;18:201–226. [DOI] [PubMed] [Google Scholar]
- 55. Fields CT, Chassaing B, Paul MJ, Gewirtz AT, de Vries GJ. Vasopressin deletion is associated with sex‐specific shifts in the gut microbiome. Gut Microbes. 2018;9:13–25. [DOI] [PMC free article] [PubMed] [Google Scholar]
- 56. Desbonnet L, Clarke G, Traplin A, O'Sullivan O, Crispie F, Moloney RD, Cotter PD, Dinan TG, Cryan JF. Gut microbiota depletion from early adolescence in mice: implications for brain and behaviour. Brain Behav Immun. 2015;48:165–173. [DOI] [PubMed] [Google Scholar]
- 57. Takeda K, Ashizawa H, Oguro M, Nakamura Y, Fukuyama M, Lee LC, Inoue A, Sasaki S, Yoshimura M, Nakagawa M. Acute effects of captopril on the baroreflex of normotensive and spontaneously hypertensive rats. Jpn Heart J. 1986;27:511–521. [DOI] [PubMed] [Google Scholar]
- 58. Takeda K, Okajima H, Hayashi J, Kawasaki S, Oguro M, Nakamura Y, Inoue A, Sasaki S, Nakagawa M, Ijichi H. Central effect of captopril on baroreflex. Clin Exp Hypertens A. 1987;9:329–335. [DOI] [PubMed] [Google Scholar]
- 59. Hasser EM, Bishop VS, Hay M. Interactions between vasopressin and baroreflex control of the sympathetic nervous system. Clin Exp Pharmacol Physiol. 1997;24:102–108. [DOI] [PubMed] [Google Scholar]
- 60. Thunhorst RL, Xu Z, Cicha MZ, Zardetto‐Smith AM, Johnson AK. Fos expression in rat brain during depletion‐induced thirst and salt appetite. Am J Physiol. 1998;274:R1807–R1814. [DOI] [PubMed] [Google Scholar]
- 61. Hashimoto T, Perlot T, Rehman A, Trichereau J, Ishiguro H, Paolino M, Sigl V, Hanada T, Hanada R, Lipinski S, Wild B, Camargo SM, Singer D, Richter A, Kuba K, Fukamizu A, Schreiber S, Clevers H, Verrey F, Rosenstiel P, Penninger JM. ACE2 links amino acid malnutrition to microbial ecology and intestinal inflammation. Nature. 2012;487:477–481. [DOI] [PMC free article] [PubMed] [Google Scholar]
- 62. Richards EM, Pepine CJ, Raizada MK, Kim S. The gut, its microbiome, and hypertension. Curr Hypertens Rep. 2017;19:36. [DOI] [PMC free article] [PubMed] [Google Scholar]
- 63. Andersen K, Weinberger MH, Constance CM, Ali MA, Jin J, Prescott MF, Keefe DL. Comparative effects of aliskiren‐based and ramipril‐based therapy on the renin system during long‐term (6 months) treatment and withdrawal in patients with hypertension. J Renin Angiotensin Aldosterone Syst. 2009;10:157–167. [DOI] [PubMed] [Google Scholar]
Associated Data
This section collects any data citations, data availability statements, or supplementary materials included in this article.
Supplementary Materials
Figure S1. CAP persistently decreased systolic BP in the SHR. Systolic BP was obtained by tail‐cuff across the duration of experiment. Significant reduction in systolic BP by CAP treatment (WK3) was maintained after withdrawal of CAP (WK5 and WK9). The 2 factors and their interaction in 2‐way ANOVA are indicated as: I for interaction; C for CAP; S for rat strains. **P<0.01; ***P<0.001; ****P<0.0001 in 2‐way ANOVA and its followed Tukey's multiple comparisons. BP indicates blood pressure; CAP, captopril; SHR, spontaneously hypertensive rat; WKY, Wistar Kyoto (rat).
Figure S2. Relative abundances of Parabacteroides and Mucispirillum. The factor C is for CAP. *P<0.05 in 2‐way ANOVA. CAP indicates captopril.
Figure S3. Hierarchical clustering heatmap was generated based on the correlation between top 50 gut microbiota OTUs and environmental factors (no CAP, CAP on and off). The hierarchical clustering is a multivariate analysis classifying groups of samples based on “most‐like” pairing, followed by subsequent linking of “second most‐like” samples until all samples are linked according to their similarities. Dashed line marks the bacterial OTUs that persistently responded to CAP. CAP indicates captopril; OTU, operational taxonomic unit.
Figure S4. A, Map of investigated brain regions as per Paxinos–Watson. B, Representative photographs of neuronal activity changes, determined by manganese‐enhanced signal in multiple cardiovascular regulatory regions in the WKY and SHR at week 0 (No CAP), week 4 (CAP on), and week 8 (CAP off). CAP indicates captopril; SHR, spontaneously hypertensive rat; WKY, Wistar Kyoto (rat).