

Abstract
Background
It is currently unknown whether 6 months of supervised treadmill exercise has a durable benefit on 6‐minute walk performance, even after exercise is completed, in people with peripheral artery disease.
Methods and Results
A total of 156 participants with peripheral artery disease were randomized to 1 of 3 groups: supervised treadmill exercise, supervised resistance training, or attention control. Participants received supervised sessions during months 1 to 6 and telephone contact during months 6 to 12. Primary outcomes were change in 6‐minute walk distance and short physical performance battery at 6‐month follow‐up and have been reported previously. Secondary outcomes were change in 6‐minute walk and short physical performance battery at 12‐month follow‐up and are reported here. A group of 134 participants (86%) completed the 12‐month follow‐up. At 6‐month follow‐up, compared with control, 6‐minute walk distance improved in the treadmill exercise group (+36.1 m, 95% CI=13.9‐58.3, P=0.001). Between 6‐ and 12‐month follow‐up, 6‐minute walk distance significantly declined (−28.6 m, 95% CI=−52.6 to −4.5, P=0.020) and physical activity declined −272 activity units (95% CI=−546 to +2, P=0.052) in the treadmill exercise group compared with controls. At 12‐month follow‐up, 6 months after completing supervised treadmill exercise, change in 6‐minute walk distance was not different between the treadmill exercise and control groups (+7.5, 95% CI=−17.5 to +32.6, P=0.56). There were no differences in short physical performance battery change between either exercise group and control at 6‐month or 12‐month follow‐up.
Conclusions
A 6‐month supervised treadmill exercise intervention that improved 6‐minute walk distance at 6‐month follow‐up did not have persistent benefit at 12‐month follow‐up. These results do not support a durable benefit of supervised treadmill exercise in peripheral artery disease.
Clinical Trial Registration
URL: https://www.clinicaltrials.gov. Identifier: NCT00106327.
Keywords: exercise, exercise training, functional capacity impairment, peripheral artery disease
Subject Categories: Peripheral Vascular Disease, Clinical Studies, Exercise
Clinical Perspective
What Is New?
Among people with lower‐extremity peripheral artery disease, 6‐minute walk distance significantly declined during the 6‐months following completion of a supervised treadmill exercise intervention.
Supervised treadmill exercise did not have a durable effect on improving walking endurance, measured by 6‐minute walk distance, in people with peripheral artery disease.
What Are the Clinical Implications?
Supervised treadmill exercise may not have a durable benefit in people with peripheral artery disease.
Additional medical interventions may be necessary to achieve sustained improvement in walking endurance after supervised treadmill exercise in people with peripheral artery disease.
Introduction
Supervised treadmill exercise significantly improves walking endurance in people with lower extremity peripheral artery disease (PAD).1, 2, 3, 4 In 2017 Medicare announced a decision to cover 12 weeks of supervised treadmill exercise for patients with symptomatic PAD.5 In providing this coverage, Medicare assumed that 12 weeks of supervised treadmill exercise would have a durable benefit for patients with PAD, even after the supervised exercise therapy was completed.5 However, relatively few data exist regarding the durability of benefit from supervised treadmill exercise for patients with PAD.
SILC (the Study to Improve Leg Circulation) was a randomized trial of 6 months of supervised treadmill exercise and supervised resistance training in people with PAD.3 SILC demonstrated that supervised treadmill exercise, but not supervised resistance training, significantly improved the 6‐minute walk at 6‐month follow‐up, compared with a control group.3 The current report describes changes in 6‐minute walk and other study outcomes at 12‐month follow‐up, 6 months after the exercise interventions were completed. The tested hypothesis was that, in people with PAD, the 6‐month supervised treadmill exercise intervention would have a durable effect on 6‐minute walk performance and the short physical performance battery (SPPB) at 12‐month follow‐up, 6 months after the supervised treadmill exercise intervention was completed.
Methods
The institutional review boards of participating sites approved the protocol. Participants gave written informed consent. The study design was a randomized clinical trial.3, 6 Participants were randomized to 1 of 3 groups: supervised treadmill exercise, supervised lower extremity resistance training, or an attention control group.3, 6 Data collection and study interventions were performed at Northwestern University Feinberg School of Medicine between April 1, 2004 and August 19, 2008. The data supporting the findings of this study are available from the corresponding author on reasonable request, within constraints allowed by the institutional review board.
Participant Identification
Participants were recruited from newspaper and radio advertisements, noninvasive vascular laboratories and clinics at Chicago‐area hospitals, mailings to Chicago residents aged 60 and older, posted flyers, recruitment mailings to people identified with a low ankle‐brachial index (ABI) in the Lifeline of Screening program, and community outreach methods.6
Inclusion and Exclusion Criteria
The inclusion criterion was an ABI ≤0.95.3, 7 Because most people with PAD do not have classical symptoms of intermittent claudication,8, 9, 10 PAD participants without classical intermittent claudication were included to increase generalizability of results.
Exclusion criteria were dementia, critical limb ischemia, foot ulcers, major amputation, nursing home residence, inability to attend exercise sessions 3 times weekly, inability to walk on a treadmill, failure to complete exercise run‐in sessions, major surgery, a myocardial infarction within the past 3 months, major surgery planned in the next year, current participation in other clinical trials, already exercising at a level comparable to that offered in either exercise arm, abnormal baseline exercise stress test, walking limitation from a cause other than PAD, poorly controlled hypertension, and a baseline SPPB score of 12 (ie, maximal possible score).
Ankle Brachial Index Measurement
A hand‐held Doppler probe (Nicolet Vascular Pocket Dop II; Nicolet Biomedical Inc, Golden, CO) was used to obtain systolic pressures in the right and left brachial, dorsalis pedis, and posterior tibial arteries.7, 11, 12 Each pressure was measured twice. The ABI was calculated by dividing the mean of the dorsalis pedis and posterior tibial pressures in each leg by the mean of the 4 brachial pressures.11 Average pressures in the arm with the higher pressure were used when 1 brachial pressure was higher than the opposite brachial pressure in both measurement sets and the 2 brachial pressures differed by ≥10 mm Hg in 1 measurement set.11, 12
Outcomes
Outcomes were measured at baseline and at 6‐month and 12‐month follow‐up after randomization. Outcome assessors were blinded to participants’ group assignments. Change in the 6‐minute walk test and the SPPB at 6‐month follow‐up were the primary outcomes.3, 13, 14, 15 Physical activity, measured by Caltrac accelerometer, was a secondary outcome.16, 17, 18 Exploratory outcomes were the Walking Impairment Questionnaire (WIQ) and the Short‐Form 36 (SF‐36) physical functioning score.19, 20
Six‐Minute Walk
The 6‐minute walk test is a well‐validated measure of walking endurance in people with PAD that is similar to the type of corridor walking required in daily life.13 The 6‐minute walk test was the primary outcome for the following reasons. First, because the 6‐minute walk is performed in a hall corridor, it is directly relevant to the type of walking that people with PAD engage in during daily life.13 In contrast, treadmill walking is performed on a moving belt and does not represent the type of walking typically encountered in daily life. Second, among people with PAD, 6‐minute walk performance correlates better with physical activity during life than treadmill walking performance.15 Third, treadmill walking performance, but not the 6‐minute walk, is associated with a significant learning effect.13 Fourth, a minimum clinically important difference has been defined for the 6‐minute walk test,21 but it has not been defined for treadmill‐walking performance.13 Fifth, the 6‐minute walk is well validated in people with PAD and predicts mobility loss and mortality.22, 23 Greater decline in the 6‐minute walk predicts higher rates of mobility loss and mortality.24 Sixth, 6‐minute walk performance correlates with PAD severity.25 Seventh, 6‐minute walk distance improves in response to supervised treadmill exercise interventions and in response to home‐based walking interventions in PAD.3, 4, 26 Because the SILC randomized trial tested a treadmill exercise intervention, and the treadmill‐walking measurement is known to have a learning effect that may be exaggerated by the treadmill intervention, the 6‐minute walk test was selected as the primary outcome to avoid a learning effect for the outcome of walking endurance.
Following a standardized protocol,3, 4, 13, 15 participants walked up and down a 100‐foot hallway for 6 minutes after standardized instructions to cover as much distance as possible. Participants were allowed to rest if needed, but the stopwatch continued during rest periods. The distance completed after 6‐minutes was recorded. The intraclass correlation coefficient for test‐retest reliability of the 6‐minute walk was 0.90 (P<0.001) among 155 PAD participants in our laboratory who completed 2 tests 1 to 2 weeks apart.13, 15
Short Physical Performance Battery
The SPPB combined data from the usual paced 4‐m walking velocity, time to rise from a seated position 5 times, and standing balance.3, 14 Individuals received a 0 score for each task they were unable to complete. Scores of 1 to 4 were assigned for the remaining tasks, according to established methods.3, 14 Scores were summed to obtain the SPPB, ranging from 0 to 12.3, 14 The test‐retest reliability of the SPPB was 0.77 (P<0.001) among 151 PAD participants in our laboratory who completed 2 tests 1 to 2 weeks apart.3
Repeated Chair Rises
Participants stood from a seated position in a straight‐backed chair 5 times as quickly as possible without using their arms. Time to complete 5 chair rises was measured.3, 14
Standing Balance
Participants were asked to hold 3 increasingly difficult standing positions for 10 seconds each: the side‐by‐side stand, semitandem stand (feet parallel and heel of 1 foot touching the base of the first toe of the opposite foot), and the full tandem stand (standing with 1 foot directly in front of the other).3, 14 Scores ranged from 0 (unable to hold the side‐by‐side stand for 10 seconds) to 4 (able to hold the full tandem stand for 10 seconds).
Four‐Meter Walking Velocity
Walking velocity was measured with a 4‐m walk performed at the usual pace, according to previously described methods.3, 14
Physical Activity
Physical activity was measured continuously for 7 days using a vertical accelerometer (Caltrac, Muscle Dynamics Fitness Network, Inc, Torrance, CA) according to established methods, yielding “activity units.”16, 17, 18
Quality of Life
The WIQ is a PAD‐specific measure of self‐reported walking limitations with 3 domains: walking distance, walking speed, and stair climbing.19 Each domain is scored on a 0‐to‐100 scale on which 0 represents the most extreme limitation and 100 represents no difficulty walking long distances, walking rapidly, or climbing 3 stair flights, respectively.19 We used the Medical Outcomes Study SF‐36 to assess functional status in the physical functioning domain.20
Randomization
Eligible participants were randomized using block randomization with block size randomly chosen from 6 and 9. Randomization was stratified by the presence versus absence of intermittent claudication.
Interventions
During months 1‐6, participants attended on‐site sessions. During months 7‐12, no on‐site sessions were provided, and all contact with participants was by telephone. Content of the telephone calls varied according to group assignment as described below. All participants were telephoned once per week during month 1, every other week during months 2‐3, and once per month in months 4‐6.
Supervised Treadmill Exercise
The supervised treadmill exercise intervention consisted of treadmill exercise 3 times weekly for 6 months, supervised by an exercise physiologist. Participants began with 15 minutes of exercise and increased to 40 minutes of exercise per session.3 After week 8, exercise intensity was increased at least weekly either by increasing treadmill speed or by increasing treadmill grade. Participants were encouraged to exercise to near‐maximal leg symptoms.
Between months 6 and 12, participants were telephoned by the exercise physiologist and encouraged to continue walking exercise. During this phase of the study, supervised sessions were not available, and exercise recommendations were individualized. Participants with access to a treadmill were encouraged to use the treadmill for exercise. Participants without access to a treadmill were encouraged to walk for exercise outside or at another venue, according to their preferences.
Supervised Lower‐Extremity Resistance Training
Participants in the lower‐extremity resistance‐training group exercised 3 times weekly for 6 months with a trainer. Participants performed 3 sets of 8 repetitions of knee‐extension, leg‐press, and leg‐curl exercises using standard equipment. For each exercise, the 1 repetition maximum was measured at baseline and subsequently every 4 weeks. Participants began exercising at 50% of their 1 repetition maximum and increased to 80% of their 1 repetition maximum during the first 5 weeks of exercise training. Weights were adjusted after each monthly 1 repetition maximum and as needed to achieve an exercise intensity consistent with a rate of perceived exertion of 12 to 14. Participants also performed 3 sets of 8 repetitions of squat and toe‐rise exercises.
Between months 6 and 12, participants were provided with ankle weights and instructed on lower extremity resistance exercises with the ankle weights to perform at home.
Attention Control, Months 1 to 6
The attention‐control group was designed to ensure that participants not randomized to exercise received regular attention from study staff. The attention control group attended 11 1‐hour group sessions over a 6‐month period, during which a registered dietician provided information regarding nutritional supplements, healthy restaurant eating, and increasing fruit and vegetable consumption. During months 6 to 12, participants were telephoned by the registered dietician, and nutrition information previously provided during on‐site sessions was reviewed.
Leg Symptoms
Leg symptoms were characterized using the San Diego claudication questionnaire.9, 27 Based on prior study, intermittent claudication was defined as exertional calf pain that did not begin at rest, caused the participant to stop walking, and resolved within 10 minutes of rest.9, 27 Participants without intermittent claudication were classified either as asymptomatic if they had no exertional leg symptoms or with atypical ischemic leg symptoms if they had exertional leg symptoms not consistent with intermittent claudication (9.27).
Additional Measures
Medical history, race, and demographics were obtained using a standardized data collection form. Body mass index was calculated based on height and weight measures obtained at the study visit.
Power Considerations
The a priori sample size calculation was as follows. At 12‐month follow‐up, 6 months after the supervised interventions were completed, a sample size of 50 participants in each group provided 80% power to detect a difference of 30.2 m in mean change of 6‐minute walk distance and a difference of 0.97 in mean change in the SPPB score between each exercise group and the control group. For the 6‐minute walk, a small meaningful difference consists of 20 m, and a large meaningful difference consists of 50 m.21 For the SPPB, a small meaningful difference consists of 0.50 point and a large meaningful difference consists of 1.0 point.21
Statistical Analyses
Intention‐to‐treat analyses were performed. Chi‐squared tests, Fisher exact test, and 1‐way analyses of variance were used to compare characteristics of participants across the 3 groups at baseline. For the outcomes of 6‐minute walk, SPPB, and Caltrac physical activity, 2‐sample, 2‐sided t tests were used to compare changes in outcomes between baseline and 6‐month follow‐up, between 6‐ and 12‐month follow‐up, and between baseline and 12‐month follow‐up between each exercise group and the control group, respectively. Because distributions of remaining outcomes (ie, WIQ scores) were skewed, median values and interquartile ranges were used to summarize cross‐sectional distributions and changes for remaining outcomes. The between‐group comparisons for these outcomes were based on 2‐sided Hodge‐Lehman tests, which did not require the normal assumption. The within‐group change was evaluated using a 1‐sample Wilcoxon rank test. Missing data were imputed for participants who attended a 12‐month follow‐up visit but were missing data for at least 1 outcome at any of the visits, using multiple imputation (SAS Proc MI; SAS Institute, Cary, NC) and generating 20 imputed data sets. Variables used for imputation were treatment assignment, age, ABI, body mass index, sex, race, smoking status, leg symptoms, comorbidities, and study outcomes at baseline, 6‐month follow‐up, and 12‐month follow‐up. Corresponding comparisons between groups were based on 2‐sample, 2‐sided t tests or Hodge‐Lehman tests, based on the imputed data sets. A priori, the P value considered statistically significant was P<0.05. Analyses were performed using SAS version 9.4.
Results
Of 156 participants with PAD randomized, 144 (92%) completed 6‐month follow‐up testing, and 134 (86%) completed 12‐month follow‐up testing (Figure 1). Participants who did not complete 12‐month follow‐up testing had higher prevalences of heart failure and current smoking compared with those who completed 12‐month follow‐up testing (Table 1).
Figure 1.
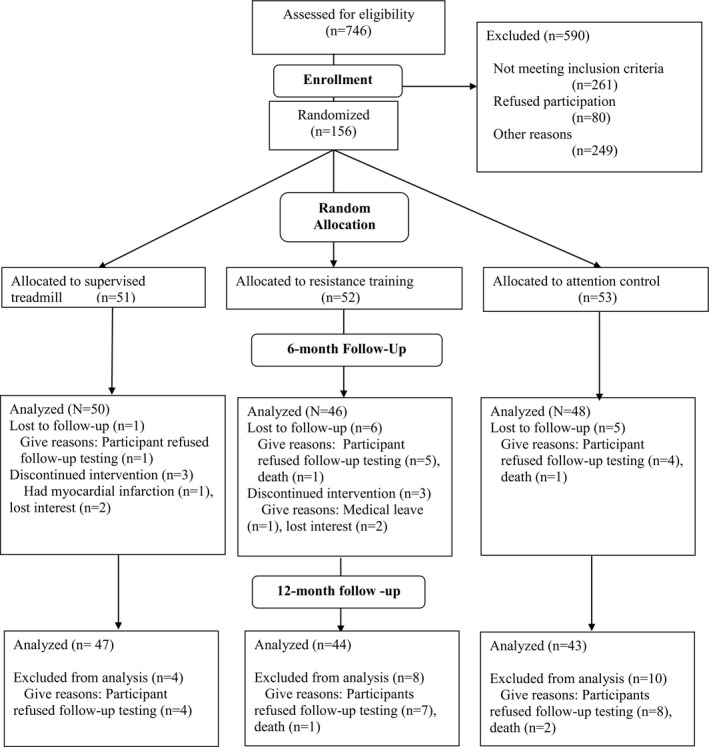
Study participation and follow‐up rates.
Table 1.
Characteristics of Participants With Versus Without 12‐Month Follow‐Up Data
| Baseline Measures | Total Randomized (N=156) | Completed 12‐Mo Follow‐Up Testing (N=134) | Did Not Complete 12‐Mo Follow‐Up Testing (N=22) |
|---|---|---|---|
| Age (y), mean (SD) | 70.6 (10.3) | 70.7 (10.4) | 70.1 (9.6) |
| Male, n (%) | 75 (48.1) | 61 (45.5) | 14 (63.6) |
| Black, n (%) | 62 (39.7) | 53 (39.6) | 9 (40.9) |
| Ankle brachial index, mean (SD) | 0.61 (0.17) | 0.61 (0.17) | 0.62 (0.20) |
| Body mass index (kg/m2), mean (SD) | 30.2 (6.8) | 30.1 (6.7) | 30.9 (7.4) |
| Current smoker, n (%) | 37 (23.7) | 28 (20.9) | 9 (40.9) |
| Angina, n (%) | 18 (11.8) | 15 (11.5) | 3 (13.6) |
| Myocardial infarction, n (%) | 34 (22.1) | 28 (21.2) | 6 (27.3) |
| Heart failure, n (%) | 21 (13.6) | 13 (9.8) | 8 (36.4) |
| Stroke, n (%) | 32 (20.8) | 26 (19.5) | 6 (28.6) |
| Pulmonary disease, n (%) | 20 (13.0) | 15 (11.3) | 5 (23.8) |
| Cancer, n (%) | 28 (17.9) | 24 (17.9) | 4 (18.2) |
| Diabetes mellitus, n (%) | 69 (44.2) | 58 (43.3) | 11 (50.0) |
| Knee arthritis, n (%) | 48 (31.2) | 44 (33.3) | 4 (18.2) |
| Hip arthritis, n (%) | 28 (18.7) | 26 (20.2) | 2 (9.5) |
| Classical intermittent claudication symptoms, n (%) | 56 (35.9) | 49 (36.6) | 7 (31.8) |
| Asymptomatic, n (%) | 11 (7.1) | 8 (6.0) | 3 (13.6) |
Among participants who completed 12‐month follow‐up testing, the mean age of participants was 70.7 (SD=10.4), 61 (46%) were male, and 53 (40%) were black; mean ABI was 0.61 (SD=0.17). The prevalence of blacks was lowest among participants randomized to strength training and highest among participants randomized to the control group. There were no other differences in characteristics across the 3 groups (Table 2). Although rates of successful telephone contact between the exercise physiologist and the participant were not systematically tracked, the proportions of successfully completed monthly telephone calls to ascertain serious adverse events were 86.9% in the treadmill‐exercise group, 84.5% in the strength‐trained group, and 83.7% in the control group.
Table 2.
Baseline Characteristics According to Group Assignment*
| Baseline Measures | Overall (N=134) | Control (N=43) | Strength (N=44) | Treadmill (N=47) |
|---|---|---|---|---|
| Age (y), mean (SD) | 70.7 (10.4) | 68.1 (12.2) | 71.8 (10.2) | 72.0 (8.5) |
| Male, n (%) | 61 (45.5) | 19 (44.2) | 22 (50.0) | 20 (42.6) |
| Black, n (%) | 53 (39.6) | 22 (51.2) | 11 (25.0) | 20 (42.6) |
| Ankle brachial index, mean (SD) | 0.61 (0.17) | 0.60 (0.18) | 0.62 (0.15) | 0.60 (0.17) |
| Body mass index (kg/m2), mean (SD) | 30.1 (6.7) | 30.5 (7.5) | 29.7 (6.5) | 30.2 (6.1) |
| Current smoker, n (%) | 28 (20.9) | 11 (25.6) | 8 (18.2) | 9 (19.1) |
| Angina, n (%) | 15 (11.5) | 3 (7.1) | 7 (16.7) | 5 (10.6) |
| Myocardial infarction, n (%) | 28 (21.2) | 5 (11.6) | 12 (27.9) | 11 (23.9) |
| Heart failure, n (%) | 13 (9.8) | 4 (9.3) | 6 (13.6) | 3 (6.7) |
| Stroke, n (%) | 26 (19.5) | 8 (18.6) | 7 (15.9) | 11 (23.9) |
| Pulmonary disease, n (%) | 15 (11.3) | 6 (14.3) | 6 (13.6) | 3 (6.4) |
| Cancer, n (%) | 24 (17.9) | 6 (14.0) | 8 (18.2) | 10 (21.3) |
| Diabetes mellitus, n (%) | 58 (43.3) | 18 (41.9) | 20 (45.5) | 20 (42.6) |
| Knee arthritis, n (%) | 44 (33.3) | 15 (34.9) | 15 (34.9) | 14 (30.4) |
| Hip arthritis, n (%) | 26 (20.2) | 8 (19.0) | 9 (22.5) | 9 (19.1) |
| Intermittent claudication, n (%) | 49 (36.6) | 17 (39.5) | 16 (36.4) | 16 (34.0) |
| Asymptomatic, no exertional leg symptoms, n (%) | 8 (6.0) | 1 (2.3) | 4 (9.1) | 3 (6.4) |
| 6‐Minute walk distance (m) | 320.6 (87.8) | 319.9 (85.0) | 315.2 (90.1) | 326.3 (89.7) |
| Short physical performance battery (0‐12, 12=best), mean (SD) | 8.71 (2.41) | 8.42 (2.83) | 8.57 (2.26) | 9.11 (2.10) |
| Physical activity over 7 days (activity units), mean SD | 666 (439) | 724 (547) | 639 (444) | 644 (314) |
| WIQ distance score, median (IQR) | 23.3 (9.4, 43.2) | 25.5 (11.6, 43.0) | 18.5 (4.2, 46.8) | 23.9 (13.6, 40.9) |
| WIQ speed score, median (IQR) | 25.0 (10.9, 39.7) | 25.0 (10.9, 32.6) | 20.7 (7.6, 37.0) | 32.6 (17.4, 46.7) |
| WIQ stair‐climbing score, median (IQR) | 37.5 (16.7, 54.2) | 41.7 (16.7, 66.7) | 29.2 (16.7, 47.9) | 41.7 (25.0, 54.2) |
| Short‐form 36 physical functioning score, median (IQR) | 40.0 (25.0, 55.0) | 40.0 (30.0, 55.0) | 35.0 (25.0, 55.0) | 35.0 (25.0, 50.0) |
Missing data were imputed for individuals who attended a 12‐month follow‐up visit but did not complete all outcomes at a study visit. IQR indicates interquartile range (25th, 75th percentiles); WIQ, Walking Impairment Questionnaire.
Data shown in Table 2 are for all participants who participated in 12‐month follow‐up testing for at least 1 outcome measure.
The 6‐month supervised treadmill exercise intervention significantly improved the 6‐minute walk distance at 6‐month follow‐up, compared with control (+36.1 m, 95%CI +13.9‐58.3, P=0.001). However, at 12‐month follow‐up, 6 months after the supervised treadmill exercise intervention had been completed, there was no difference in change in 6‐minute walk distance from baseline between people randomized to supervised treadmill exercise and those randomized to the control group (+7.5 m, 95%CI −17.5 to +32.6, P=0.56) (Table 3). During the 6 months after the supervised treadmill exercise intervention had been completed, between 6‐ and 12‐month follow‐up, the 6‐minute walk significantly declined in the treadmill exercise group (within‐group change −24.6 m, 95%CI −41.2 to −8.0, P=0.004; between‐group change compared with the control group was −28.6 m, 95%CI −52.6 to −4.5, P=0.020) (Table 4, Figure 2). There was no effect of the supervised treadmill exercise intervention on change in the SPPB at any follow‐up time point (Tables 3 and 4).
Table 3.
12‐Month Change in Study Outcomes After a 6‐Month Supervised Exercise Intervention
| Baseline | 12‐Mo Follow‐Up | Within‐Group 12‐Mo Change | 12‐Mo Change Compared to the Attention‐Control Group | |
|---|---|---|---|---|
| 6‐Minute walk test (m) | ||||
| Supervised treadmill exercise (N=47) | 326.3 (89.7) | 320.6 (107.1) | −5.7 (−22.9, +11.5), P=0.52 | +7.5 (−17.5, +32.6), P=0.56 |
| Supervised resistance training (N=44) | 315.2 (90.1) | 308.1 (98.9) | −7.1 (−24.8, +10.6), P=0.43 | +6.1 (−19.2, +31.4), P=0.64 |
| Attention control group (N=43) | 319.9 (85.0) | 306.7 (104) | −13.2 (−31.1, +4.7), P=0.15 | Reference |
| Short physical performance battery (SPPB) (0‐12 scale, 12=best) | ||||
| Supervised treadmill exercise (N=47) | 9.11 (2.1) | 9.02 (2.62) | −0.09 (−0.62, +0.45), P=0.76 | −0.34 (−1.13, +0.45), P=0.40 |
| Supervised resistance training (N=44) | 8.57 (2.26) | 8.75 (2.76) | +0.18 (−0.39, +0.74), P=0.54 | −0.08 (−0.88, +0.73), P=0.85 |
| Attention control group (N=43) | 8.42 (2.83) | 8.67 (3.04) | +0.26 (−0.31, +0.82), P=0.37 | Reference |
| WIQ distance score* | ||||
| Supervised treadmill exercise (N=47) | 23.9 (13.6, 40.9) | 37.1 (18.2, 57.4) | +11.6 (−5.0, +25.7), P=0.040 | +4.6 (−5.7, +14.9), P=0.38 |
| Supervised resistance training (N=44) | 18.5 (4.2, 46.8) | 24.0 (10.9, 59.5) | +5.8 (−0.9, +16.5), P=0.051 | +2.6 (−6.4, +11.5), P=0.57 |
| Attention control group (N=43) | 25.5 (11.6, 43.0) | 29.7 (12.5, 59.5) | +3.2 (−6.4, +24.1), P=0.30 | Reference |
| WIQ speed score* | ||||
| Supervised treadmill exercise (N=47) | 32.6 (17.4, 46.7) | 39.1 (25.0, 56.5) | +12.0 (−4.3, +25.0), P=0.14 | +4.6 (−5.0, +14.2), P=0.35 |
| Supervised resistance training (N=44) | 20.7 (7.6, 37.0) | 29.3 (14.1, 49.5) | +3.3 (0.0, +25.0), P=0.012 | +4.7 (−2.6, +12.0), P=0.20 |
| Attention control group (N=43) | 25.0 (10.9, 32.6) | 32.6 (13.0, 46.7) | 0.0 (−6.5, +18.5), P=0.37 | Reference |
| WIQ stair‐climbing score* | ||||
| Supervised treadmill exercise (N=47) | 41.7 (25.0, 54.2) | 54.2 (29.2, 62.5) | +8.3 (−8.3, +25.0), P=0.27 | +7.3 (−3.6, +18.2), P=0.19 |
| Supervised resistance training (N=44) | 29.2 (16.7, 47.9) | 41.7 (29.2, 64.6) | +8.3 (−12.5, +29.2), P=0.13 | +7.3 (−3.9, +18.5), P=0.20 |
| Attention control group (N=43) | 41.7 (16.7, 66.7) | 41.7 (29.2, 62.5) | 0.0 (−12.5, +16.7), P=0.90 | Reference |
| Short‐form‐36 physical functioning score* | ||||
| Supervised treadmill exercise (N=47) | 35.0 (25.0, 50.0) | 55.0 (40.0, 65.0) | +10.0 (−5.0, +25.0), P=0.049 | +10.0 (+0.7, +19.3), P=0.035 |
| Supervised resistance training (N=44) | 35.0 (25.0, 55.0) | 45.0 (30.0, 60.0) | +5.0 (−5.0, +15.0), P=0.24 | +5.0 (−2.8, +12.8), P=0.21 |
| Attention control group (N=43) | 40.0 (30.0, 55.0) | 45.0 (30.0, 55.0) | 0.0 (−15.0, +15.0), P=0.99 | Reference |
| Caltrac accelerometer physical activity | ||||
| Supervised treadmill exercise (N=47) | 643 (314) | 528 (318) | −115 (−264, +35), P=0.13 | −106 (−323, +112), P=0.34 |
| Supervised resistance training (N=44) | 637 (441) | 673 (484) | +37 (−125, +198), P=0.66 | +46 (−181, +272), P=0.69 |
| Attention control group (N=43) | 723 (547) | 713 (498) | −9 (−164, +146), P=0.91 | Reference |
WIQ indicates Walking Impairment Questionnaire.
Median and interquartile ranges are shown. Estimate (95%CI) and P value are from the combined results for Hodges‐Lehmann Estimation. Missing data were imputed for individuals who attended a 12‐month follow‐up visit but did not complete all outcomes at a study visit.
Table 4.
Changes From Baseline at 6‐ and 12‐Month Follow‐Up in Study Outcomes by Group Assignment Among Participants With Peripheral Artery Disease
| Group | Baseline Mean (SD) | 6‐Mo Follow‐Up Mean (SD) | 12‐Mo Follow‐Up Mean (SD) | 6‐ to 12‐Mo Within‐Group Change | 6 to 12 Mo Change Relative to Control |
|---|---|---|---|---|---|
| 6‐Minute walk (m) | |||||
| Supervised treadmill exercise (N=47) | 326.3 (89.7) | 345.2 (83.7) | 320.6 (107.1) | −24.6 (−41.2, −8.0), P=0.004 | −28.6 (−52.6, −4.5), P=0.020 |
| Supervised resistance training (N=44) | 315.2 (90.1) | 312.6 (88.6) | 308.1 (98.9) | −4.5 (−21.4, +12.4), P=0.60 | −8.4 (−32.7, +15.8), P=0.50 |
| Control group (N=43) | 319.9 (85) | 302.7 (95.7) | 306.7 (104) | +4.0 (−13.2, +21.1), P=0.65 | Reference |
| Short physical performance battery | |||||
| Supervised treadmill exercise (N=47) | 9.11 (2.1) | 9.47 (2.02) | 9.02 (2.62) | −0.45 (−0.92, +0.03), P=0.066 | −0.05 (−0.75, +0.64), P=0.88 |
| Resistance training (N=44) | 8.57 (2.26) | 9.02 (2.77) | 8.75 (2.76) | −0.28 (−0.78, +0.22), P=0.28 | +0.12 (−0.59, +0.83), P=0.74 |
| Control group (N=43) | 8.42 (2.83) | 9.07 (3.01) | 8.67 (3.04) | −0.40 (−0.89, +0.10), P=0.12 | Reference |
| WIQ distance score* | |||||
| Supervised treadmill exercise (N=47) | 23.9 (13.6, 40.9) | 47.4 (21.2, 72.3) | 37.1 (18.2, 57.4) | −0.5 (−24.5, +6.7), P=0.41 | −8.8 (−18.3, +0.6), P=0.066 |
| Resistance training (N=44) | 18.5 (4.2, 46.8) | 26.5 (10.5, 61.6) | 24.0 (10.9, 59.5) | 0.0 (−6.3, +4.3), P=0.77 | −4.5 (−11.0, +2.0), P=0.18 |
| Control group (N=43) | 25.5 (11.6, 43.0) | 27.1 (11.0, 44.6) | 29.7 (12.5, 59.5) | +3.3 (−4.3, +16.0), P=0.42 | Reference |
| WIQ walking speed score* | |||||
| Supervised treadmill exercise (N=47) | 32.6 (17.4, 46.7) | 43.5 (26.1, 56.5) | 39.1 (25.0, 56.5) | 0.0 (−15.2, +10.9), P=0.65 | −1.0 (−9.6, +7.6), P=0.81 |
| Resistance training (N=44) | 20.7 (7.6, 37.0) | 29.3 (10.9, 43.5) | 29.3 (14.1, 49.5) | 0.0 (−6.5, +10.9), P=0.64 | +1.7 (−5.0, +8.5), P=0.62 |
| Control group (N=43) | 25.0 (10.9, 32.6) | 26.1 (14.1, 43.5) | 32.6 (13.0, 46.7) | 0.0 (−7.6, +8.2), P=0.93 | Reference |
| WIQ stair‐climbing score* | |||||
| Supervised treadmill exercise (N=47) | 41.7 (25.0, 54.2) | 41.7 (29.2, 66.7) | 54.2 (29.2, 62.5) | 0.0 (−12.5, +12.5), P=0.46 | −1.5 (−8.8, +5.9), P=0.70 |
| Resistance training (N=44) | 29.2 (16.7, 47.9) | 41.7 (25.0, 66.7) | 41.7 (29.2, 64.6) | 0.0 (−12.5, +12.5), P=0.68 | −0.4 (−8.2, +7.4), P=0.92 |
| Control group (N=43) | 41.7 (16.7, 66.7) | 41.7 (16.7, 62.5) | 41.7 (29.2, 62.5) | 0.0 (−4.2, +12.5), P=0.98 | Reference |
| Short‐form‐36 physical functioning score (0‐100 scale, 100=best)* | |||||
| Supervised treadmill exercise (N=47) | 35.0 (25.0, 50.0) | 55.0 (40.0, 75.0) | 55.0 (40.0, 65.0) | 0.0 (−10.0, +10.0), P=0.42 | −1.8 (−10.3, +6.8), P=0.69 |
| Resistance training (N=44) | 35.0 (25.0, 55.0) | 50.0 (25.0, 65.0) | 45.0 (30.0, 60.0) | −5.0 (−10.0, +5.0), P=0.34 | −3.5 (−11.7, +4.7), P=0.40 |
| Control group (N=43) | 40.0 (30.0, 55.0) | 45.0 (30.0, 55.0) | 45.0 (30.0, 55.0) | 0.0 (−10.0, +10.0), P=0.82 | Reference |
| Caltrac physical activity | |||||
| Supervised treadmill exercise (N=47) | 643 (314) | 777 (864) | 528 (318) | −249 (−436, −62), P=0.009 | −272 (−546, +2), P=0.052 |
| Resistance training (N=44) | 637 (441) | 680 (519) | 673 (484) | −7 (−209, +195), P=0.94 | −30 (−310, +251), P=0.84 |
| Control group (N=43) | 723 (547) | 691 (404) | 713 (498) | +23 (−173, +219), P=0.82 | Reference |
WIQ indicates Walking Impairment Questionnaire.
Median and interquartile ranges are shown. Estimate (95%CI) and P value are from the combined results for Hodges‐Lehmann Estimation. Data were imputed for individuals who attended a 12‐month follow‐up visit but did not complete all outcome measures at each visit.
Figure 2.
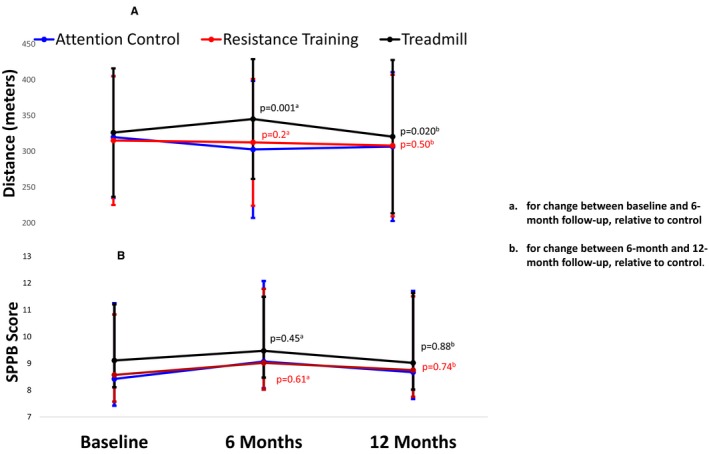
Change over time in 6‐minute walk and the short physical performance battery after a 6‐month supervised treadmill exercise intervention in peripheral artery disease (N=134). A, 6‐minute walk distance. B, Short physical performance battery (SPPB) scores.
The supervised treadmill exercise intervention significantly improved the WIQ distance score at 6‐month follow‐up (median‐+15.0, 95%CI, +6.1 to +23.9, P=0.001). However, at 12‐month follow‐up, 6 months after completion of the treadmill exercise intervention, there were no significant effects of the treadmill exercise intervention on any WIQ scores compared to the control group (Table 3). During the 6 months after the supervised treadmill exercise intervention had been completed, between 6‐ and 12‐month follow‐up, the WIQ distance score declined in the treadmill exercise group compared with the control group, but the difference did not quite reach statistical significance (−8.8, 95%CI −18.3 to +0.6, P=0.066) (Table 4).
The 6‐month supervised treadmill exercise intervention improved the SF‐36 physical functioning score at 12‐month follow‐up (+10.0, 95%CI +0.7 to 19.3, P=0.035) compared with the control group (Table 3). The supervised exercise intervention did not improve physical activity at 12‐month follow‐up, compared with the control group (Table 3).
There were no significant effects of the resistance training intervention on any study outcome at 12‐month follow‐up.
Results did not substantially change when the 8 participants (5.9%) who had reported no exertional leg symptoms at baseline (ie, asymptomatic participants) were excluded from analyses (data not shown). However, after exclusion of the 8 PAD participants who were asymptomatic, compared with control, physical activity levels significantly declined between 6‐ and 12‐month follow‐up in those randomized to supervised treadmill exercise (−285 m, 95%CI −570 to −1, P=0.0496). Results were largely unchanged when analyses were performed separately among participants with intermittent claudication and among those without intermittent claudication symptoms. However, among participants with intermittent claudication, the difference between the supervised treadmill exercise group and controls in decline in 6‐minute walk distance between 6‐ and 12‐month follow‐up was no longer statistically significant (−21.6 m, 95%CI −58.6 to +15.4), perhaps due to the small sample size in this group (N=49). In addition, among participants without classical symptoms of intermittent claudication, there was no difference in the SF‐36 physical functioning score between the supervised treadmill exercise and control groups at 12‐month follow‐up (+6.3, 95%CI −6.2 to +18.7, P=0.32), and the WIQ distance score declined significantly in the supervised treadmill exercise group compared with controls between 6‐ and 12‐month follow‐up (−12.4, 95%CI −24.4 to −0.5, P=0.042).
Nonimputed results for data in Tables 3 and 4 are shown in Tables S1 and S2.
Discussion
In the primary results for this randomized clinical trial of participants with PAD, 6 months of supervised treadmill exercise significantly improved the 6‐minute walk distance at 6‐month follow‐up compared with a control group.3 However, the 6‐minute walk distance significantly declined during the 6 months after supervised exercise had ended. Twelve months after baseline (6 months after the supervised treadmill exercise intervention had been completed), there was no significant difference in change in the 6‐minute walk distance from baseline between PAD participants randomized to supervised treadmill exercise and those randomized to control. These results demonstrated that supervised treadmill exercise did not have a durable benefit on a 6‐minute walk distance in people with PAD.
To our knowledge, this is the only trial to study whether the beneficial effect of supervised treadmill exercise on the 6‐minute walk distance in people with PAD is durable after the supervised treadmill exercise intervention has been completed. However, prior studies have suggested that supervised treadmill exercise had a persistent benefit on treadmill‐walking performance. The CLEVER (Claudication: Exercise vs. Endoluminal Revascularization Study) trial randomized 111 participants with PAD and aortoiliac disease to either supervised treadmill exercise for 6 months, endovascular revascularization with stenting, or neither therapy.28, 29 At 6‐month follow‐up, supervised treadmill exercise and revascularization each improved treadmill walking performance more than control paticipants (within‐group mean change from baseline: +5.8 minutes [SD=4.6], +3.7 minutes [SD=4.9], and +1.2 minutes [SD=2.6], respectively).28 Between a 6‐ and 18‐month follow‐up, participants in the treadmill exercise group received telephone calls encouraging exercise but were not supervised. Among the 79 (71%) of the randomized participants who completed 18‐month follow‐up measures, treadmill walking time remained significantly better in the supervised treadmill exercise group and in the revascularization group compared with controls (+5.0 minutes [SD=5.4], +3.2 minutes [SD=4.7], +0.2 minutes [SD=2.1], respectively).29 A separate study reported that 4 years after completing a supervised treadmill exercise intervention, few patients with PAD continued to exercise and that those who stopped exercising experienced the greatest decline in treadmill walking ability.30 However, this study was limited by a 50% dropout rate. The outcome measure in these prior trials was treadmill‐walking performance, which is associated with a learning effect. Therefore, it is possible that the persistent improvement in treadmill‐walking performance may be due to a learning effect rather than a true long‐term benefit in walking endurance.13 In contrast, the 6‐minute walk test is not associated with a learning effect.13 Therefore, persistent improvement in the 6‐minute walk is more likely to represent a meaningful persistent improvement in walking endurance. The lack of persistent benefit in 6‐minute walk performance is important because the corridor walking measured during the 6‐minute walk test is more relevant to walking during daily life.13
The WIQ distance score significantly improved in the supervised treadmill group at 6‐month follow‐up, but this effect did not persist at 12‐month follow‐up. However, the SF‐36 physical functioning score was significantly better in the supervised treadmill exercise group compared with the control group at 12‐month follow‐up, suggesting that those randomized to supervised treadmill exercise perceived benefit at 12‐month follow‐up, even though their 6‐minute walk distance was not better at 12‐month follow‐up compared to the control group.
In contrast to findings reported here for the 6‐minute walk, a previous study showed that a home‐based walking exercise intervention had a durable benefit on change in 6‐minute walk distance in people with PAD.30 The GOALS (Group Oriented Arterial Leg Study) trial randomized 194 participants with PAD to a group‐mediated cognitive behavioral intervention designed to encourage home‐based exercise, versus an attention control group.30 After 6‐months of weekly on‐site meetings with the study coach and other participants with PAD, the 6‐minute walk distance significantly improved by 53.5 m in the intervention group, relative to the control group.30 Between 6‐ and 12‐month follow‐up, PAD participants received only telephone calls encouraging them to continue exercise. At 12‐month follow‐up, participants randomized to exercise continued to have a significantly greater improvement from baseline in 6‐minute walk distance by +34.1 m 6 months after the intensive phase of the intervention had been completed, relative to the control group.30
There are several potential explanations for why supervised treadmill exercise did not have a sustained benefit on improving the 6‐minute walk distance in people with PAD. First, supervised treadmill exercise has a more potent effect on improving treadmill‐walking distance than on improving the 6‐minute walk distance.3, 4, 13, 31, 32 In people with PAD, supervised treadmill exercise improves the 6‐minute walk by 31 m compared with a nonexercising control group, whereas home‐based exercise improves the 6‐minute walk by 50 to 55 m compared with a nonexercising control group.3, 4, 31, 32 This less potent effect of supervised treadmill exercise on change in 6‐minute walk distance may result in a less durable benefit of supervised treadmill exercise on change in 6‐minute walk. Second, supervised treadmill exercise is difficult for many PAD patients to continue once the supervised treadmill exercise intervention is completed. Third, supervised treadmill exercise improves treadmill‐walking performance in part because of a learning effect,13 and this learning effect may be durable, resulting in a persistently improved treadmill‐walking distance, even after the supervised treadmill exercise intervention has been completed. In contrast, supervised treadmill exercise does not confer a learning effect on the 6‐minute walk test. Therefore, a 6‐minute walk distance may be a more direct measure of walking endurance, which may decline after supervised treadmill exercise is completed. Findings reported here are consistent with prior data suggesting that 6‐minute walk performance and treadmill‐walking performance should not be considered interchangeable measures of walking endurance in people with PAD.33 Fourth, a decline in physical activity level observed in the supervised treadmill exercise group between 6‐ and 12‐month follow‐up that was nearly statistically significant compared with the control group may have contributed to the decline in the 6‐minute walk distance observed in this group after the supervised treadmill exercise intervention ended.
This study has limitations. First, this trial did not repeat treadmill exercise testing at 12‐month follow‐up. Therefore, it could not determine whether the improvement in treadmill‐walking performance observed at the 6‐month follow‐up was maintained at 12 months.3 Second, 10 participants who completed a 6‐month follow‐up did not complete the 12‐month follow‐up testing. However, data were imputed for the participants who provided data for at least one 12‐month follow‐up measure.
Conclusion
A supervised treadmill exercise intervention that significantly improved the 6‐minute walk distance at a 6‐month follow‐up3 did not have a durable benefit on that 6‐minute walk performance 6 months after the treadmill exercise intervention was completed. These results do not support a persistent beneficial effect of supervised treadmill exercise on the 6‐minute walk distance in patients with PAD.
Sources of Funding
This work was funded by the National Heart Lung and Blood Institute (R01‐HL73351, R01‐HL122846, and R01‐HL126117), the intramural program of the National Institute on Aging, and the Jesse Brown VA Medical Center.
Disclosures
Dr McDermott reports receipt of research support from Hershey's Company, ReserveAge, Chromadex, Regeneron, and ViroMed. The remaining authors have no disclosures to report.
Supporting information
Table S1. 12‐Month Change in Study Outcomes After a 6‐Month Supervised Exercise Intervention
Table S2. Changes From Baseline at 6‐ and 12‐Month Follow‐Up in Study Outcomes by Group Assignment Among Participants With Peripheral Artery Disease
(J Am Heart Assoc. 2019;8:e009380 DOI: 10.1161/JAHA.118.009380.)
References
- 1. McDermott MM, Kibbe MR. Improving lower extremity functioning in peripheral artery disease: exercise, endovascular revascularization, or both? JAMA. 2017;317:689–690. [DOI] [PubMed] [Google Scholar]
- 2. Fakhry F, van de Luijtgaarden KM, Bax L, den Hoed PT, Hunink MG, Rouwet EV, Spronk S. Supervised walking therapy in patients with intermittent claudication. J Vasc Surg. 2012;56:1132–1142. [DOI] [PubMed] [Google Scholar]
- 3. McDermott MM, Ades P, Guralnik JM, Dyer A, Ferrucci L, Liu K, Nelson M, Lloyd‐Jones D, Van Horn L, Garside D, Kibbe M, Domanchuk K, Stein JH, Liao Y, Tao H, Green D, Pearce WH, Schneider JR, McPherson D, Laing ST, McCarthy WJ, Shroff A, Criqui MH. Treadmill exercise and resistance training in patients with peripheral arterial disease with and without intermittent claudication: a randomized controlled trial. JAMA. 2009;301:165–174. [DOI] [PMC free article] [PubMed] [Google Scholar]
- 4. McDermott MM, Ferrucci L, Tian L, Guralnik JM, Lloyd‐Jones D, Kibbe MR, Polonsky TS, Domanchuk K, Stein JH, Zhao L, Taylor D, Skelly C, Pearce W, Perlman H, McCarthy W, Li L, Gao Y, Sufit R, Bloomfield CL, Criqui MH. Effect of granulocyte‐macrophage colony‐stimulating factor with or without supervised exercise on walking performance in patients with peripheral artery disease: the PROPEL randomized clinical trial. JAMA. 2017;318:2089–2098. [DOI] [PMC free article] [PubMed] [Google Scholar]
- 5. Centers for Medicare and Medicaid Services . Decision Memo for Supervised Exercise Therapy (SET) for Symptomatic Peripheral Artery Disease (PAD) (CAG‐00449N). 2017. Available at: https://www.cms.gov/medicare-coverage-database/details/nca-decision-memo.aspx?NCAId=287. Accessed January 20, 2018.
- 6. McDermott MM, Domanchuk K, Dyer A, Ades P, Kibbe M, Criqui MH. Recruiting participants with peripheral arterial disease for clinical trials: experience from the Study to Improve Leg Circulation (SILC). J Vasc Surg. 2009;49:653–659. [DOI] [PMC free article] [PubMed] [Google Scholar]
- 7. Aboyans V, Criqui MH, Abraham P, Allison MA, Creager MA, Diehm C, Fowkes FG, Hiatt WR, Jönsson B, Lacroix P, Marin B, McDermott MM, Norgren L, Pande RL, Preux PM, Stoffers HE, Treat‐Jacobson D; American Heart Association Council on Peripheral Vascular Disease; Council on Epidemiology and Prevention; Council on Clinical Cardiology; Council on Cardiovascular Nursing; Council on Cardiovascular Radiology and Intervention, and Council on Cardiovascular Surgery and Anesthesia; American Heart Association Council on Peripheral Vascular Disease . Measurement and interpretation of the ankle‐brachial index: a scientific statement from the American Heart Association. Circulation. 2012;126:2890–2909. [DOI] [PubMed] [Google Scholar]
- 8. McDermott MM. Lower extremity manifestations of peripheral artery disease: the pathophysiologic and functional implications of leg ischemia. Circ Res. 2015;116:1540–1550. [DOI] [PMC free article] [PubMed] [Google Scholar]
- 9. McDermott MM, Greenland P, Liu K, Guralnik JM, Criqui MH, Dolan NC, Chan C, Celic L, Pearce WH, Schneider JR, Sharma L, Clark E, Gibson D, Martin GJ. Leg symptoms in peripheral arterial disease: associated clinical characteristics and functional impairment. JAMA. 2001;286:1599–1606. [DOI] [PubMed] [Google Scholar]
- 10. McDermott MM, Spring B, Berger JS, Treat‐Jacobson D, Conte MS, Creager MA, Criqui MH, Ferrucci L, Gornik HL, Guralnik JM, Hahn EA, Henke P, Kibbe MR, Kohlman‐Trigoboff D, Li L, Lloyd‐Jones D, McCarthy W, Polonsky TS, Skelly C, Tian L, Zhao L, Zhang D, Rejeski J. Effect of a home‐based exercise intervention of wearable technology and telephone coaching on walking performance in peripheral artery disease. JAMA. 2018;319:1665–1676. [DOI] [PMC free article] [PubMed] [Google Scholar]
- 11. McDermott MM, Criqui MH, Liu K, Guralnik JM, Greenland P, Martin GJ, Pearce W. Lower ankle/brachial index, as calculated by averaging the dorsalis pedis and posterior tibial arterial pressures, and association with leg functioning in peripheral arterial disease. J Vasc Surg. 2000;32:1164–1171. [DOI] [PubMed] [Google Scholar]
- 12. Shadman R, Criqui MH, Bundens WP, Fronek A, Denenberg JO, Gamst AC, McDermott MM. Subclavian artery stenosis: prevalence, risk factors, and association with cardiovascular diseases. J Am Coll Cardiol. 2004;44:618–623. [DOI] [PubMed] [Google Scholar]
- 13. McDermott MM, Guralnik JM, Criqui MH, Liu K, Kibbe MR, Ferrucci L. Six‐minute walk is a better outcome measure than treadmill walking tests in therapeutic trials of patients with peripheral artery disease. Circulation. 2014;130:61–68. [DOI] [PMC free article] [PubMed] [Google Scholar]
- 14. Guralnik JM, Ferruccii L, Simonsick EM, Salive ME, Wallace RB. Lower‐extremity function in persons over the age of 70 years as a predictor of subsequent disability. N Engl J Med. 1995;332:556–561. [DOI] [PMC free article] [PubMed] [Google Scholar]
- 15. McDermott MM, Ades PA, Dyer A, Guralnik JM, Kibbe M, Criqui MH. Corridor‐based functional performance measures correlate better with physical activity during daily life than treadmill measures in persons with peripheral arterial disease. J Vasc Surg. 2008;48:1231–1237. [DOI] [PMC free article] [PubMed] [Google Scholar]
- 16. McDermott MM, Liu K, O'Brien E, Guralnik JM, Criqui MH, Martin GJ, Greenland P. Measuring physical activity in peripheral arterial disease: a comparison of two physical activity questionnaires with an accelerometer. Angiology. 2000;51:91–100. [DOI] [PubMed] [Google Scholar]
- 17. McDermott MM, Ohlmiller SM, Liu K, Guralnik JM, Martin GJ, Pearce WH, Greenland P. Gait alterations associated with walking impairment in people with peripheral arterial disease with and without intermittent claudication. J Am Geriatr Soc. 2001;49:747–754. [DOI] [PubMed] [Google Scholar]
- 18. Garg PK, Tian L, Criqui MH, Lu K, Ferrucci L, Guralnik JM, Tan J, McDermott MM. Physical activity during daily life and mortality in patients with peripheral arterial disease. Circulation. 2006;114:242–248. [DOI] [PMC free article] [PubMed] [Google Scholar]
- 19. Regensteiner JG, Steiner JF, Panzer RJ, Hiatt WR. Evaluation of walking impairment by questionnaire in patients with peripheral arterial disease. J Vasc Med Biol. 1990;2:142–152. [Google Scholar]
- 20. Ware JE, Snow KK, Kosinski M, Gandek B. SF‐36 Health Survey: Manual and Interpretation Guide. Boston, MA: The Health Institute, New England Medical Center; 1993. [Google Scholar]
- 21. Perera S, Mody SH, Woodman RC, Studenski SA. Meaningful change and responsiveness in common physical performance measures in older adults. J Am Geriatr Soc. 2006;54:743–749. [DOI] [PubMed] [Google Scholar]
- 22. McDermott MM, Guralnik JM, Tian L, Ferrucci L, Liu K, Liao Y, Criqui MH. Baseline functional performance predicts the rate of mobility loss in persons with peripheral arterial disease. J Am Coll Cardiol. 2007;50:974–982. [DOI] [PMC free article] [PubMed] [Google Scholar]
- 23. McDermott MM, Tian L, Liu K, Guralnik JM, Ferrucci L, Tan J, Pearce WH, Schneider JR, Criqui MH. Prognostic value of functional performance for mortality in patients with peripheral artery disease. J Am Coll Cardiol. 2008;51:1482–1489. [DOI] [PMC free article] [PubMed] [Google Scholar]
- 24. McDermott MM, Liu K, Ferrucci L, Tian L, Guralnik JM, Criqui MH. Decline in functional performance predicts later increased mobility loss and mortality in peripheral arterial disease. J Am Coll Cardiol. 2011;57:962–970. [DOI] [PMC free article] [PubMed] [Google Scholar]
- 25. McDermott MM, Greenland P, Liu K, Guralnik JM, Celic L, Criqui MH, Chan C, Martin GJ, Schneider J, Pearce WH, Taylor LM, Clark E. The ankle brachial index is associated with leg function and physical activity: the walking and leg circulation study. Ann Intern Med. 2002;136:873–883. [DOI] [PubMed] [Google Scholar]
- 26. McDermott MM, Liu K, Guralnik JM, Criqui MH, Spring B, Tian L, Domanchuk K, Ferrucci L, Lloyd‐Jones D, Kibbe M, Tao H, Zhao L, Liao Y, Rejeski WJ. Home‐based walking exercise intervention in peripheral artery disease: a randomized clinical trial. JAMA. 2013;310:57–65. [DOI] [PMC free article] [PubMed] [Google Scholar]
- 27. Criqui MH, Denenberg JO, Bird CE, Fronek A, Klauber MR, Langer RD. The correlation between symptoms and non‐invasive test results in patients referred for peripheral arterial disease testing. Vasc Med. 1996;1:65–71. [DOI] [PubMed] [Google Scholar]
- 28. Murphy TP, Cutlip DE, Regensteiner JG, Mohler ER, Cohen DJ, Reynolds MR, Massaro JM, Lewis BA, Cerezo J, Oldenburg NC, Thum CC, Goldberg S, Jaff MR, Steffes MW, Comerota AJ, Ehrman J, Treat‐Jacobson D, Walsh ME, Collins T, Badenhop DT, Bronas U, Hirsch AT; CLEVER Study Investigators . Supervised exercise versus primary stenting for claudication resulting from aortoiliac peripheral artery disease: six‐month outcomes from the claudication: exercise versus endoluminal revascularization (CLEVER) study. Circulation. 2012;125:130–139. [DOI] [PMC free article] [PubMed] [Google Scholar]
- 29. Murphy TP, Cutlip DE, Regensteiner JG, Mohler ER III, Cohen DJ, Reynolds MR, Massaro JM, Lewis BA, Cerezo J, Oldenburg NC, Thum CC, Jaff MR, Comerota AJ, Steffes MW, Abrahamsen IH, Goldberg S, Hirsch AT. Supervised exercise, stent revascularization, or medical therapy for claudication due to aortoiliac peripheral artery disease: the CLEVER study. J Am Coll Cardiol. 2015;65:999–1009. [DOI] [PMC free article] [PubMed] [Google Scholar]
- 30. Menard JR, Smith HE, Riebe D, Braun CM, Blissmer B, Patterson RB. Long‐term results of peripheral arterial disease rehabilitation. J Vasc Surg. 2004;39:1186–1192. [DOI] [PubMed] [Google Scholar]
- 31. McDermott MM, Guralnik JM, Criqui MH, Ferrucci L, Zhao L, Liu K, Domanchuk K, Spring B, Tian L, Kibbe M, Liao Y, Lloyd Jones D, Rejeski WJ. Home‐based walking exercise in peripheral artery disease: 12‐month follow‐up of the GOALS randomized trial. J Am Heart Assoc. 2014;3:e000711 DOI: 10.1161/JAHA.113.000711. [DOI] [PMC free article] [PubMed] [Google Scholar]
- 32. Gardner AW, Parker DE, Montgomery PS, Blevins SM. Step‐monitored home exercise improves ambulation, vascular function, and inflammation in symptomatic patients with peripheral artery disease: a randomized controlled trial. J Am Heart Assoc. 2014;3:e001107 DOI: 10.1161/JAHA.114.001107. [DOI] [PMC free article] [PubMed] [Google Scholar]
- 33. McDermott MM, Leeuwenburgh C, Guralnik JM, Tian L, Sufit R, Zhao L, Criqui MH, Kibbe MR, Stein JH, Lloyd‐Jones D, Anton SD, Polonsky TS, Gao Y, de Cabo R, Ferrucci L. The effect of resveratrol on walking performance in people with peripheral artery disease: the RESTORE randomized trial. JAMA Cardiol. 2017;2:902–907. [DOI] [PMC free article] [PubMed] [Google Scholar]
Associated Data
This section collects any data citations, data availability statements, or supplementary materials included in this article.
Supplementary Materials
Table S1. 12‐Month Change in Study Outcomes After a 6‐Month Supervised Exercise Intervention
Table S2. Changes From Baseline at 6‐ and 12‐Month Follow‐Up in Study Outcomes by Group Assignment Among Participants With Peripheral Artery Disease