

Abstract
Background
Women have worse outcomes after stroke than men, and this may be partly explained by stroke severity. We examined factors contributing to sex differences in severity of acute stroke assessed by the National Institutes of Health Stroke Scale.
Methods and Results
We pooled individual participant data with National Institutes of Health Stroke Scale assessment (N=6343) from 8 population‐based stroke incidence studies (1996–2014), forming part of INSTRUCT (International Stroke Outcomes Study). Information on sociodemographics, stroke‐related clinical factors, comorbidities, and pre‐stroke function were obtained. Within each study, relative risk regression using log‐binominal modeling was used to estimate the female:male relative risk (RR) of more severe stroke (National Institutes of Health Stroke Scale>7) stratified by stroke type (ischemic stroke and intracerebral hemorrhage). Study‐specific unadjusted and adjusted RRs, controlling for confounding variables, were pooled using random‐effects meta‐analysis. National Institutes of Health Stroke Scale data were recorded in 5326 (96%) of 5570 cases with ischemic stroke and 773 (90%) of 855 participants with intracerebral hemorrhage. The pooled unadjusted female:male RR for severe ischemic stroke was 1.35 (95% CI 1.24–1.46). The sex difference in severity was attenuated after adjustment for age, pre‐stroke dependency, and atrial fibrillation but remained statistically significant (pooled RR adjusted 1.20, 95% CI 1.10–1.30). There was no sex difference in severity for intracerebral hemorrhage (RR crude 1.08, 95% CI 0.97–1.21; RR adjusted 1.08, 95% CI 0.96–1.20).
Conclusions
Although women presented with more severe ischemic stroke than men, much although not all of the difference was explained by pre‐stroke factors. Sex differences could potentially be ameliorated by strategies to improve pre‐stroke health in the elderly, the majority of whom are women. Further research on the potential biological origin of sex differences in stroke severity may also be warranted.
Keywords: epidemiology, sex difference, stroke
Subject Categories: Quality and Outcomes, Meta Analysis
Clinical Perspective
What Is New?
Our article shows that women present with more severe ischemic stroke than men and the difference is partly explained by their older age, greater pre‐stroke dependency, and higher prevalence of atrial fibrillation compared with men.
What are the clinical implications?
Better preventative health care for women may potentially reduce their incidence of stroke but also minimize the severity of strokes if they occur.
Given the greater severity of these events in women ensuring that there is equal access to treatments including thrombolysis and thrombectomy may reduce severity.
Introduction
Women are less likely to survive following stroke because of a higher case fatality rate in the acute phase, but long‐term sex differences in mortality persist up to 5 years after stroke.1 Women also often have poorer functional outcome, increased participation restriction, and lower health‐related quality of life after stroke than men.1, 2 One explanation for these sex differences in outcome is that women have more severe strokes than men.1, 2, 3 While several studies have reported on sex differences in the severity of stroke, most often these studies use severity as a covariate rather than as a primary outcome.4, 5 Another challenge is that the measurement of severity can differ between studies.6, 7, 8 Thus the importance and causes of the association between sex and stroke severity, remain uncertain.3 Although there are reports on factors that contribute to severity of stroke (eg, hypertension,9 cardiovascular diseases,10 dementia,11 embolic stroke mechanism12), the relative importance of these factors to differences in severity between women and men has not been investigated thoroughly.
Among the few studies designed to examine the etiology of sex differences in stroke severity,13, 14 there are important differences in the data sources, methods of analysis, and adjustment for confounding factors. Renoux et al14 reported 49% (unadjusted odds ratio 1.49, 95% CI 1.23–1.80) increased odds of having a severe stroke (National Institutes of Health Stroke Scale [NIHSS] ≥5) for women compared with men, which was partly explained by age and pre‐stroke modified Rankin Scale (adjusted odds ratio 1.19, 95% CI 0.94–1.52 following adjustment for these 2 variables). In contrast, Gall and colleagues reported a 23% (unadjusted relative risk [RR] 1.23, 95% CI 1.05–1.45) greater risk of severe stroke (NIHSS>7) in women; but the difference was almost completely explained by women's older age, presence of dementia, atrial fibrillation, and pre‐stroke Barthel index (adjusted RR 1.05 95% CI 0.91–1.22).13 Other than age, pre‐stroke functional limitations, and comorbidities, there has been limited consideration on the influence of other potential confounding factors such as pre‐stroke medication,15 delay in presenting to the hospital,16 and mechanism of ischemic stroke (ie, cardioembolic strokes)17 on the sex difference in severity.
Examination of a wider range of potential contributors to any observed sex difference in stroke severity is important to help address the gaps in our understanding of factors affecting sex‐specific difference in stroke outcomes. Using information from an individual participant data (IPD) meta‐analysis we aimed to 1) quantify the sex difference in stroke severity assessed by initial the National Institutes of Health Stroke Scale (NIHSS) score among patients with first‐ever acute stroke (both ischemic and hemorrhagic); and 2) investigate the factors (ie, sociodemographics, pre‐stroke health, comorbidities, and clinical factors) that contribute to any observed difference.
Methods
The data, analytic methods, and study materials will not be made available to other researchers for purposes of reproducing the results or replicating the procedure. Qualified investigators can request access to patient‐level data, analytic methods, and study materials after ethics clearance and approval by all authors.
The INSTRUCT (International stroke outcomes study)―an IPD meta‐analysis of long‐term outcomes after stroke―is a collaboration of investigators from 13 “gold standard” population‐based stroke incidence studies (limited to first‐ever acute strokes) from Australasia, Europe, South America, and the Caribbean.1 The INSTRUCT study was registered in the International prospective register of systematic reviews (PROSPERO; CRD 42016036723)18 and performed according to the Preferred Reporting Items for Systematic Review and Meta‐Analyses of individual participant data (PRISMA‐IPD) guidelines.19 Further details about the INSTRUCT study are provided in Data S1 and Table S1.
Outcome Measurement
Of the 13 studies forming the INSTRUCT, 8 studies had data on National Institutes of Health Stroke Scale (NIHSS) scores recorded at the acute stage and so were included in this analysis. The NIHSS assessment was recorded directly in 7 studies and responses were mapped from Scandinavian Stroke Scale) data available in 1 other study (Tartu) using the formula: Scandinavian Stroke Scale =50−2×NIHSS.20
Predictors of Outcome (Covariates)
We obtained data on a range of covariates in each cohort that might explain differences in stroke severity between men and women. These factors included: sociodemographics, pre‐stroke health (functional dependence, comorbidities, health behaviors, pre‐stroke medications), stroke type; acute management (hospital admission, time delay to hospital presentation), and the year of stroke occurrence (1996–2014). Details on how these data were collected and the definitions used for each variable in each specific study are provided in Data S2 and Table S2.
Available sociodemographic data included race/ethnicity (2 studies), marital status (4 studies), education (4 studies), and socioeconomic status (3 studies). Data on pre‐stroke health status included dependence before stroke (4 studies, modified Rankin Scale >2; 3 studies, Barthel Index ≤20; 4 studies, institutional residence); comorbidities/medical history (all studies―atrial fibrillation, hypertension, ischemic heart disease, transient ischemic attack; 5 studies, peripheral vascular disease; 4 studies, diabetes mellitus; 3 studies, dementia); medications before stroke (4 studies, antihypertensives; 4 studies, antiplatelets; 1 study, anticoagulants); body mass index (5 studies), and health behaviors (7 studies, smoking status; 6 studies, alcohol use status). Type of stroke was categorized into 4 groups: ischemic stroke (IS), intracerebral hemorrhage (ICH), subarachnoid hemorrhage, and undetermined stroke. Ischemic stroke subtypes, available in 4 studies, were categorized by TOAST (Trial of Org 10172 in Acute Stroke Treatment) classification21 including large‐artery atherosclerosis, cardioembolism, small‐vessel occlusion, and other determined etiology.
Statistical Analysis
All analyses were conducted in Stata 12.1. A 2‐tailed P≤0.05 was considered statistically significant.
Study‐specific analyses of the characteristics of participants (eg, mean age, percentage of pre‐stroke functional limitation) were compared between men and women and then pooled using random‐effects meta‐analysis. We only undertook analyses for IS and ICH because NIHSS was not routinely collected for subarachnoid hemorrhage and undetermined stroke. Stroke severity was dichotomized into severe (NIHSS>7) or not‐severe (NIHSS ≤7).13
Since covariates were not measured uniformly between studies, we used the 2‐stage method of analysis proposed for IPD meta‐analyses.22 The first stage involved building study‐specific unadjusted and adjusted relative risk regression using log‐binomial models to estimate the relative risk of severe stroke (NIHSS>7 versus ≤7) for women compared with men. Assuming the confounding role23 of covariates in the association between sex and severity are similar across studies, the equivalent covariates were adjusted across studies. They included age, pre‐stroke function, and history of atrial fibrillation (AF) that were well‐established to influence sex differences in stroke outcomes1, 2 among IS, and age only for ICH. Adjustment was first done for age, and then further for pre‐stroke function, when possible, and AF in multivariable model. Within each study, we assessed whether these 3 variables and other covariates met the following criteria of being a confounder (associated with sex, associated with stroke severity, and the inclusion of the covariate changed the magnitude of the sex coefficient by ≥10%).24 We tested whether continuous covariates (ie, age, pre‐stroke Rankin, or pre‐stroke Barthel) require a transformation using fractional polynomials in multivariable modeling,25 to get the best model fit. Within each study, statistical interactions were assessed by a test of statistical significance of a sex×covariate or covariate×covariate product term.
For the second stage of the analysis, both unadjusted and adjusted study‐specific estimates were pooled in separate random‐effects meta‐analyses, because of inconsistent study designs, settings, covariates and outcome measures across different populations. We also presented estimates from fixed‐effects meta‐analyses to compare with the random‐effects approach. Heterogeneity was evaluated using Q statistics and I2 statistics. Meta‐regression was used to identify the sources of statistically significant heterogeneity among study‐level characteristics including the presence of pre‐stroke function data, geographic regions, and proportion of women.
Sensitivity Analyses
We also reported the subgroup analyses of the difference in severity of IS by TOAST subtype. Given the uncertainty over the particular cut point to use to define a severe stroke, we also undertook a sensitivity analysis by analyzing NIHSS as a continuous variable to compare with the main results of dichotomous analyses. Where necessary, transformations of NIHSS outcome data were performed to remove skewness.
To further test the robustness of our findings, we used a single‐stage meta‐analysis pooling all IPD data sets (8 studies).26 Adjustment for common covariates that are important confounders or contributing factors to the association between sex and stroke severity was performed. Similar to the analyses using a 2‐stage modeling approach, we included age, the presence of atrial fibrillation, and pre‐stroke function when possible, in multivariable models for IS and age for ICH.
We tried to harmonize the data to conduct a multivariable analysis of the pooled IPD. Because of inconsistent measures of (or closely related to) pre‐stroke function among 6 studies, a binary variable of pre‐stroke functional limitation was generated whereby the existing of functional limitation before stroke was defined as the modified Rankin Scale >2 (Oxford, Perth, Tartu), Barthel Index <20 (Melbourne), or being in an institution (Orebro, Dijon). For those 2 studies without data on pre‐stroke function (Joinville, Mãtao), multiple imputation using chained equations27 (m=50 imputations) was performed to account for these missing values based on the available data on NIHSS and covariates in the pooled data set. To compare with our main findings using 2‐stage approach, we reported pooled estimates of all 8 studies and a subset of 6 studies with data on pre‐stroke function.
Statistical interactions in multivariable models were also assessed within the single pooled data set. Year of stroke occurrence and age that were measured consistently in all studies were further examined whether they modified the relationship between sex and stroke severity.
Results
Sex Difference in Patient Characteristics
Data on initial NIHSS recorded after acute stroke onset were available among 5326/5570 (95.6%) IS and 773/855 (92.6%) ICH participants of the 8 studies28, 29, 30, 31, 32, 33, 34, 35 (Tables S3 and S4). Among those with IS, compared with men, women were on average 4.5 years (95% CI 3.8–5.3) older (statistically significant difference in 6/8 studies; Table 1) and were less likely to be living with a spouse (summary estimate 39.4% versus 71.2%, P<0.001; significant difference in 3/4 studies). Women also had higher prevalence of functional limitation (modified Rankin Scale >2 or Barthel≤20) before stroke (summary estimate 22.6% versus 14.0%, P<0.001; significant difference in 2/5 studies) and institutional residence than men (summary estimate 12.0% versus 4.6%, P<0.001; significant difference in 3/4 studies). In IS, more women were prescribed anti‐hypertensive agents (3/5 studies) before stroke than men. Men with IS were more often ever‐smokers (significant difference in 7/7 studies) and consumers of alcohol (significant difference in 4/6 studies; Tables S3 and S4; “IS”). Among ICH participants, women were on average 4.7 years (95% CI 2.6–6.7) older than men (significant difference in only 3/8 studies), and there was few difference in other baseline characteristics between women and men (Tables S3 and S4; “ICH”).
Table 1.
Details of 8 Included Cohorts: Baseline Data on First‐Ever Ischemic Stroke and Intracerebral Hemorrhage Stroke
| Study | Study, y | Baseline, n | Among Participants With NIHSS Data | |||||||
|---|---|---|---|---|---|---|---|---|---|---|
| n | Women (%) | Mean Age, y (SD) | Median NIHSS (IQR) | NIHSS>7, n (%) | ||||||
| Men | Women | Men | Women | Men | Women | |||||
| Ischemic stroke | (n=2603) | (n=2723) | ||||||||
| Oxford, UK28 | 2002–2013 | 1103 | 1087 | 49.4% | 72.4 (12.0)* | 77.7 (12.1)* | 3 (1–6)* | 3 (1–9)* | 112 (20.4)* | 157 (29.2)* |
| Joinville, Brazil29 | 2009–2014 | 1494 | 1494 | 47.8% | 63.5 (12.5)* | 66.8 (15.7)* | 3 (2–8)* | 4 (2–11)* | 198 (25.4)* | 253 (35.4)* |
| Melbourne, Australia30 | 1996–1999 | 921 | 744 | 52.0% | 72.4 (12.7)* | 76.3 (14.3)* | 4 (2–10) | 5 (2–12) | 112 (31.4)* | 150 (38.8)* |
| Perth, Australia31 | 2000–2001 | 140 | 123 | 50.4% | 74.0 (12.5) | 78.0 (10.1) | 5 (3–11) | 6 (3–13) | 21 (34.4) | 26 (41.9) |
| Orebro, Sweden32 | 1999–2000 | 274 | 274 | 54.4% | 73.1 (10.5)* | 77.1 (10.7)* | 4 (2–6)* | 5 (3–10)* | 28 (22.4)* | 50 (33.6)* |
| Dijon, France33 | 2006–2012 | 1238 | 1238 | 54.1% | 71.7 (15.3)* | 77.2 (15.8)* | 4 (2–9)* | 4 (2–12)* | 170 (29.9)* | 248 (37.0)* |
| Mãtao, Brazil34 | 2003–2004 | 68 | 67 | 38.8% | 65.1 (12.3) | 64.5 (12.6) | 5 (2–11)* | 8 (5–10)* | 12 (29.3) | 13 (50.0) |
| Tartu, Estonia†, 35 | 2002–2003 | 332 | 299 | 59.5% | 68.1 (10.9)* | 75.6 (10.9)* | 5 (0–14)* | 9 (2–16)* | 44 (36.4)* | 97 (54.5)* |
| Summary estimate (95% CI) | 5570 | 5326 | 51.6% | 70.0 (67.4–72.6)* | 74.5 (72.0–77.2)* | 4 (2–8) | 4 (2–11) | 27.9% (24.1–31.9%)* | 38.6% (33.8–43.6%)* | |
| Intracerebral hemorrhage | (n=400) | (n=333) | ||||||||
| Oxford, UK28 | 2002–2013 | 112 | 94 | 48.9% | 69.5 (14.3) | 73.5 (16.2) | 7 (3–15) | 7 (3–16) | 22 (45.8) | 22 (47.8) |
| Joinville, Brazil29 | 2009–2014 | 223 | 223 | 42.2% | 58.2 (15.4)* | 62.5 (15.5)* | 17 (5–27) | 17 (5–27) | 86 (66.7) | 66 (70.2) |
| Melbourne, Australia30 | 1996–1999 | 191 | 136 | 49.3% | 70.3 (13.5)* | 75.2 (15.2)* | 8 (3–20)* | 14 (5–27)* | 39 (53.4) | 47 (66.2) |
| Perth, Australia31 | 2000–2001 | 19 | 13 | 46.7% | 68.0 (18.5) | 73.5 (12.3) | 9 (3–23) | 15 (1–21) | 4 (50.0) | 5 (71.4) |
| Orebro, Sweden32 | 1999–2000 | 44 | 44 | 43.2% | 71.9 (11.5) | 75.6 (9.9) | 9 (4–12) | 10 (4–23) | 15 (60.0) | 12 (63.2) |
| Dijon, France33 | 2006–2012 | 197 | 197 | 53.3% | 71.0 (15.8)* | 76.6 (18.3)* | 9 (4–22) | 10 (4–22) | 54 (58.7) | 67 (63.8) |
| Mãtao, Brazil34 | 2003–2004 | 12 | 11 | 27.3% | 62.9 (7.0) | 68.7 (7.5) | 18 (8–25) | 32 (7–32) | 6 (75.0) | 2 (66.7) |
| Tartu, Estonia*, 35 | 2002–2003 | 57 | 55 | 50.9% | 63.6 (15.9) | 68.1 (12.6) | 20 (5–25) | 14 (7–25) | 19 (70.4) | 19 (67.9) |
| Summary estimate (95% CI) | 855 | 773 | 48.3% | 67.0 (63.7, 70.3) | 71.7 (68.5, 75.1) | 10 (4–23) | 12 (5–24) | 60.9% (55.6%, 66.2%) | 64.2% (59.3%, 68.9%) | |
denotes statistically significant results. IQR indicates interquartile range; NIHSS, National Institutes of Health Stroke Scale.
Stroke severity in Tartu study was mapped from Scandinavian Stroke Scale to NIHSS (see Methods, page 7).
Distribution of the NIHSS by sex among those with either IS or ICH was illustrated in Figure 1 (n=6099; 8 studies) and Figure S1 (for each study).
Figure 1.
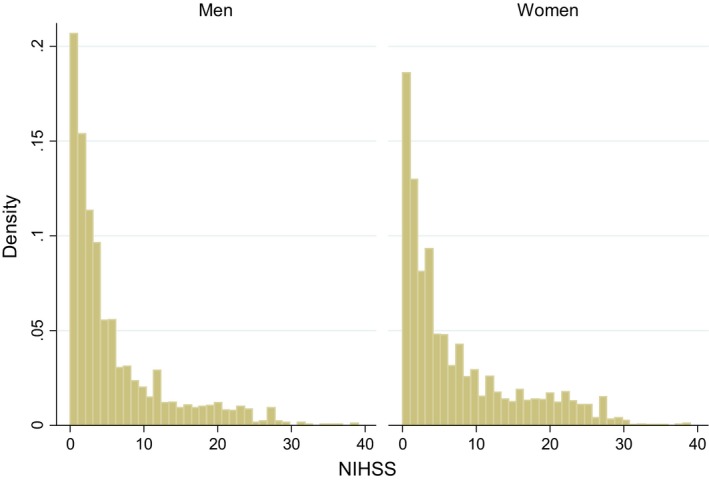
Distribution of the National Institutes of Health Stroke Scale scores by sex among those with stroke (both ischemic and intracerebral hemorrhagic stroke; n=6099). NIHSS indicates National Institutes of Health Stroke Scale.
Analyses of initial NIHSS scores among 8 studies included 5200/5326 participants with IS (Table 2; 2% of cases were excluded because of missing data on covariates). In unadjusted analyses, women with IS were 35% (pooled RR 1.35, 95% CI 1.24–1.46) more likely to suffer more severe strokes than men; study‐specific crude RRs varied from 1.20 (Perth) to 1.71 (Mãtao; Figure 2, top). We found no statistical evidence of heterogeneity in unadjusted RR estimates (I2=0%; Q=4.4, P=0.732) across the studies. In multivariable analysis, adjustment for age alone reduced the sex difference in severity by 36% (pooled RRage‐adjusted 1.21, 95% CI 1.11–1.31) with non‐statistically significant heterogeneity (I2=0%; Q=4.9, P=0.670). After further accounting for AF and pre‐stroke dependency, the pooled estimate was substantially attenuated but remained statistically significant (pooled RRfully‐adjusted 1.20, 95% CI 1.10–1.30). Although study‐specific adjusted RRs of the association between sex and severity of IS varied from 1.09 (Dijon) to 1.70 (Mãtao), there was no statistically significant heterogeneity between studies (I2=0%; Q=4.5, P=0.719; Figure 2, bottom). Factors that met all criteria for being a confounder were inconsistent between studies (Table 2). Among IS, these confounding factors were age (6/8 studies, pre‐stroke dependency (5/6 studies), atrial fibrillation (2/8 studies). Transformation of continuous covariates using fractional polynomials in multivariable modeling was not required. None of these factors modified the effect of sex on stroke severity (ie, all sex×covariate or covariate×covariate interactions were non‐significant). There was also no evidence that IS subtype (TOAST; Table S5), or any of the other covariates (eg, socioeconomic position, education, pre‐stroke medications, alcohol use, and other comorbidities such as diabetes mellitus and hypertension) contributed to the sex difference in NIHSS (Table S6).
Table 2.
List of Factors Contributing to the Difference in Stroke Severity Between Women and Men in Multivariable Models by Stroke Type (more severe stroke was defined as National Institutes of Health Stroke Scale >7)
| Study | Ischemic Stroke | Intracerebral Hemorrhage | ||
|---|---|---|---|---|
| n* | Covariates in the Fully Adjusted Model | n* | Covariate in the Fully Adjusted Model | |
| Oxford28 | 1077 | Age (y), pre‐stroke mRS, AF | 94 | Age† |
| Joinville‡, 29 | 1494 | Age, AF† | 223 | Age† |
| Melbourne30 | 647 | Age, pre‐stroke Barthel, AF† | 136 | Age† |
| Perth31 | 123 | Age, pre‐stroke mRS†, AF† | 13 | Age† |
| Orebro32 | 274 | Age†, pre‐stroke institutional residence, AF | 44 | Age† |
| Dijon33 | 1238 | Age, pre‐stroke institutional residence, AF† | 197 | Age† |
| Mãtao34, ‡ | 67 | Age†, AF† | 11 | Age† |
| Tartu35 | 280 | Age, pre‐stroke mRS, AF† | 55 | Age† |
| Pooled | 5200 | 773 | ||
AF indicates atrial fibrillation; mRS, modified Rankin Scale.
The sample size were the same among the unadjusted model and fully‐adjusted model.
Age, the presence of AF, and pre‐stroke function (mRS, Barthel, or institutional residence when possible) were selected to be forced into all the final fully adjusted models regardless of meeting our criteria of being a confounder (associated with NIHSS; associated with sex, and changed the magnitude of the sex coefficient by ≥10%; see Methods, page 8).
Data on pre‐stroke dependency were unavailable.
Figure 2.

Difference in stroke severity between women and men with ischemic stroke: unadjusted (top) and adjusted (bottom) random‐effects meta‐analyses. More severe stroke was defined as National Institutes of Health Stroke Scale >7. Both unadjusted and adjusted effect estimates using fixed‐effects meta‐analysis were the same compared with those with random‐effects approach. RR indicates relative risk.
Analyses of 855/773 participants with ICH (Table 2; 10% of cases were excluded because of missing data on confounding factors) found no sex difference in the severity of stroke (pooled RRunadjusted 1.08, 95% CI 0.97–1.21; Figure 3, top) without a statistical heterogeneity (I2=0%; Q=2.1, P=0.957). There was no effect of adjusting for age with the age‐adjusted pooled RR being 1.08, 95% CI 0.96–1.20 (Figure 3, bottom; I2=0%; Q=1.4, P=0.985) or any other covariates.
Figure 3.
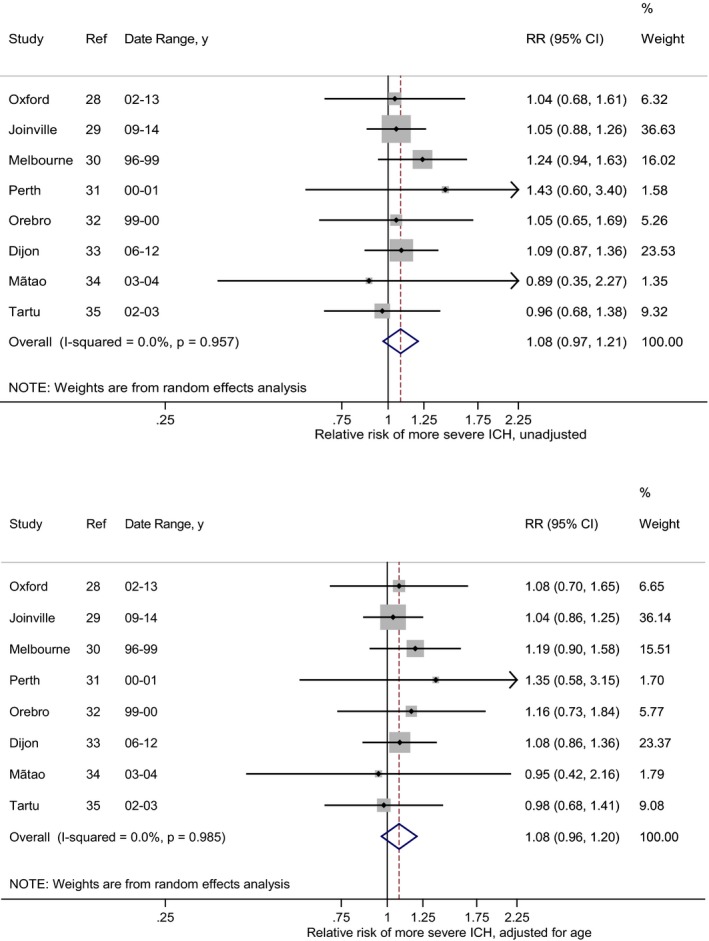
Difference in stroke severity between women and men with intracerebral hemorrhage (ICH) in unadjusted (top) and adjusted (bottom) random‐effect meta‐analyses. More severe stroke was defined as National Institutes of Health Stroke Scale >7. Both unadjusted and adjusted effect estimates using fixed‐effects meta‐analysis were the same compared with those with random‐effects approach. ICH indicates intracerebral hemorrhage; RR, relative risk.
We found no evidence of differences in the pooled unadjusted or adjusted estimates between random‐effects and fixed‐effects meta‐analyses, suggesting our results were robust. Meta‐regression did not identify any sources of the heterogeneity between studies. Neither study‐level factors including geographic region, the availability of pre‐stroke function (Table S7), nor the proportion of women modified the sex differences in either unadjusted (IS: Pmeta‐regression=0.559; ICH: Pmeta‐regression=0.726) or adjusted analyses (Pmeta‐regression=0.403; ICH: Pmeta‐regression=0.723). Removing 2 studies without data on pre‐stroke function (Figures S2 and S3) did not greatly influence the pooled estimates compared with the main results (8 studies; Figures 2 and 3) in either unadjusted (IS: pooled RRunadjusted 1.30 versus 8 studies 1.35; ICH 1.12 versus 8 studies 1.08) or adjusted analyses (IS: RRadjusted 1.15 versus 8 studies 1.20; ICH: RRunadjusted 1.12 versus 8 studies 1.08).
Sensitivity Analyses
Sensitivity analyses using NIHSS as a continuous variable showed consistent results to dichotomous analyses (Table S8).
Our pooled estimates using the single‐stage method of meta‐analysis were generally similar (8 studies; IS: RRunadjusted 1.35, 95% CI 1.23–1.49; RRfully‐adjusted 1.19, 95% CI 1.08–1.32; ICH: RRunadjusted 1.08, 95% CI 0.90–1.29; RRage‐adjusted 1.08, 95% CI 0.90–1.29) to our main findings using the 2‐stage method (IS: Figure 2; ICH: Figure 3). Analyses of IS among a subset of 6 studies with pre‐stroke function data reassured that our effect estimates did not greatly differ between these 2 approaches (1‐stage RRunadjusted 1.33, 95% CI 1.18–1.49; RRfully‐adjusted 1.15, 95% CI 1.03–1.30 versus 2‐stage RRunadjusted 1.30, 95% CI 1.18–1.44; RRfully‐adjusted 1.15, 95% CI 1.04–1.27; Table S7).
In the single pooled data set, we found no statistically significant interactions either between sex and each covariate, or between covariates in multivariable models. The effect of age as a confounding factor was similar (IS: pooled RRunadjusted 1.34, 95% CI 1.22–1.49; RRage‐adjusted 1.21, 95% CI 1.10–1.34; ICH: pooled RRunadjusted 1.08, 95% CI 0.90–1.29; RRage‐adjusted 1.08, 95% CI 0.90–1.29; Table S9) to the one using the aforementioned 2‐stage approach. There were no evidence of statistical interactions assessed by a test of statistical significance of a sex×age (continuous) product term (IS: P interaction=0.793; ICH: P interaction=0.324). The magnitude of the sex differences in severity among those with IS and ICH was neither modified by age group (Table S9) and other covariates. Neither did the year of stroke occurrence modify the sex differences in stroke severity in both unadjusted (IS: P interaction=0.067; ICH: P interaction=0.128) and age‐adjusted analyses (IS: P interaction=0.264; ICH: P interaction=0.281).
Discussion
We found that women with IS faced a 35% greater risk of severe stroke than men, and that much of this difference was explained by pre‐stroke factors including: women's older age, the presence of functional limitations before stroke and atrial fibrillation. However, adjustment for these factors did not fully explain the sex difference and their effects were often inconsistent between studies. We also found that there was no sex difference in severity of ICH.
Because of the more advanced age at stroke onset in women than men, age was the most important confounding factor of the association between sex and severity of IS, accounting for 36% of the sex difference. Older age may be associated with more severe strokes because of reduced functional capacity of supporting brain cells, ie, endothelial cells, and astrocytes after neurological insults.36 The physiological decrease of cerebral blood flow and its regulation that occurs with increasing age37 potentially influence neuronal damage after stroke in the elderly. As a consequence, impaired brain circulation and subsequent neurological dysfunction might lead to more severe strokes and less recovery in older adults with stroke. A better understanding of the pathophysiology of both stroke and cognitive function in the elderly may have important implications for clinical management and preventative strategies. Strategies such as enhancing geriatric care may help to reduce the poor outcome of chronic diseases38 including stroke among frail older community‐dwelling adults.39
Pre‐stroke function was an important confounding factor of the sex differences in stroke severity in several (5/6) studies. The association between more severe stroke in women and their poorer functional limitation before stroke has been shown to be correlated with age and several cardiovascular comorbidities (eg, AF, hypertension, diabetes mellitus) at baseline.14, 40 Poor physical function and interrelated conditions such as frailty, which is more common in women,41 may reflect underlying biologic mechanisms, including chronic inflammation, that play an important role in the pathogenesis of IS and the severity of brain tissue damage.42 Better management of comorbid diseases and prevention of frailty in the elderly43 could help ameliorate the effects of more severe strokes when they occur in women.13 It is also possible that poor pre‐stroke function and the presence of frailty may affect the accurate measurement of items in the NIHSS, as reported by others.44 Combining clinical, imaging, and biomarker data of the severity of stroke may provide a better assessment of severity than a single instrument like the NIHSS.45
Atrial fibrillation (AF) contributed to the sex difference in severity of IS although surprisingly this was only statistically significant in 2 out of 8 studies (Oxford and Orebro). The inconsistent findings may be attributable to the variations in the data collection and definition of AF between studies (Table S2). One reason for more severe strokes in women is that women with AF more often have cardioembolic strokes than men.46 In addition, previous studies have found that the management of AF, specifically, treatment with anti‐coagulants47 or catheter ablation48 appear to be suboptimal for women compared with men. It is thus possible that our observed confounding effect of AF on stroke severity could reflect the widespread under‐treatment of AF in older patients.49 However, we cannot confirm this possibility as treatments for AF were missing from our data set. This highlights the need for the better detection and treatment of AF in both older men and women before stroke occurrence.50
Age, AF, and pre‐stroke function combined only accounted for 39% of the sex difference in severity of IS (with RR reduced from 1.35 to 1.20). Other unmeasured or poorly measured confounding factors could explain the remaining difference. However, it is also possible that a true biological or pathophysiological sex difference does exist. Further research is needed to explore potential biological and clinical mechanisms that could lead to a greater stroke severity in women. Potential dimorphic differences between men and women in severity of stroke include biologic (eg, hormone‐dependent) and intrinsic (non‐hormonal) factors (eg, sex chromosomes).51 Research on biologic mechanisms has established the neuroprotective effect of hormones in women on IS injury during premenopause.51 Little is known about how the decline of sex steroid hormones in women after menopause and ovariectomy influences the sex disparities in post‐stroke neurologic deficits. Further examination of the sex differences in neurologic function, specifically injury response and recovery after stroke with regard to different age groups, are needed. Infarct size and location of stroke appear to influence the level of neurologic deficits and eventual stroke outcomes eg, left‐hemispheric ischemic strokes are more frequent and often have higher admission NIHSS scores as well as poorer survival than right‐hemispheric counterparts.52 However, few authors have attempted to unravel the relative role of these factors in the severity differences across the different patient groups including men and women, or young and older people. Recent advanced brain imaging undertaken to investigate neurological deficits among people with different stroke types may offer better opportunities to understand the sex and age differences in brain injury.53 Also, female members are often excluded in the neuroscience experiments because of the hormonal fluctuations associated with the reproductive cycle.54 A recent meta‐analysis of neuroscience studies has shown that data from female rats are no more variable than data from males.55 This suggests a need to include females in animal models to understand the sex difference in severity of stroke.56
The sex differences in stroke severity existed for IS but not ICH. In our analyses, age, pre‐stroke function, and AF were contributing factors to more severe strokes in women. By contrast, there were no evidence of the confounding effects in the ICH group (the unadjusted and adjusted estimates were the same). The reasons for this difference is unclear. It may be related to the differences in the underlying mechanisms between these 2 types of stroke.57 Further research is warranted to examine the uncertainty over the sex differences in stroke severity among women and men with ICH. Our study has a number of strengths. To our knowledge, we have provided the first pooled estimates of sex differences in stroke severity, separately for IS and ICH. We compiled the IPD from 8 population‐based studies from various regions of the world. The use of 2‐stage method for meta‐analysis of IPD allowed us to overcome some of the limitations that result from not all potential confounding factors being measured across all studies.22 The data came from high‐quality population‐based studies free of the limitations of hospital‐based or convenience samples and had a large sample, making this study adequately powered to test our hypotheses.
However, limitations need to be acknowledged. The population‐based studies in our research networks are mostly from high‐income countries (7/8 studies), potentially leading to less generalizable results. We were unable to include 5 studies because NIHSS data were not available (Table S1) thereby reducing the statistical power. The methods and sources of data collection differed across cohorts, and this may have contributed to the differing confounding variables identified between studies. In particular, our inability to detect whether IS subtypes confounded the association between sex and severity is likely attributable to the scarce data on IS subtypes (TOAST classification) which were only collected in 4 studies. Further research is needed to explore the role of the mechanism of IS on the sex difference in severity of stroke. There was a lack of data on subdomain scores of NIHSS, another potential contributor to the sex difference in severity of stroke. Although the rate of missing data on NIHSS and covariates (<10%) was low enough that imputation of missing data was not required, we could not eliminate the possibility of some selection bias. Finally, the number of studies forming our pooled estimates was less than required (≥10) for the exploration of heterogeneity between studies using meta‐regression.58
Conclusion
In clinical practice, women are more likely to present with severe IS than men but the difference is partly explained by their advanced age, greater pre‐stroke functional limitation and presence of AF. Given these findings, strategies to improve pre‐stroke health and access to evidence‐based care for the elderly could help reduce differences in stroke severity between men and women. In addition, understanding the origin of more severe strokes in women compared with men should be a priority area for further research, more studies that attempt to identify other potential explanatory factors such as IS stroke mechanism, treatment of AF, and other comorbidities are needed.
Author Contributions
All authors satisfying the 4 criteria for authorship recommended by International Committee of Medical Journal Editors, as specified: Substantial contributions to the conception or design of the work (Dr Phan, Dr Gall, Dr Reeves, Dr Blizzard, Dr Thrift, Dr Cadilhac, Dr Heeley, Dr Sturm, and Mr Otahal) and the acquisition, analysis, or interpretation of data for the work (all authors); drafting the work or revising it critically for important intellectual content (all authors); final approval of the version to be published (all authors); agreement to be accountable for all aspects of the work in ensuring that questions related to the accuracy or integrity of any part of the work are appropriately investigated and resolved (all authors).
Sources of Funding
Chief investigators for each of the studies provided their data at no cost. Phan is supported by a Merle Weaver Postgraduate Scholarship (University of Tasmania). Gall is supported by a National Heart Foundation of Australia Future Leader Fellowship (FLF 100446). Reeves was supported by a Menzies Institute Visiting Scholars Program (Tasmania, Australia). The following authors received research fellowship funding from the National Health and Medical Research Council (NHMRC): Thrift (1042600), Cadilhac (co‐funded Heart Foundation: 1063761) and CA (1081356). The NHMRC also provided support for the study conducted in Melbourne (154600, 307900), as did VicHealth and the Stroke Foundation (Australia). The Brazilian National Council for Scientific and Technological Development (CNPq) funded the research conducted in Joinville (grant number 402396/2013‐8). The Dijon Stroke Registry is supported by InVS and INSERM. The Oxford Vascular Study is funded by the Wellcome Trust, Stroke Association, and the National Institute of Health Research Biomedical Research Centre, Oxford.
Disclosures
None.
Supporting information
Data S1. Supplemental Methods.
Data S2. Measurement of potential confounding factors of sex difference in NIHSS of stroke at acute stroke
Table S1. Eligible “ideal” population‐based studies of stroke with long‐term outcome data available through systematic search
Table S2. Data collection methods of study factors across 8 studies
Table S3. Characteristics of included cohort studies by sex among patients with NIHSS data, for studies conducted in Oxford, Joinville, Melbourne, and Perth
Table S4. Characteristics of included cohort studies by sex among patients with NIHSS data, for studies conducted in Orebro, Dijon, Mãtao, and Tartu
Table S5. Severity of ischemic stroke by subtype among women and men
Table S6. List of covariates not meeting the criteria for confounding factors of sex difference in severity (NIHSS) of ischemic stroke
Table S7. Analyses of heterogeneity in the sex differences in stroke severity (NIHSS>7) among 8 population‐based studies
Table S8. Testing the interactions between sex and 2 covariates: age and time period using a single pooled individual participant data set in stroke severity
Table S9. Sensitivity analyses of difference in National Institutes of Health Stroke Scale (NIHSS) continuous scores between women and men
Figure S1. Distribution of the National Institutes of Health Stroke Scale (NIHSS) scores by sex among those with stroke (both ischemic and intracerebral hemorrhagic stroke) in each study.
Figure S2. Difference in stroke severity between women and men with ischemic stroke: unadjusted (top) and adjusted (bottom) random‐effects meta‐analyses among 6 studies.
Figure S3. Difference in stroke severity between women and men with intracerebral hemorrhage (ICH): unadjusted (top) and adjusted (bottom) random‐effects meta‐analyses among 6 studies.
(J Am Heart Assoc. 2019;8:e010235 DOI: 10.1161/JAHA.118.010235.)
References
- 1. Phan HT, Blizzard CL, Reeves MJ, Thrift AG, Cadilhac D, Sturm J, Heeley E, Otahal P, Konstantinos V, Anderson C, Parmar P, Krishnamurthi R, Barker‐Collo S, Feigin V, Bejot Y, Cabral NL, Carolei A, Sacco S, Chausson N, Olindo S, Rothwell P, Silva C, Correia M, Magalhaes R, Appelros P, Korv J, Vibo R, Minelli C, Gall S. Sex differences in long‐term mortality after stroke in the INSTRUCT (INternational STRoke oUtComes sTudy): a meta‐analysis of individual participant data. Circ Cardiovasc Qual Outcomes. 2017;10:e003436. [DOI] [PubMed] [Google Scholar]
- 2. Phan HT, Blizzard CL, Reeves MJ, Thrift AG, Cadilhac DA, Sturm J, Heeley E, Otahal P, Vemmos K, Anderson C, Parmar P, Krishnamurthi R, Barker‐Collo S, Feigin V, Bejot Y, Cabral NL, Carolei A, Sacco S, Chausson N, Olindo S, Rothwell P, Silva C, Correia M, Magalhães R, Appelros P, Kõrv J, Vibo R, Minelli C, Gall SL. Factors contributing to sex differences in functional outcomes and participation after stroke. Neurology. 2018;90:e1945–e1953. [DOI] [PubMed] [Google Scholar]
- 3. Reeves MJ, Bushnell CD, Howard G, Gargano JW, Duncan PW, Lynch G, Khatiwoda A, Lisabeth L. Sex differences in stroke: epidemiology, clinical presentation, medical care, and outcomes. Lancet Neurol. 2008;7:915–926. [DOI] [PMC free article] [PubMed] [Google Scholar]
- 4. Bushnell CD, Reeves MJ, Zhao X, Pan W, Prvu‐Bettger J, Zimmer L, Olson D, Peterson E. Sex differences in quality of life after ischemic stroke. Neurology. 2014;82:922–931. [DOI] [PMC free article] [PubMed] [Google Scholar]
- 5. Wang Z, Li J, Wang C, Yao X, Zhao X, Wang Y, Li H, Liu G, Wang A, Wang Y. Gender differences in 1‐year clinical characteristics and outcomes after stroke: results from the China National Stroke Registry. PLoS One. 2013;8:e56459. [DOI] [PMC free article] [PubMed] [Google Scholar]
- 6. Dehlendorff C, Andersen KK, Olsen TS. Sex disparities in stroke: women have more severe strokes but better survival than men. J Am Heart Assoc. 2015;4:e001967 DOI: 10.1161/JAHA.115.001967. [DOI] [PMC free article] [PubMed] [Google Scholar]
- 7. Zhou J, Zhang Y, Arima H, Zhao Y, Zhao H, Zheng D, Tian Y, Liu Y, Huang Q, Yang J; for the Nanjing First Hospital Stroke Registry I . Sex differences in clinical characteristics and outcomes after intracerebral haemorrhage: results from a 12‐month prospective stroke registry in Nanjing, China. BMC Neurol. 2014;14:172. [DOI] [PMC free article] [PubMed] [Google Scholar]
- 8. Salihovic D, Smajlovic D, Sinanovic O, Kojic B. Sex differences in patients with acute ischemic stroke in Tuzla region, Bosnia and Herzegovina. Bosn J Basic Med Sci. 2010;10:116–120. [DOI] [PMC free article] [PubMed] [Google Scholar]
- 9. Faraji F, Ghasami K, Talaie‐Zanjani A, Mohammadbeigi A. Prognostic factors in acute stroke, regarding to stroke severity by Canadian Neurological Stroke Scale: a hospital‐based study. Asian J Neurosurg. 2013;8:78–82. [DOI] [PMC free article] [PubMed] [Google Scholar]
- 10. Kakar P, Boos CJ, Lip GYH. Management of atrial fibrillation. Vasc Health Risk Manag. 2007;3:109–116. [PMC free article] [PubMed] [Google Scholar]
- 11. Appelros P, Nydevik I, Seiger A, Terent A. Predictors of severe stroke: influence of preexisting dementia and cardiac disorders. Stroke. 2002;33:2357–2362. [DOI] [PubMed] [Google Scholar]
- 12. Arboix A, Alió J. Cardioembolic stroke: clinical features, specific cardiac disorders and prognosis. Curr Cardiol Rev. 2010;6:150–161. [DOI] [PMC free article] [PubMed] [Google Scholar]
- 13. Gall SL, Donnan G, Dewey HM, Macdonell R, Sturm J, Gilligan A, Srikanth V, Thrift AG. Sex differences in presentation, severity, and management of stroke in a population‐based study. Neurology. 2010;74:975–981. [DOI] [PubMed] [Google Scholar]
- 14. Renoux C, Coulombe J, Li L, Ganesh A, Silver L, Rothwell PM. Confounding by pre‐morbid functional status in studies of apparent sex differences in severity and outcome of stroke. Stroke. 2017;48:2731–2738. [DOI] [PMC free article] [PubMed] [Google Scholar]
- 15. Park JM, Kang K, Cho YJ, Hong KS, Lee KB, Park TH, Lee SJ, Ko Y, Han MK, Lee J, Cha JK, Kim DH, Kim DE, Kim JT, Choi JC, Yu KH, Lee BC, Lee JS, Lee J, Gorelick PB, Bae HJ. Comparative effectiveness of prestroke aspirin on stroke severity and outcome. Ann Neurol. 2016;79:560–568. [DOI] [PMC free article] [PubMed] [Google Scholar]
- 16. Oh MS, Yu KH, Roh JK, Lee BC. Gender differences in the mortality and outcome of stroke patients in Korea. Cerebrovasc Dis. 2009;28:427–434. [DOI] [PubMed] [Google Scholar]
- 17. Bill O, Zufferey P, Faouzi M, Michel P. Severe stroke: patient profile and predictors of favorable outcome. J Thromb Haemost. 2013;11:92–99. [DOI] [PubMed] [Google Scholar]
- 18. Phan H, Blizzard L, Thrift A, Cadilhac D, Reeves M, Sturm J, Gall S. Sex difference in long‐term outcomes of stroke in the INternational STroke oUtComes sTudy (INSTRUCT): a meta‐analysis of individual patient data. PROSPERO 2016:CRD42016036723. York, United Kingdom: Centre for Reviews and Dissemination, University of York; 2016. Available at: http://www.crd.york.ac.uk/PROSPERO/display_record.asp?ID=CRD42016036723. Accessed September 12, 2016. [Google Scholar]
- 19. Stewart LA, Clarke M, Rovers M, Riley RD, Simmonds M, Stewart G, Tierney JF. Preferred reporting items for systematic review and meta‐analyses of individual participant data: the PRISMA‐IPD statement. JAMA. 2015;313:1657–1665. [DOI] [PubMed] [Google Scholar]
- 20. Ali K, Cheek E, Sills S, Crome P, Roffe C. Development of a conversion factor to facilitate comparison of National Institute of Health Stroke Scale scores with Scandinavian Stroke Scale scores. Cerebrovasc Dis. 2007;24:509–515. [DOI] [PubMed] [Google Scholar]
- 21. Adams HP Jr, Bendixen BH, Kappelle LJ, Biller J, Love BB, Gordon DL, Marsh EE III. Classification of subtype of acute ischemic stroke. Definitions for use in a multicenter clinical trial. TOAST. Trial of Org 10172 in Acute Stroke Treatment. Stroke. 1993;24:35–41. [DOI] [PubMed] [Google Scholar]
- 22. Stukel TA, Demidenko E, Dykes J, Karagas MR. Two‐stage methods for the analysis of pooled data. Stat Med. 2001;20:2115–2130. [DOI] [PubMed] [Google Scholar]
- 23. Greenland S. Modeling and variable selection in epidemiologic analysis. Am J Public Health. 1989;79:340–349. [DOI] [PMC free article] [PubMed] [Google Scholar]
- 24. Gall SL, Tran PL, Martin K, Blizzard L, Srikanth V. Sex differences in long‐term outcomes after stroke: functional outcomes, handicap, and quality of life. Stroke. 2012;43:1982–1987. [DOI] [PubMed] [Google Scholar]
- 25. Royston P, Ambler G, Sauerbrei W. The use of fractional polynomials to model continuous risk variables in epidemiology. Int J Epidemiol. 1999;28:964–974. [DOI] [PubMed] [Google Scholar]
- 26. Stewart GB, Altman DG, Askie LM, Duley L, Simmonds MC, Stewart LA. Statistical analysis of individual participant data meta‐analyses: a comparison of methods and recommendations for practice. PLoS One. 2012;7:e46042. [DOI] [PMC free article] [PubMed] [Google Scholar]
- 27. White IR, Royston P, Wood AM. Multiple imputation using chained equations: Issues and guidance for practice. Stat Med. 2011;30:377–399. [DOI] [PubMed] [Google Scholar]
- 28. Rothwell PM, Coull AJ, Giles MF, Howard SC, Silver LE, Bull LM, Gutnikov SA, Edwards P, Mant D, Sackley CM, Farmer A, Sandercock PA, Dennis MS, Warlow CP, Bamford JM, Anslow P. Change in stroke incidence, mortality, case‐fatality, severity, and risk factors in Oxfordshire, UK from 1981 to 2004 (Oxford Vascular Study). Lancet. 2004;363:1925–1933. [DOI] [PubMed] [Google Scholar]
- 29. Cabral NL, Goncalves AR, Longo AL, Moro CH, Costa G, Amaral CH, Fonseca LA, Eluf‐Neto J. Incidence of stroke subtypes, prognosis and prevalence of risk factors in Joinville, Brazil: a 2 year community based study. J Neurol Neurosurg Psychiatry. 2009;80:755–761. [DOI] [PubMed] [Google Scholar]
- 30. Sturm JW, Donnan GA, Dewey HM, Macdonell RA, Gilligan AK, Thrift AG. Determinants of handicap after stroke: the North East Melbourne Stroke Incidence Study (NEMESIS). Stroke. 2004;35:715–720. [DOI] [PubMed] [Google Scholar]
- 31. Anderson CS, Jamrozik KD, Broadhurst RJ, Stewart‐Wynne EG. Predicting survival for 1 year among different subtypes of stroke. Results from the Perth Community Stroke Study. Stroke. 1994;25:1935–1944. [DOI] [PubMed] [Google Scholar]
- 32. Appelros P, Nydevik I, Seiger A, Terent A. High incidence rates of stroke in Orebro, Sweden: further support for regional incidence differences within Scandinavia. Cerebrovasc Dis. 2002;14:161–168. [DOI] [PubMed] [Google Scholar]
- 33. Bejot Y, Catteau A, Caillier M, Rouaud O, Durier J, Marie C, Di Carlo A, Osseby GV, Moreau T, Giroud M. Trends in incidence, risk factors, and survival in symptomatic lacunar stroke in Dijon, France, from 1989 to 2006: a population‐based study. Stroke. 2008;39:1945–1951. [DOI] [PubMed] [Google Scholar]
- 34. Minelli C, Fen LF, Minelli DP. Stroke incidence, prognosis, 30‐day, and 1‐year case fatality rates in Matao, Brazil: a population‐based prospective study. Stroke. 2007;38:2906–2911. [DOI] [PubMed] [Google Scholar]
- 35. Korv J, Roose M, Kaasik A‐E. Stroke registry of Tartu, Estonia, from 1991 through 1993. Cerebrovasc Dis. 1997;7:154–162. [Google Scholar]
- 36. Sohrabji F, Bake S, Lewis DK. Age‐related changes in brain support cells: implications for stroke severity. Neurochem Int. 2013;63:291–301. [DOI] [PMC free article] [PubMed] [Google Scholar]
- 37. Strandgaard S. Cerebral blood flow in the elderly: impact of hypertension and antihypertensive treatment. Cardiovasc Drugs Ther. 1991;4(Suppl 6):1217–1221. [DOI] [PubMed] [Google Scholar]
- 38. Gur AY, Tanne D, Bornstein NM, Milo R, Auriel E, Shopin L, Koton S. Stroke in the very elderly: characteristics and outcome in patients aged >/=85 years with a first‐ever ischemic stroke. Neuroepidemiology. 2012;39:57–62. [DOI] [PubMed] [Google Scholar]
- 39. Golden AG, Tewary S, Dang S, Roos BA. Care management's challenges and opportunities to reduce the rapid rehospitalization of frail community‐dwelling older adults. Gerontologist. 2010;50:451–458. [DOI] [PubMed] [Google Scholar]
- 40. Di Legge S, Koch G, Diomedi M, Stanzione P, Sallustio F. Stroke prevention: managing modifiable risk factors. Stroke Res Treat. 2012;2012:391538. [DOI] [PMC free article] [PubMed] [Google Scholar]
- 41. Fried LP, Tangen CM, Walston J, Newman AB, Hirsch C, Gottdiener J, Seeman T, Tracy R, Kop WJ, Burke G, McBurnie MA. Frailty in older adults: evidence for a phenotype. J Gerontol A Biol Sci Med Sci. 2001;56:M146–M156. [DOI] [PubMed] [Google Scholar]
- 42. Jin R, Yang G, Li G. Inflammatory mechanisms in ischemic stroke: role of inflammatory cells. J Leukoc Biol. 2010;87:779–789. [DOI] [PMC free article] [PubMed] [Google Scholar]
- 43. Morley JE, Vellas B, van Kan GA, Anker SD, Bauer JM, Bernabei R, Cesari M, Chumlea WC, Doehner W, Evans J, Fried LP, Guralnik JM, Katz PR, Malmstrom TK, McCarter RJ, Gutierrez Robledo LM, Rockwood K, von Haehling S, Vandewoude MF, Walston J. Frailty consensus: a call to action. J Am Med Dir Assoc. 2013;14:392–397. [DOI] [PMC free article] [PubMed] [Google Scholar]
- 44. Abdul‐Rahim AH, Fulton RL, Sucharew H, Kleindorfer D, Khatri P, Broderick JP, Lees KR. National Institutes of Health Stroke Scale item profiles as predictor of patient outcome. Stroke. 2015;46:395. [DOI] [PubMed] [Google Scholar]
- 45. Barbieri A, Giuliani E, Carone C, Pederzoli F, Mascheroni G, Greco G, Stucchi C, Genedani S. Clinical severity of ischemic stroke and neural damage biomarkers in the acute setting: the STROke MArkers (STROMA) study. Minerva Anestesiol. 2013;79:750–757. [PubMed] [Google Scholar]
- 46. Wagstaff AJ, Overvad TF, Lip GY, Lane DA. Is female sex a risk factor for stroke and thromboembolism in patients with atrial fibrillation? A systematic review and meta‐analysis QJM. 2014;107:955–967. [DOI] [PubMed] [Google Scholar]
- 47. Gage BF, Boechler M, Doggette AL, Fortune G, Flaker GC, Rich MW, Radford MJ. Adverse outcomes and predictors of underuse of antithrombotic therapy in medicare beneficiaries with chronic atrial fibrillation. Stroke. 2000;31:822–827. [DOI] [PubMed] [Google Scholar]
- 48. Patel D, Mohanty P, Di Biase L, Sanchez JE, Shaheen MH, Burkhardt JD, Bassouni M, Cummings J, Wang Y, Lewis WR, Diaz A, Horton RP, Beheiry S, Hongo R, Gallinghouse GJ, Zagrodzky JD, Bailey SM, Al‐Ahmad A, Wang P, Schweikert RA, Natale A. Outcomes and complications of catheter ablation for atrial fibrillation in females. Heart Rhythm. 2010;7:167–172. [DOI] [PubMed] [Google Scholar]
- 49. Yiin GS, Howard DP, Paul NL, Li L, Luengo‐Fernandez R, Bull LM, Welch SJ, Gutnikov SA, Mehta Z, Rothwell PM. Age‐specific incidence, outcome, cost, and projected future burden of atrial fibrillation‐related embolic vascular events: a population‐based study. Circulation. 2014;130:1236–1244. [DOI] [PMC free article] [PubMed] [Google Scholar]
- 50. Desai Y, El‐Chami MF, Leon AR, Merchant FM. Management of atrial fibrillation in elderly adults. J Am Geriatr Soc. 2017;65:185–193. [DOI] [PubMed] [Google Scholar]
- 51. Gibson CL. Cerebral ischemic stroke: is gender important? J Cereb Blood Flow Metab. 2013;33:1355–1361. [DOI] [PMC free article] [PubMed] [Google Scholar]
- 52. Hedna VS, Bodhit AN, Ansari S, Falchook AD, Stead L, Heilman KM, Waters MF. Hemispheric differences in ischemic stroke: is left‐hemisphere stroke more common? J Clin Neurol. 2013;9:97–102. [DOI] [PMC free article] [PubMed] [Google Scholar]
- 53. Etherton MR, Wu O, Cougo P, Giese AK, Cloonan L, Fitzpatrick KM, Kanakis AS, Boulouis G, Karadeli HH, Lauer A, Rosand J, Furie KL, Rost NS. Structural integrity of normal appearing white matter and sex‐specific outcomes after acute ischemic stroke. Stroke. 2017;48:3387–3389. [DOI] [PMC free article] [PubMed] [Google Scholar]
- 54. Beery AK, Zucker I. Sex bias in neuroscience and biomedical research. Neurosci Biobehav Rev. 2011;35:565–572. [DOI] [PMC free article] [PubMed] [Google Scholar]
- 55. Becker JB, Prendergast BJ, Liang JW. Female rats are not more variable than male rats: a meta‐analysis of neuroscience studies. Biol Sex Differ. 2016;7:34. [DOI] [PMC free article] [PubMed] [Google Scholar]
- 56. McCullough LD, de Vries GJ, Miller VM, Becker JB, Sandberg K, McCarthy MM. NIH initiative to balance sex of animals in preclinical studies: generative questions to guide policy, implementation, and metrics. Biol Sex Differ. 2014;5:15. [DOI] [PMC free article] [PubMed] [Google Scholar]
- 57. An SJ, Kim TJ, Yoon BW. Epidemiology, risk factors, and clinical features of intracerebral hemorrhage: an update. J Stroke. 2017;19:3–10. [DOI] [PMC free article] [PubMed] [Google Scholar]
- 58. Green S, Higgins J. Cochrane handbook for systematic reviews of interventions version 5.1.0. The Cochrane Collaboration; 2011.
Associated Data
This section collects any data citations, data availability statements, or supplementary materials included in this article.
Supplementary Materials
Data S1. Supplemental Methods.
Data S2. Measurement of potential confounding factors of sex difference in NIHSS of stroke at acute stroke
Table S1. Eligible “ideal” population‐based studies of stroke with long‐term outcome data available through systematic search
Table S2. Data collection methods of study factors across 8 studies
Table S3. Characteristics of included cohort studies by sex among patients with NIHSS data, for studies conducted in Oxford, Joinville, Melbourne, and Perth
Table S4. Characteristics of included cohort studies by sex among patients with NIHSS data, for studies conducted in Orebro, Dijon, Mãtao, and Tartu
Table S5. Severity of ischemic stroke by subtype among women and men
Table S6. List of covariates not meeting the criteria for confounding factors of sex difference in severity (NIHSS) of ischemic stroke
Table S7. Analyses of heterogeneity in the sex differences in stroke severity (NIHSS>7) among 8 population‐based studies
Table S8. Testing the interactions between sex and 2 covariates: age and time period using a single pooled individual participant data set in stroke severity
Table S9. Sensitivity analyses of difference in National Institutes of Health Stroke Scale (NIHSS) continuous scores between women and men
Figure S1. Distribution of the National Institutes of Health Stroke Scale (NIHSS) scores by sex among those with stroke (both ischemic and intracerebral hemorrhagic stroke) in each study.
Figure S2. Difference in stroke severity between women and men with ischemic stroke: unadjusted (top) and adjusted (bottom) random‐effects meta‐analyses among 6 studies.
Figure S3. Difference in stroke severity between women and men with intracerebral hemorrhage (ICH): unadjusted (top) and adjusted (bottom) random‐effects meta‐analyses among 6 studies.