

Abstract
Background
The role of arterial load in severe aortic stenosis is increasingly recognized. However, patterns of pulsatile load and their implications in this population are unknown. We aimed to assess the relationship between the arterial properties and both (1) left ventricular remodeling and fibrosis and (2) the clinical course of patients with severe aortic stenosis undergoing aortic valve replacement (AVR).
Methods and Results
We enrolled 38 participants with symptomatic severe aortic stenosis scheduled to undergo surgical AVR. Aortic root characteristic impedance, wave reflections parameters (reflection magnitude, reflected wave transit time), and myocardial extracellular mass were measured with cardiac magnetic resonance imaging and arterial tonometry Cardiac magnetic resonance imaging was repeated at 6 months in 30 participants. A reduction in cellular mass (133.6 versus 113.9 g; P=0.002) but not extracellular mass (42.3 versus 40.6 g; P=0.67) was seen after AVR. Participants with higher extracellular mass exhibited greater reflection magnitude (0.68 versus 0.54; P=0.006) and lower aortic root characteristic impedance (56.3 versus 96.9 dynes/s per cm5; P=0.006). Reflection magnitude was a significant predictor of smaller improvement in the quality of life (Kansas City Cardiomyopathy Questionnaire score) after AVR (R=−0.51; P=0.0026). The 6‐minute walk distance at 6 months after AVR was positively correlated with the reflected wave transit time (R=0.52; P=0.01).
Conclusions
Consistent with animal studies, arterial wave reflections are associated with interstitial volume expansion in severe aortic stenosis and predict a smaller improvement in quality of life following AVR. Future trials should assess whether wave reflections represent a potential therapeutic target to mitigate myocardial interstitial remodeling and to improve the clinical status of this patient population.
Keywords: aortic stenosis, arterial stiffness, magnetic resonance imaging, myocardial fibrosis, myocardial hypertrophy, wave reflections
Subject Categories: Valvular Heart Disease, Fibrosis, Hypertrophy
Clinical Perspective
What Is New?
Arterial wave reflections are key correlates of left ventricular interstitial expansion in patients with severe aortic stenosis.
The magnitude of arterial wave reflections predicts the clinical course (change in symptoms and quality of life measures) after aortic valve replacement, with a smaller improvement among patients with high reflection magnitude.
The timing of wave reflections correlates with submaximal exercise capacity at 6 months after aortic valve replacement.
What Are the Clinical Implications?
Arterial load, in particular mid to late systolic load from wave reflections, appears to be an important contributor to left ventricular maladaptive remodeling and a poor clinical course in aortic stenosis patients undergoing aortic valve replacement.
Future studies should aim to assess whether reducing wave reflections with therapeutic interventions can improve quality of life and/or the regression of left ventricular fibrosis in patients with severe aortic stenosis undergoing aortic valve replacement.
Introduction
Severe aortic stenosis (AS) is associated with left ventricular (LV) hypertrophy and fibrosis because of its effect of left ventricular (LV) pressure overload. The extent of LV myocardial fibrosis is an independent predictor of intermediate‐ and long‐term mortality among patients undergoing aortic valve replacement (AVR) for severe AS.1 Despite the clinical relevance of myocardial fibrosis in AS, its underlying determinants before and after AVR are poorly understood. It was recently shown that, on average, extracellular volume fraction (ECVF) and extracellular mass do not regress after aortic valve replacement,2, 3 suggesting that additional factors influence the degree of fibrosis in severe AS.
In addition to the properties of the aortic valve, LV afterload is determined by the properties of the systemic arterial tree (ie, arterial load).4, 5 The importance of pulsatile arterial load in AS has been increasingly recognized.6 Arterial load is best characterized by analyses of aortic pressure–flow relations, which allow for quantification of resistive load and various components of pulsatile load.4, 5 Arterial load adds to valvular load in patients with severe AS7 and becomes the main determinant of the LV loading pattern after successful correction of valvular stenosis. The magnitude and timing of wave reflections in the arterial tree constitute important components of pulsatile load.4, 5 In every cardiac cycle, the pulse wave generated by the left ventricle travels forward in arteries and is partially reflected at sites of impedance mismatch, such as points of branching or change in wall diameter or material properties along the arterial tree. Wave reflections are conducted back to the heart, merging into a discrete reflected (backward) wave that increases the mid‐ to late systolic LV load in older adults.5, 8 Mid‐ to late systolic load from wave reflections has been shown to cause hypertrophy and fibrosis in animal models of pressure overload and has been associated with LV hypertrophy, diastolic dysfunction, atrial dysfunction, and an increased risk of heart failure in various human studies,4, 8, 9, 10, 11, 12, 13, 14 independent of the peak arterial pressure. To the degree that wave reflections contribute to pulsatile arterial load in AS, they may also determine maladaptive remodeling in this patient population and the clinical course after correction of aortic valvular stenosis.
This study was designed to test the hypothesis that arterial wave reflections and large‐artery stiffness are associated with LV remodeling and fibrosis in patients with severe AS and with the clinical course of these patients after surgical AVR.
Methods
ACRIN PA 4008 was conducted by the American College of Radiology Imaging Network (ACRIN) across 5 institutions in Pennsylvania (University of Pittsburg Medical Center, Hospital of the University of Pennsylvania, Corporal Michael J. Crescenz VA Medical Center, Penn State Milton S. Hershey Medical Center, and Lancaster General Health). The study was approved by the institutional review boards of ACRIN and each enrolling center. All participants provided written informed consent.
The data, analytic methods, and study materials are not publicly available for purposes of reproducing the results or replicating the procedures. Such data may be made available to other researchers for collaborative research through the establishment of appropriate data‐sharing agreements.
Study Population
We prospectively enrolled participants aged ≥18 years who had severe symptomatic AS (estimated aortic valve area <1 cm2 on a transthoracic echocardiogram or cardiac catheterization performed within 4 months before enrollment), surgical AVR planned within 4 weeks after enrollment, and no contraindications to undergo gadolinium contrast‐enhanced cardiac magnetic resonance imaging (CMR) before AVR.
Key exclusion criteria were as follows: (1) LV ejection fraction <50% before enrollment, (2) previous aortic valve surgery, (3) infective endocarditis, (4) moderate or severe aortic regurgitation, (5) history of myocardial infarction or segmental wall motion abnormalities, (6) known hemodynamically significant coronary artery disease, (7) unstable angina in the previous month, (8) glomerular filtration rate <45 mL/min per 1.73 m2, (9) bicuspid aortic valve, (10) resting heart rate >120 beats/min or blood pressure >180/100 mm Hg, (11) pregnancy, (12) inability to undergo CMR or conditions that would make study measurements less accurate or unreliable (ie, atrial fibrillation, anatomic neck characteristics impeding arterial tonometry, inability to perform an adequate breath hold for CMR acquisitions) or reliable postoperative follow‐up unlikely, (13) peripheral vascular disease, (14) life expectancy <1 year.
Study Procedures
CMR scans, arterial tonometry recordings, and quality‐of‐life assessments were performed before AVR and repeated 6 months ±2 weeks after AVR. A more detailed description of the study procedures is presented in Data S1. Figure S1 shows the study participant flow and procedures.
Arterial Tonometry
Arterial tonometry (Figure 1) was performed immediately before or after CMR using a SphygmoCor Px device (AtCor Medical), equipped with a high‐fidelity applanation tonometer. An aortic pressure waveform was obtained via the generalized transfer function of the Sphygmocor device. Carotid–femoral pulse wave velocity (PWV) was obtained via sequential carotid and femoral tonometry. For sensitivity analyses, we performed an additional measurement of aortic PWV using phase‐contrast magnetic resonance imaging (MRI) with in‐plane velocity encoding from head to foot in the aortic “candy cane” view.
Figure 1.
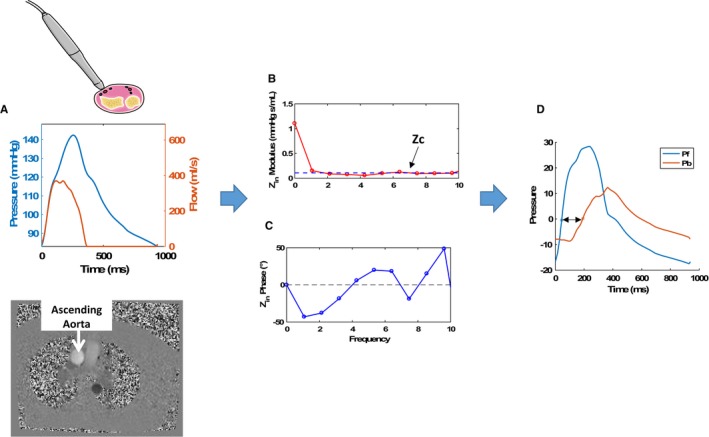
Assessment of pressure‐flow relations and wave reflections. A, The central pressure waveform obtained via arterial tonometry and the flow waveform obtained via through‐plane phase‐contrast magnetic resonance imaging of the ascending aorta. B and C, The modulus (B) and phase (C) of the aortic input impedance spectrum (Zin). The dashed line in panel B represents the proximal aortic Zc. D, Results of wave separation analysis in which the pressure wave has been separated into forward (Pf) and backward (Pb) waves. The double‐headed arrow represents the apparent reflected wave transit time (time lag between the forward and the backward waves). ZC indicates characteristic impedance; Zin, input impedance.
Measurements of LV Mass and Flow
CMR scans were performed using a 1.5‐T whole‐body MRI scanner (Avanto or Espree; Siemens) equipped with a phase‐array cardiac coil. LV volumes and ejection fraction were determined using balanced steady‐state free‐precession cine imaging. LV volumes and mass were measured from manually traced short‐axis stack cine images using CMR42 software (Circle CVI).
To compute the impedance of the systemic arterial tree (aortic input impedance) and assess wave reflections, knowledge of the time‐resolved proximal aortic inflow (which equals LV outflow) is required. Proximal aortic flow was measured using through plane velocity‐encoded phase‐contrast imaging with a plane prescribed perpendicular to the long axis of the aorta at the level of the right pulmonary artery (Figure 1). When significant aliasing impeded a reliable assessment of the proximal aortic systolic flow profile, we used the systolic LV outflow profile obtained from a 2‐dimensional, encoded, in‐plane, phase‐contrast acquisition in the 3‐chamber LV long‐axis plane. In all cases, diastolic outflow was set to 0 and the time‐integral of the systolic flow curve was calibrated to the stroke volume measured by LV cine imaging.
Arterial Load
Arterial load was quantified using custom‐designed software programmed in Matlab (MathWorks), as described previously (Figure 1).15 After alignment of the pressure–flow pair (Figure 1A), pressure–flow analyses were performed to obtain aortic input impedance modulus (Figure 1B) and phase (Figure 1C). Proximal aortic characteristic impedance (ZC), which describes the relationship between pulsatile pressure and flow in the absence of wave reflections, was computed as the mean value of input impedance moduli at higher harmonics (dashed horizontal line in Figure 1B). This was followed by wave separation (Figure 1D) into forward and reflected waves.5, 15 Reflection magnitude was calculated as backward wave amplitude divided by forward wave amplitude. Wave separation is based purely on the pulsatile components of pressure and flow and thus does not incorporate mean load (total peripheral resistance). Forward and reflected waves thus fluctuate around 0 (Figure 1D). Reflected wave transit time (double‐headed arrow in Figure 1D) represents the difference in the time at which forward and backward waves start adding to pressure. A short reflected wave transit time favors greater overlap between ventricular ejection and systolic load imposed by wave reflections. Valvuloarterial impedance was computed as follows: (mean transvalvular gradient + systolic blood pressure)/stroke volume index. Table S1 provides a glossary of the main indexes of arterial load and ventricular–arterial interactions presented in this article.
Extracellular Volume Measurements
We used a modified Look‐Locker inversion recovery, or MOLLI,12 sequence to assess T1 times before and after the intravenous administration of gadolinium contrast (MultiHance; 0.15 mmol/kg of body weight or equivalent) in a midventricular short‐axis slice. MOLLI sequences were not available at one of the recruiting centers but were performed in 31 participants enrolled across the other sites. Myocardial T1 measurements were performed before and at several time points at least 10 minutes after gadolinium administration. Gadolinium administration increases T1 relaxivity (expressed as 1/T1) of blood and myocardium. Blood and myocardial T1 measurements were used to compute the myocardium–blood partition coefficient (λ)1).5, 14, 18 as the slope of the blood 1/T1 over the myocardial 1/T1 change, via linear regression. The LV ECVF was computed as λ×(1−hematocrit). LV extracellular mass was computed as LV mass multiplied by ECVF. LV cellular mass was computed as LV mass multiplied by (1−ECVF).
Quality of Life and Functional Assessments
We measured quality of life using the Kansas City Cardiomyopathy Questionnaire (KCCQ). A 6‐minute walk distance (6MWD) test was performed during the post‐AVR visit (6 months after AVR).
Statistical Analysis
Our primary analyses tested the hypothesis that prevalent arterial properties are associated with LV remodeling and the clinical course after AVR. We assessed (1) the relationship between arterial properties and parameters at baseline (before AVR) and (2) the relationship between arterial properties and the change in key parameters after AVR. For analyses related to the 6MWD (which was only performed after AVR), the relationship with arterial load parameters measured after AVR was assessed. For intuitive assessments, we compared parameters of interest using unpaired t tests among patients above or below the median value of key arterial or LV variables. Correlation coefficients and 95% CIs were also computed. Box‐Cox transformations were applied as appropriate to normalize the distribution of parameters and/or to model residuals during analyses. Comparisons between pre‐ and post‐AVR values of key physiologic parameters were performed using paired t tests. If appropriate, we also performed analyses adjusted for brachial blood pressure measurements using ANCOVA or multivariable linear regression. All statistical tests were 2‐sided. A P value threshold of 0.05 was used to define statistical significance. Analyses were performed using the Matlab statistics and machine learning toolbox (Mathworks) and SPSS for Windows v22 (IBM Corp).
Results
General characteristics of the study population are shown in Table 1. In general, the population was composed of elderly (mean age: 72 years), predominantly male (68.4%), predominantly white (94.7%) participants.
Table 1.
Baseline Characteristics of Study Population (n=38)
| Characteristic | Mean±SD or n (%) |
|---|---|
| Age, y | 72±9.3 |
| Male sex | 26 (68.4) |
| Ethnicity | |
| White | 36 (94.7) |
| Black | 2 (5.3) |
| BMI, kg/m2 | 30.7±6.38 |
| Serum creatinine | 0.90±0.2 |
| Aortic valve area, cm2 | 0.75±0.14 |
| Aortic valve area index, cm2/m2 | 0.37±0.08 |
| Mean transvalvular gradient, mm Hg | 48.4±14.4 |
| Peak transvalvular gradient, mm Hg | 77.2±24.4 |
| Valvuloarterial impedance, mm Hg/mL per m2 | 4.24±1.08 |
| Systolic blood pressure, mm Hg | 135.2±20.4 |
| Diastolic blood pressure, mm Hg | 72.9±11.1 |
| Mean arterial pressure, mm Hg | 98.7±13.2 |
| Pulse pressure, mm Hg | 69±23.8 |
| Heart rate, beats/min | 63.5±13.3 |
| Syncope | 3 (7.69) |
| Dyspnea | 26 (68.4) |
| Angina | 1 (2.6) |
| Diabetes mellitus | 12 (31.6) |
| Hypertension | 33 (86.8) |
| NYHA class | |
| I | 10 (26.3) |
| II | 19 (50) |
| III/IV | 9 (23.7) |
| Medication use | |
| Aspirin | 31 (81.6) |
| ACEIs or ARBs | 24 (63.2) |
| β‐Blockers | 22 (57.9) |
| Calcium channel blockers | 8 (21.1) |
| Thiazide diuretics | 12 (31.6) |
| Loop diuretics | 6 (15.8) |
| Hydralazine use | 1 (2.6) |
| Long‐acting nitrate | 1 (2.6) |
| Aldosterone antagonist | 0 (0) |
ACEI indicates angiotensin‐converting enzyme inhibitor; ARB, angiotensin receptor blocker; BMI, body mass index; NYHA, New York Heart Association.
Among 38 participants who underwent baseline study procedures, there were 4 discontinuations before the post‐AVR assessment due to the participants’ wish to withdraw from the study (n=2) or decision to not pursue AVR (n=2). In 4 cases, the 6‐month CMR could not be completed because of the postoperative implantation of a pacemaker or implantable cardioverter‐debrillator (n=4).
In another case, renal dysfunction ensued postoperatively, precluding ECVF measurements but not other MRI measurements and arterial measurements. Table S2 compares participants who underwent a follow‐up CMR (n=30) versus those who did not (n=8). Participants who could not undergo a follow‐up CMR tended to be older and demonstrated a lower prevalence of thiazide use at baseline.
LV Mass, Geometry, and Myocardial Fibrosis Before and After AVR
Table 2 presents a comparison of key arterial parameters before and after AVR. Figure 2 demonstrates changes in key LV parameters. LV end‐diastolic volume was reduced from 157.1 to 144.8 mL (P=0.018), whereas LV mass decreased from 166.1 to 147.8 g (P<0.0001). Cellular mass decreased from 133.6 to 113.9 g (P=0.002), whereas extracellular mass was unchanged (42.3 versus 40.6 g; P=0.67). There were no significant changes in myocardial ECVF (24.0 to 26.9%; P=0.20) or the gadolinium partition coefficient (0.40 versus 0.45; P=0.18).
Table 2.
Paired Changes in Key LV and Arterial Parameters Between the Pre‐ and Post‐AVR Assessments
| Parameter | Pre‐AVR, mean (95% CI) | 6‐mo Post‐AVR, mean (95% CI) | Change, mean (95% CI) | P Value |
|---|---|---|---|---|
| LV EDV, mL | 157.1 (138.6–175.7) | 144.8 (127.3–162.3) | −12.3 (−22.5 to −2.2) | 0.018 |
| LV ESV, mL | 58.3 (48.2–68.4) | 51.7 (43.6–59.8) | −6.6 (−13.3 to 0.1) | 0.055 |
| LV mass, g | 166.1 (147.3–184.8) | 147.8 (131.8–163.8) | −18.2 (−25.5 to −11) | <0.0001 |
| LV ejection fraction, % | 63.8 (60.5–67.1) | 65.1 (62.5–67.6) | 1.3 (−1.4 to 3.9) | 0.20 |
| ECVF, % | 24.01 (20.95–27.07) | 26.91 (22.73–31.1) | 2.91 (−1.65 to 7.46) | 0.20 |
| Gadolinium partition coefficient | 0.4 (0.35–0.45) | 0.45 (0.38–0.51) | 0.05 (−0.02 to 0.12) | 0.18 |
| Cellular mass, g | 133.6 (115.4–151.8) | 113.9 (95.8–132.1) | −19.6 (−31.2 to −8.1) | 0.002 |
| Extracellular mass, g | 42.26 (33.97–50.54) | 40.56 (32.89–48.24) | −1.69 (−9.87 to 6.48) | 0.67 |
| Reflection magnitude | 0.62 (0.56–0.67) | 0.63 (0.58–0.67) | 0.01 (−0.06 to 0.07) | 0.81 |
| Aortic Zc, dynes/s/cm5 | 86.6 (63–110.2) | 85.5 (67.4–103.5) | −1.1 (−18.4 to 16.2) | 0.90 |
| Total arterial compliance, mL/mm Hg | 1.27 (0.99–1.55) | 1.08 (0.84–1.32) | −0.19 (−0.32 to −0.05) | 0.008 |
| CF PWV (tonometry) | 8.78 (7.44–10.12) | 11.2 (9.7–12.69) | 2.41 (0.53–4.3) | 0.015 |
| Aortic PWV (phase‐contrast MRI) | 5.54 (4.46–6.62) | 6.80 (5.54–8.06) | 1.26 (0.17–2.35) | 0.026 |
| Total peripheral resistance, dynes/s/cm5 | 1337 (1194–1481) | 1488 (1320–1657) | 151 (42–260) | 0.008 |
| Central SBP, mm Hg | 134.2 (122.4–146) | 139.1 (128.2–150) | 4.8 (−5.3 to 14.8) | 0.34 |
| Brachial SBP, mm Hg | 142.5 (132.1–152.8) | 150.3 (138.8–161.8) | 7.8 (−3.6 to 19.3) | 0.17 |
| DBP, mm Hg | 73.1 (69.6–76.6) | 71.9 (67.1–76.8) | −1.2 (−6.6 to 4.2) | 0.66 |
| Mean arterial pressure, mm Hg | 99.2 (94.2–104.2) | 98.8 (92.7–104.9) | −0.4 (−6.1 to 5.2) | 0.88 |
Values were compared using paired t tests. AVR indicates aortic valve replacement; CF, carotid‐femoral; DBP, diastolic blood pressure; ECVF, extracellular volume fraction; EDV, end‐diastolic volume; ESV, end‐systolic volume; LV, left ventricular; MRI, magnetic resonance imaging; PWV, pulse wave velocity; SBP, systolic blood pressure; Zc, characteristic impedance.
Figure 2.
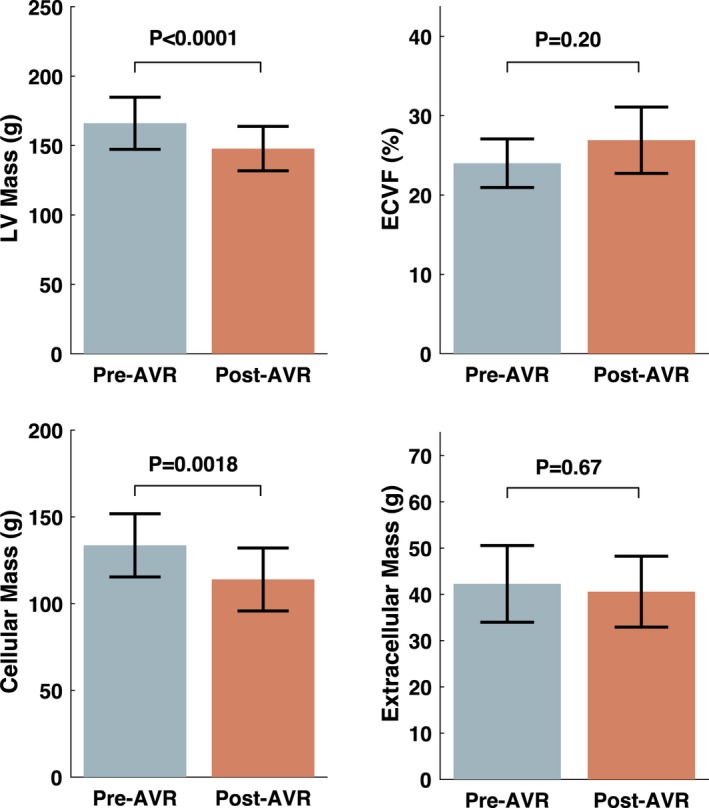
Left ventricular (LV) mass, extracellular volume fraction (ECVF), and cellular and extracellular mass before and after aortic valve replacement (AVR). P values were obtained with the paired t test.
Relationship Between Arterial Properties and Interstitial Expansion at Baseline (Before AVR)
Participants with extracellular mass above the median value (35.6 g) demonstrated greater reflection magnitude (0.68 versus 0.54; P=0.006) and lower ascending aortic Zc (56.3 versus 96.9 dynes/s per cm5; P=0.0225; Figure 3). Extracellular mass did not demonstrate significant relationships with standard blood pressure measurements, reflected wave‐transit time, valvuloarterial impedance, or carotid‐femoral PWV (Table S3).
Figure 3.
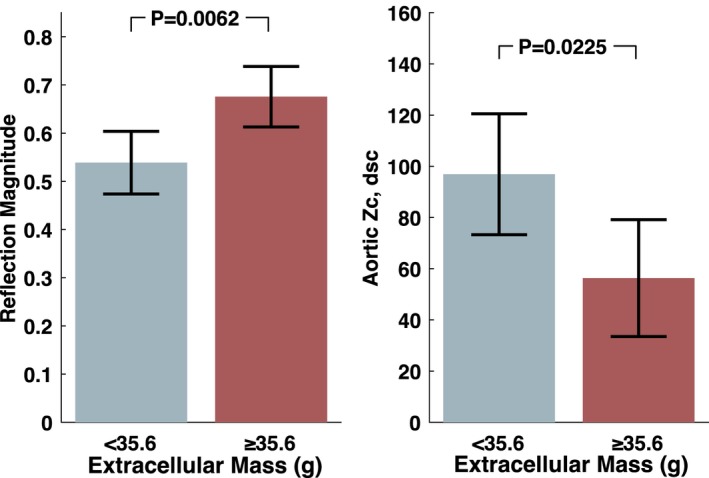
Reflection magnitude and aortic root Zc in patients with extracellular mass above vs below the median value at baseline (pre‐AVR). P values were obtained with the unpaired t test. AVR indicates aortic valve replacement; Zc, characteristic impedance.
In contrast to extracellular mass, there were no relationships between cellular mass and arterial properties. When participants were stratified by the median value of cellular mass, LV mass, or ECVF, no significant differences in reflection magnitude or timing (reflected wave transit time) were found.
Relationships Between Arterial Properties at Baseline and Improvements in Quality of Life
In the overall population, there was a significant improvement in quality of life. The overall summary KCCQ score improved from 69.4 to 88.4, a 19‐point increase (P<0.0001). There were significant average improvements in all domains of the KCCQ (Figure S2).
Reflection magnitude at baseline was a significant predictor of the change in KCCQ scores after AVR (Figure 4, left panel), with significantly lower improvement among participants with higher reflection magnitude (R=−0.51; P=0.0026). Participants who exhibited reflection magnitude values above the median value (0.65) experienced much less improvement in quality of life with AVR (change in KCCQ: 9.37 points; 95% CI, −0.3 to 19.0), compared with those who exhibited reflection magnitudes below the median value (29 points; 95% CI, 19.7 to 39; P=0.007; Figure 4, middle panel). Reflection magnitude predicted the change in multiple domains of the KCCQ, including the clinical summary score, social limitation score, quality of life score, overall symptom and symptom burden scores, and physical limitation score (Figure 4, right panel; Table S4).
Figure 4.
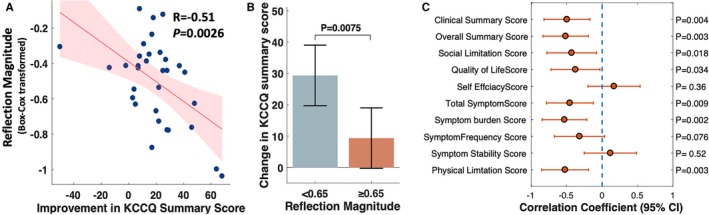
A, Relationship between wave reflection magnitude measured at baseline and the improvement in the KCCQ summary. B, Mean changes in the KCCQ summary score among patients with reflection magnitude above vs below the median value (65%). The P value was obtained with the unpaired t test. C, The correlation coefficients (and 95% CIs) between pre‐AVR reflection magnitude and the change in various components of the KCCQ with AVR. AVR indicates aortic valve replacement; KCCQ, Kansas City Cardiomyopathy Questionnaire.
Standard blood pressure values did not predict the change in KCCQ (systolic blood pressure: R=0.16, P=0.38; diastolic blood pressure: R=0.11; P=0.53; pulse pressure: R=0.21; P=0.23).
Change in Arterial Parameters After AVR
Table 2 and Figure 5 show paired comparisons of arterial parameters before versus after AVR. There were no significant changes in reflection magnitude (0.62% versus 0.63%; P=0.810) or proximal aortic root Zc (86.6 versus 85.5 dynes/s per cm5; P=0.900). However, there was a significant reduction in total arterial compliance (1.27 versus 1.08 mL/mm Hg; P=0.008) and a pronounced increase in carotid‐femoral PWV (8.78 versus 11.2 m/s; P=0.015), as measured with arterial tonometry, and in thoracic aortic PWV (5.54 versus 6.80 m/s; P=0.026), as measured with phase‐contrast MRI. There was also an increase in total peripheral resistance (1337 versus 1488 dynes/s per cm5; P=0.008).
Figure 5.
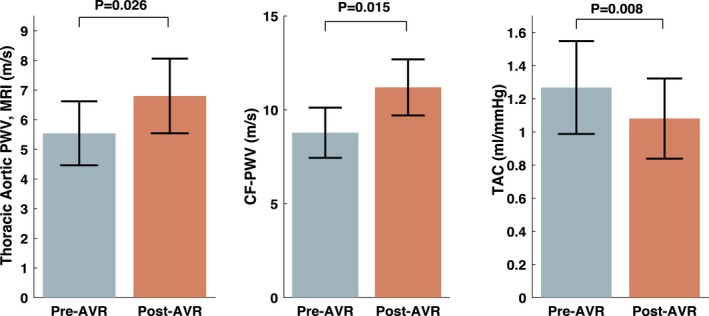
Thoracic aortic PWV (measured with phase‐contrast MRI), CF PWV (measured with tonometry), and total arterial compliance (measured with pressure–flow relations) before and after AVR. P values were obtained with the paired t test. AVR indicates aortic valve replacement; CF, carotid–femoral; MRI, magnetic resonance imaging; PWV, pulse wave velocity; TAC, total arterial compliance.
There was no relationship between the change in carotid‐femoral PWV and the change in brachial systolic blood pressure (R=0.10; P=0.683) or diastolic blood pressure (R=0.35; P=0.125). Similarly, there was no relationship between the change in thoracic aortic PWV and the change in brachial systolic blood pressure (R=0.04; P=0.870) or diastolic blood pressure (R=0.277; P=0.251).
Predictors of the 6MWD at 6 Months After AVR
The mean 6MWD was 339 m (95% CI=291–386 m). The 6MWD was positively associated with the reflected wave transit time (R=0.52; P=0.010; Figure 6). Participants with reflected wave transit time below the median value (<40 ms) walked shorter distances (285 m; 95% CI, 216.9−353) than those with longer reflected wave transit time (418 m; 95% CI, 353.2−483.6; P=0.011). There was no relationship between the 6MWD and reflection magnitude (R=−0.11; P=0.590).
Figure 6.
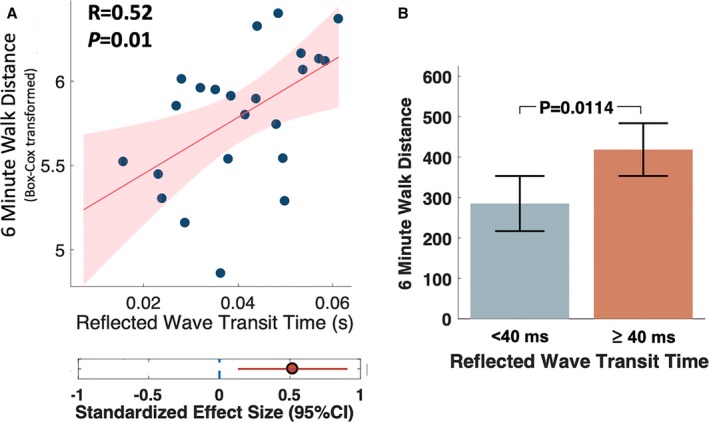
A, Correlation between reflected wave transit time and the 6MWD at 6 months after AVR. B, Mean 6MWD among subjects with reflected wave transit time less than vs greater than or equal to the median value (40 ms). The P value was obtained with the unpaired t test. 6MWD indicates 6‐minute walk distance; AVR, aortic valve replacement.
There was a significant relationship between 6MWD and systolic blood pressure (R=0.48; P=0.011), as well as between 6MWD and diastolic blood pressure (R=0.51; P=0.007). After adjustment for systolic blood pressure, the difference in 6MWD persisted between participants with a reflected wave transit time <40 ms (296 m; 95% CI, 226–365) and ≥40 ms (409 m; 95% CI, 342−475; P=0.037). However, after adjustment for diastolic blood pressure, 6MWD was not significantly different between participants with reflected wave transit time <40 versus ≥40 ms (P=0.100). In a linear regression model in which both reflected wave transit time and diastolic blood pressure were included as independent (explanatory) variables and reflected wave transit time was the independent (response) variable, diastolic blood pressure (standardized β=0.53; P=0.016), but not reflected wave transit time (standardized β=0.05; P=0.810), was independently associated with 6MWD.
Discussion
Our study provides several novel findings. First, we demonstrated, for the first time, that systolic load from arterial wave reflections is associated with greater extracellular mass in patients with severe AS, whereas aortic root Zc (which governs arterial load in the absence of wave reflection) was not. Second, we demonstrated that wave reflection magnitude does not significantly change after AVR, and it predicts less improvement in quality of life after AVR, particularly related to heart failure–associated clinical scores, symptom burden, and physical limitation. Third, we demonstrated a marked increase in aortic PWV, shown consistently by independent methods (phase‐contrast MRI and arterial tonometry), accompanied by an important reduction in total arterial compliance. Fourth, we demonstrated that a shorter reflected wave transit time (a known consequence of increased aortic PWV) correlates with submaximal exercise capacity in this population ≈6 months after AVR. Our findings have important implications for our understanding of the hemodynamic determinants of LV remodeling, extracellular matrix expansion, quality of life, and submaximal exercise capacity in this patient population.
In patients with severe AS, AVR reduces LV pressure overload and induces a regression of LV hypertrophy (ie, a reduction in LV mass). However, few data are available regarding the changes in cellular versus extracellular mass (which reflects interstitial expansion) after AVR. However, consistent with findings from the present study, 2 previous studies demonstrated that LV mass reduction after AVR is exclusively due to regression of cellular rather than extracellular mass.2, 3 Importantly, the amount of extracellular volume expansion (which correlates with histologic fibrosis in AS)16 is an independent predictor of adverse outcomes in this patient population.1, 16 Given that extracellular mass does not substantially regress after correction of LV pressure overload with valve replacement, a better understanding of additional factors that influence the extent of extracellular volume expansion in severe AS is highly relevant.
The lack of regression of extracellular mass after AVR suggests that factors other than the pressure overload imposed by the stenotic valve are involved. Of note, despite the significant pressure overload that the aortic valve imposes on the left ventricle, it is important to recognize that the left ventricle experiences the composite load of the valve and the time‐varying load imposed by the arterial tree. Arterial load also largely determines the “residual” LV afterload after correction of AS. Whereas severe AS represents a relatively fixed load, arterial load represents a complex frequency‐dependent load determined by properties of the aortic root, reflected waves from the periphery, and the microvasculature.4, 5 Arterial properties determine the relationship between early and late systolic arterial load to the left ventricle. In particular, in the presence of aortic stiffening (eg, that which occurs in older adults), arterial wave reflections (which originate distal to the aortic root) return to the heart during ejection, increasing pulsatile load in mid‐ to late systole and affecting the LV loading sequence. We hypothesized that wave reflections correlate with LV extracellular volume expansion and an adverse clinical course in severe AS, based on (1) previous animal data demonstrating that late systolic load from wave reflections (induced by abdominal aortic banding) in the setting of LV pressure overload causes greater LV fibrosis compared with an intervention that achieves the same degree of LV pressure overload without prominent late systolic load (aortic arch banding) and (2) a series of human studies demonstrating that late systolic load from wave reflections is associated with LV hypertrophy, diastolic dysfunction, atrial dysfunction, and an increased risk of heart failure in various human studies in non‐AS populations.4, 8, 9, 10, 11, 12, 13
In a population of older adults with severe AS, we found that reflection magnitude is associated with myocardial interstitial expansion, whereas aortic Zc (a key determinant of early systolic pulsatile arterial load and the only determinant of pulsatile arterial load in the absence of wave reflections) is associated with a lower degree of extracellular volume expansion. These novel findings add to accumulating data demonstrating the deleterious effects of wave reflections on LV structure and function, extending their importance to severe AS, in which there is severe LV pressure overload from the stenotic valve. Our studies in this human model of pressure overload strongly support the notion, suggested by experimental animal studies, that the loading sequence adversely influences LV remodeling independent of pressure overload per se.
Importantly, we demonstrated that the reflection magnitude predicts clinical improvement (as measured by the KCCQ) after correction of severe AS with surgical AVR. In patients with severe AS, surgical replacement of the severely stenotic valve improves the pressure overload, but the LV remains exposed to the underlying arterial loading sequence determined by wave reflections. As expected, there was no significant change in reflection magnitude between our pre‐ and post‐AVR measurements. Reflection magnitude measured at baseline, however, predicted the improvement (or lack thereof) in overall quality of life and various clinical, symptom, and physical limitation subscores of the KCCQ. The difference in KCCQ score improvement between participants with lower versus higher reflection magnitude was large (29 versus 9.37 points) and clinically significant. These findings suggest that wave reflection measurements can predict symptomatic improvement after AVR but also, more importantly, that wave reflections could be targeted with therapy, which may result in enhanced symptomatic improvement in this population. Orally administered inorganic nitrate has been shown to reduce wave reflections arriving at the proximal aorta without inducing significant hypotension or side effects in other populations.17, 18 Future properly designed prospective randomized clinical trials should test whether reducing wave reflections leads to clinical benefits in this population after successful AVR.
Our study also demonstrates an unexpected pronounced increase in aortic PWV after AVR. Interestingly, a previous study demonstrated that surgical AVR was associated with a significant decrease in ascending and descending thoracic aortic distensibility and a significant increase in aortic PWV measured with in‐plane aortic MRI phase‐contrast imaging.19 We reproduced this increase in aortic PWV using a similar MRI method and confirmed this increase using an independent method (tonometry‐based carotid–femoral PWV measurements), currently considered the noninvasive gold standard index of large‐artery stiffness. Furthermore, we demonstrate a parallel reduction in total arterial compliance, a known consequence of large‐artery stiffening. Our findings are consistent with those reported immediately after transcatheter AVR by Yotti et al, which included a reduction in total arterial compliance and increased wave speed velocity (the analogous of local pulse wave velocity derived by wave intensity analysis).7 These changes were attributed to improved transmission of blood momentum to the arterial system after transcatheter AVR. It was proposed that, because of the nonlinear viscoelastic strain of large arteries, changes in the pressure‐mediated deformation of the aorta after valve replacement may induce stiffer behavior of the aortic wall. Interestingly, we did not observe an increase in aortic Zc after transcatheter AVR, which is not necessarily in disagreement with an increased stiffness of the aorta, given than Zc is predominantly determined by aortic geometry rather than stiffness.4, 20 In addition to the aforementioned mechanical processes, it is possible that additional chronic processes in the arterial wall favor continued progression or arterial stiffening. At present, the reasons for increased large‐artery stiffness after AVR are incompletely understood; this represents a key area for future research.
Interestingly, carotid–femoral PWV, measured by arterial tonometry, and thoracic aortic PWV, measured by phase‐contrast MRI, demonstrated similar temporal trends but different absolute values. This is due to the fact that one method (phase‐contrast MRI) interrogates a segment of the thoracic aorta, whereas the other (tonometry) interrogates a long segment that includes the descending thoracic aorta, the abdominal aorta, and muscular arterial segments (which tend to be stiffer than elastic segments). Furthermore, the determinants of ascending aortic stiffening may be very different compared with the descending aortic segment.
In the present study, we demonstrated an inverse relationship between reflected wave transit time (a known consequence of a high aortic PWV) and submaximal exercise capacity 6 months after AVR. Reflection magnitude and timing interact to determine the impact of wave reflections on systolic load. After AVR, there was a marked increase in aortic PWV, demonstrated consistently by independent methods. With this change, as would be expected, reflected wave transit time became important and was shown to correlate with submaximal exercise capacity. Interestingly, we also found a relationship between the 6MWD and both systolic and diastolic blood pressure. Although the relationship between reflected wave transit time and 6MWD was independent of systolic blood pressure, it was not independent of diastolic blood pressure. The latter is consistent with physiologic principles because a fast return of the reflected wave results in less diastolic pressure augmentation from the reflected wave (and thus lower diastolic blood pressure). Diastolic augmentation of aortic pressure (as opposed to systolic augmentation of afterload) is a key hemodynamic determinant of the myocardial oxygen supply and demand. It remains to be determined whether delaying reflected wave transit time could restore a more favorable diastolic pressure profile and/or improve the 6MWD.
Our study should be interpreted in the context of its strengths and limitations. Strengths of our study include the use of comprehensive assessments of arterial load, the dedicated assessment of cellular and interstitial expansion, the careful selection of study participants, measurement of PWV by 2 independent methods, and the application of state‐of‐the‐art methods for analyses of pressure–flow relations. Our study is the first to evaluate the impact of arterial load quantified by input impedance (the gold standard method to quantify arterial load) on LV remodeling, clinical parameters, and the post‐AVR clinical course in this patient population. Our study also has limitations. We did not assess histologic fibrosis, although MRI extracellular volume measurements have been validated against tissue biopsies obtained surgically during AVR in patients with severe AS.3, 16 We did not perform invasive measurements of pressure and flow, which would have been unfeasible in many patients, particularly after AVR. Given the presence of aliasing with significant artifact in the flow waveform in some recordings, we utilized the LV outflow systolic flow profile. We note, however, that the flow profile in systole is conserved between the LV outflow tract and the proximal aorta; therefore, this is unlikely to have introduced major error or any systematic bias. Nevertheless, information in the diastolic flow profile may have been neglected. We did not directly assess aortic or carotid pressure but relied on a generalized transfer function, which may be less accurate in AS. Our sample size was small, although relatively large effect sizes allowed us to detect various significant relations. However, we were unable to assess the degree to which arterial properties are independent of standard risk factors or whether they mediate or moderate the effect of such risk factors on LV remodeling and outcomes after AVR. There were multiple statistical tests, which could have inflated our α error. Our findings will require replication in future studies with larger samples. Although our study occurred across multiple centers, the findings may not be generalizable to other populations with severe AS, particularly younger patients. Our observational study cannot prove causality, which should be assessed in future experimental studies. Finally, we did not specifically assess indexes of wave reflection and ventriculoarterial coupling in participants with low‐gradient AS.
In conclusion, our study demonstrates that arterial wave reflections are key correlates of LV interstitial expansion in patients with severe AS and predict the clinical course (changes in symptomatic status and quality of life) after AVR. We also demonstrate the role of arterial load (particularly the timing of wave reflections) on submaximal exercise capacity 6 months after AVR. Our findings support the importance of arterial load (in particular, mid‐ to late systolic load from wave reflections) as a contributor to LV maladaptive remodeling and poor clinical course in this population. As such, it identifies a potential therapeutic target that is amenable to currently available pharmacologic interventions.
Sources of Funding
This project is funded, in part, under a grant with the Pennsylvania Department of Health. The department specifically declaims responsibility for any analyses, interpretations, or conclusions. Chirinos is supported by National Institutes of Health (NIH) grants R56HL‐124073‐01A1 and R01 HL 121510‐01A1. Witschey is supported by Support NIH grant NHLBI R00‐HL108157. We are grateful to Bracco Diagnostics Inc for supplying the contrast agent, MultiHance, that was used in this study.
Disclosures
Chirinos has received consulting honoraria from BMS, OPKO, Fukuda‐Denshi, Microsoft, Merck, Ironwood, Akros, Bayer, Sanifit, Vital Labs, and Pfizer; research grants from National Institutes of Health, American College of Radiology Network, Fukuda‐Denshi, Bristol‐Myers Squibb, Microsoft and CVRx Inc; and device loans from AtCor Medical, Uscom and Unex. Chirinos is named as inventor in a University of Pennsylvania patent application for the use of inorganic nitrates/nitrites for the treatment of heart failure and preserved ejection fraction. Chirinos received investigator‐initiated grant support from Medtronic Inc. The remaining authors have no disclosures to report.
Supporting information
Data S1. Supplemental Methods
Table S1. Glossary of Key Indexes of Arterial Load and Ventricular Arterial Interaction
Table S2. Comparison on Participants Who Did and Did Not Undergo a Cardiac Magnetic Resonance Imaging Study After Aortic Valve Replacement.
Table S3. Comparisons of Parameters of Arterial Load Between Participants With Higher vs Lower Extracellular Mass at Baseline (Pre–Aortic Valve Replacement), Stratified According to the Median Value
Table S4. Correlation Between Reflection Magnitude at Baseline (Pre–Aortic Valve Replacement [Pre‐AVR]) and the Improvement in Kansas City Cardiomyopathy Questionnaire after AVR (Change Compared With Pre‐AVR Value)
Figure S1. Study participant flow and procedures.
Figure S2. Mean change in KCCQ scores between the pre‐AVR and post‐AVR assessments. A positive change (ie, higher post‐AVR scores) indicate an improvement. AVR indicates aortic valve replacement; KCCQ, Kansas City Cardiomyopathy Questionnaire.
(J Am Heart Assoc. 2019;8:e010271 DOI: 10.1161/JAHA.118.010271.)
This article was handled independently by U. Joseph Schoepf, MD, as a guest editor. The editors had no role in the evaluation of the manuscript or in the decision about its acceptance.
References
- 1. Azevedo CF, Nigri M, Higuchi ML, Pomerantzeff PM, Spina GS, Sampaio RO, Tarasoutchi F, Grinberg M, Rochitte CE. Prognostic significance of myocardial fibrosis quantification by histopathology and magnetic resonance imaging in patients with severe aortic valve disease. J Am Coll Cardiol. 2010;56:278–287. [DOI] [PubMed] [Google Scholar]
- 2. Vermes E, Cazeneuve N, Genee O, Delhommais A, Brunereau L, Alison D, Pucheux J. T1 mapping, ECV and ICV before and after aortic valve replacement. J Cardiovasc Magn Reson. 2015;17:P342. [Google Scholar]
- 3. Flett AS, Sado DM, Quarta G, Mirabel M, Pellerin D, Herrey AS, Hausenloy DJ, Ariti C, Yap J, Kolvekar S, Taylor AM, Moon JC. Diffuse myocardial fibrosis in severe aortic stenosis: an equilibrium contrast cardiovascular magnetic resonance study. Eur Heart J Cardiovasc Imaging. 2012;13:819–826. [DOI] [PubMed] [Google Scholar]
- 4. Nichols WW, O'Rourke M, Vlachopoulos C. Mcdonald's Blood Flow in Arteries: Theoretical, Experimental and Clinical Principles. 6th ed. London, UK: Hodder Arnold; 2011. [Google Scholar]
- 5. Chirinos JA, Segers P. Noninvasive evaluation of left ventricular afterload: part 2: arterial pressure‐flow and pressure‐volume relations in humans. Hypertension. 2010;56:563–570. [DOI] [PubMed] [Google Scholar]
- 6. Lindman BR, Otto CM, Douglas PS, Hahn RT, Elmariah S, Weissman NJ, Stewart WJ, Ayele GM, Zhang F, Zajarias A, Maniar HS, Jilaihawi H, Blackstone E, Chinnakondepalli KM, Tuzcu EM, Leon MB, Pibarot P. Blood pressure and arterial load after transcatheter aortic valve replacement for aortic stenosis. Circ Cardiovasc Imaging. 2017;10:e006308. [DOI] [PubMed] [Google Scholar]
- 7. Yotti R, Bermejo J, Gutierrez‐Ibanes E, Perez del Villar C, Mombiela T, Elizaga J, Benito Y, Gonzalez‐Mansilla A, Barrio A, Rodriguez‐Perez D, Martinez‐Legazpi P, Fernandez‐Aviles F. Systemic vascular load in calcific degenerative aortic valve stenosis: insight from percutaneous valve replacement. J Am Coll Cardiol. 2015;65:423–433. [DOI] [PubMed] [Google Scholar]
- 8. Chirinos JA. Deep phenotyping of systemic arterial hemodynamics in hfpef (part 1): physiologic and technical considerations. J Cardiovasc Transl Res. 2017;10:245–259. [DOI] [PMC free article] [PubMed] [Google Scholar]
- 9. Kobayashi S, Yano M, Kohno M, Obayashi M, Hisamatsu Y, Ryoke T, Ohkusa T, Yamakawa K, Matsuzaki M. Influence of aortic impedance on the development of pressure‐overload left ventricular hypertrophy in rats. Circulation. 1996;94:3362–3368. [DOI] [PubMed] [Google Scholar]
- 10. Gillebert TC, Lew WY. Influence of systolic pressure profile on rate of left ventricular pressure fall. Am J Physiol. 1991;261:H805–H813. [DOI] [PubMed] [Google Scholar]
- 11. Chirinos JA, Phan TS, Syed AA, Hashmath Z, Oldland HG, Koppula MR, Tariq A, Javaid K, Miller R, Varakantam S, Dunde A, Neetha V, Akers SR. Late systolic myocardial loading is associated with left atrial dysfunction in hypertension. Circ Cardiovasc Imaging. 2017;10:e006023. [DOI] [PMC free article] [PubMed] [Google Scholar]
- 12. Chirinos JA, Segers P, Rietzschel ER, De Buyzere ML, Raja MW, Claessens T, De Bacquer D, St John Sutton M, Gillebert TC, Asklepios I. Early and late systolic wall stress differentially relate to myocardial contraction and relaxation in middle‐aged adults: the Asklepios study. Hypertension. 2013;61:296–303. [DOI] [PubMed] [Google Scholar]
- 13. Chirinos JA, Kips JG, Jacobs DR Jr, Brumback L, Duprez DA, Kronmal R, Bluemke DA, Townsend RR, Vermeersch S, Segers P. Arterial wave reflections and incident cardiovascular events and heart failure: MESA (Multiethnic Study of Atherosclerosis). J Am Coll Cardiol. 2012;60:2170–2177. [DOI] [PMC free article] [PubMed] [Google Scholar]
- 14. Hashimoto J, Westerhof BE, Westerhof N, Imai Y, O'Rourke MF. Different role of wave reflection magnitude and timing on left ventricular mass reduction during antihypertensive treatment. J Hypertens. 2008;26:1017–1024. [DOI] [PubMed] [Google Scholar]
- 15. Segers P, Rietzschel ER, De Buyzere ML, Vermeersch SJ, De Bacquer D, Van Bortel LM, De Backer G, Gillebert TC, Verdonck PR; Asklepios investigators . Noninvasive (input) impedance, pulse wave velocity, and wave reflection in healthy middle‐aged men and women. Hypertension. 2007;49:1248–1255. [DOI] [PubMed] [Google Scholar]
- 16. Chin CW, Everett RJ, Kwiecinski J, Vesey AT, Yeung E, Esson G, Jenkins W, Koo M, Mirsadraee S, White AC, Japp AG, Prasad SK, Semple S, Newby DE, Dweck MR. Myocardial fibrosis and cardiac decompensation in aortic stenosis. JACC Cardiovasc Imaging. 2016;10:1320–1333. [DOI] [PMC free article] [PubMed] [Google Scholar]
- 17. Zamani P, Rawat D, Shiva‐Kumar P, Geraci S, Bhuva R, Konda P, Doulias PT, Ischiropoulos H, Townsend RR, Margulies KB, Cappola TP, Poole DC, Chirinos JA. Effect of inorganic nitrate on exercise capacity in heart failure with preserved ejection fraction. Circulation. 2015;131:371–380; discussion 380. [DOI] [PMC free article] [PubMed] [Google Scholar]
- 18. Chirinos JA, Londono‐Hoyos F, Zamani P, Beraun M, Haines P, Vasim I, Varakantam S, Phan TS, Cappola TP, Margulies KB, Townsend RR, Segers P. Effects of organic and inorganic nitrate on aortic and carotid haemodynamics in heart failure with preserved ejection fraction. Eur J Heart Fail. 2017;19:1507–1515. [DOI] [PMC free article] [PubMed] [Google Scholar]
- 19. Musa TA, Uddin A, Fairbairn TA, Dobson LE, Sourbron SP, Steadman CD, Motwani M, Kidambi A, Ripley DP, Swoboda PP, McDiarmid AK, Erhayiem B, Oliver JJ, Blackman DJ, Plein S, McCann GP, Greenwood JP. Assessment of aortic stiffness by cardiovascular magnetic resonance following the treatment of severe aortic stenosis by TAVI and surgical AVR. J Cardiovasc Magn Reson. 2016;18:37. [DOI] [PMC free article] [PubMed] [Google Scholar]
- 20. Chirinos JA, Segers P. Noninvasive evaluation of left ventricular afterload: part 1: pressure and flow measurements and basic principles of wave conduction and reflection. Hypertension. 2010;56:555–562. [DOI] [PubMed] [Google Scholar]
Associated Data
This section collects any data citations, data availability statements, or supplementary materials included in this article.
Supplementary Materials
Data S1. Supplemental Methods
Table S1. Glossary of Key Indexes of Arterial Load and Ventricular Arterial Interaction
Table S2. Comparison on Participants Who Did and Did Not Undergo a Cardiac Magnetic Resonance Imaging Study After Aortic Valve Replacement.
Table S3. Comparisons of Parameters of Arterial Load Between Participants With Higher vs Lower Extracellular Mass at Baseline (Pre–Aortic Valve Replacement), Stratified According to the Median Value
Table S4. Correlation Between Reflection Magnitude at Baseline (Pre–Aortic Valve Replacement [Pre‐AVR]) and the Improvement in Kansas City Cardiomyopathy Questionnaire after AVR (Change Compared With Pre‐AVR Value)
Figure S1. Study participant flow and procedures.
Figure S2. Mean change in KCCQ scores between the pre‐AVR and post‐AVR assessments. A positive change (ie, higher post‐AVR scores) indicate an improvement. AVR indicates aortic valve replacement; KCCQ, Kansas City Cardiomyopathy Questionnaire.