Abstract
In this work, hafnium oxide (HfO2) thin films are deposited on p-type Si substrates by remote plasma atomic layer deposition on p-type Si at 250 °C, followed by a rapid thermal annealing in nitrogen. Effect of post-annealing temperature on the crystallization of HfO2 films and HfO2/Si interfaces is investigated. The crystallization of the HfO2 films and HfO2/Si interface is studied by field emission transmission electron microscopy, X-ray photoelectron spectroscopy, X-ray diffraction, and atomic force microscopy. The experimental results show that during annealing, the oxygen diffuse from HfO2 to Si interface. For annealing temperature below 400 °C, the HfO2 film and interfacial layer are amorphous, and the latter consists of HfO2 and silicon dioxide (SiO2). At annealing temperature of 450-550 °C, the HfO2 film become multiphase polycrystalline, and a crystalline SiO2 is found at the interface. Finally, at annealing temperature beyond 550 °C, the HfO2 film is dominated by single-phase polycrystalline, and the interfacial layer is completely transformed to crystalline SiO2.
Keywords: Hafnium oxide, Atomic layer deposition, Interface, Annealing, Crystallization
Introduction
Hafnium oxide (HfO2) thin film is an interesting material for a variety of applications. It can be used in multilayer optical coating [1], protective coating [2], gate dielectric [3], passivating layer [4–6], and so on due to its excellent properties, such as high density, high refractive index, wide band gap, and relatively high thermal stability. Many methods have been used to prepare HfO2 thin film, such as electron beam evaporation [7], chemical solution deposition [8], reactive sputtering [9], metal organic chemical vapor deposition [10], molecular beam epitaxy [11], and atomic layer deposition (ALD). ALD is a promising method for obtaining thin films with both high-precision thickness control and high accuracy uniformity. Post-annealing is found to have significant influences on ALD HfO2 films [12–15]. According to the research, HfO2 thin films can crystalize for an annealing temperature higher than 500 °C [16–18]. The crystalline structure of HfO2 strongly affects optical and electrical properties. For example, the structural change of HfO2 from amorphous to monoclinic crystalline phase could lead to changes of refractive index from 1.7 to 2.09, optical gap from 5.75 to 6.13 eV, and dielectric constant from 24.5 to 14.49 [19, 20]. For ALD HfO2 deposited on silicon substrates, an oxide layer is usually observed at HfO2/Si interface [21, 22]. The presence of this interfacial layer is reported to decrease the dielectric constant [22]. In addition, Kopani et al. [23] presented the structural properties of 5-nm HfO2 films after nitric acid oxidation of n-doped Si substrates. They found that high annealing temperature increases the growth rate of crystalline nuclei. However, their crystallization properties particularly HfO2/substrate interface have scantly been studied. Therefore, the annealing temperature affecting the crystallization properties of HfO2 thin films prepared by ALD was worth for further investigation.
In this work, the HfO2 thin films were fabricated by a remote plasma atomic layer deposition (RP-ALD) on p-type silicon substrates. Post-annealing was performed by a rapid thermal annealing (RTA) system at different temperatures. The structural changes and crystallization properties of HfO2 thin films by RTA were characterized by atomic force microscopy (AFM), grazing incident X-ray diffraction (GIXRD), X-ray photoelectron spectroscopy (XPS), and high-resolution transmission electron microscopy (HR-TEM). The temperature-dependent HfO2/Si interface structural evolution and its mechanism are also investigated.
Method
Doubled-sided polished (100) oriented p-type 2-inch 250-μm Czochralski Si wafers with a resistivity of 30 Ω cm were used. Prior to the deposition, Si wafers were cleaned by a standard Radio Corporation of America method followed by dipping in diluted hydrofluoric acid solution (5%) for 2 min to remove possible stray oxides without final water rinse. After cleaning, all of the wafers were dried with pure nitrogen (N2) gas and mounted onto the substrate holder. Approximately 15 nm HfO2 (168 ALD cycles) thin films were deposited on Si wafers by RP-ALD (Picosun R-200, Finland) using tetrakis (ethylmethylamino) hafnium (TEMAH) and oxygen (O2) in alternating pulse with N2 purge of the reaction chamber between pulses. The TEMAH and O2 plasma were pulsed into the reactor in the following sequence: TEMAH pulse 1.6 s; N2 purge 10 s; O2 plasma pulse 10 s, and N2 purge 12 s. After depositing the HfO2 thin films, the rapid thermal annealing was performed in N2 ambient for 10 min. The annealing temperatures were varied from 400 to 600 °C to investigate the effect on crystallization of the HfO2 thin films and HfO2/Si interface. Table 1 lists the typical conditions of RPALD and post-annealing.
Table 1.
RPALD HfO2 deposition parameters
| RPALD- HfO2 thin film | |
| Parameter | Value |
| Substrate temperature (°C) | 250 |
| TEMAH pulse time (s) | 1.6 |
| O2 plasma pulse time (s) | 10 |
| O2 plasma power (W) | 2500 |
| Thickness (nm) | 15 |
| RTA-post annealing process | |
| Parameter | Value |
| Temperature (°C) | 400–600 |
| Time (min) | 20 |
| Ambient | N2 |
AFM measurements were performed in tapping mode for investigating the surface morphology of the HfO2 thin films. The AFM images shown in this work are 2 μm × 2 μm scans with a resolution of 256 points × 256 lines. The structure of HfO2 films were characterized by grazing incident X-ray diffraction (GIXRD, Rigaku TTRAXIII, Japan) measurements with a Cu long-fine-focus X-ray tube. X-rays with a wavelength of 0.154 nm were produced at an operating voltage of 50 kV and a current of 300 mA. An incident angle of 0.5° was selected to obtain diffraction patterns over a 2θ range of 20–60°. X-ray photoelectron spectroscopy (XPS, Thermo Fisher K-alpha) was also performed using monochromatic Al Kα X-ray radiation (hν = 1486.6 eV). For the XPS analysis, a 100-μm diameter spot was used, and photoelectrons were collected at a take-off angle of 45°. The cross sections of the HfO2 thin films were prepared by a focused ion beam lift-out technique in a Hitachi NX2OOO system. The cross-sectional images of the HfO2 thin films were examined by a field emission high-resolution transmission electron microscopy (HR-TEM, JEM-2100F, USA).
Results and Discussion
Figure 1 shows the AFM images for the HfO2 films annealed at different temperatures. The root-mean-square (RMS) and average surface roughness (Ra) values are shown for indicating the surface roughness. The RMS value is 0.44 nm for the as-deposited film. It slightly increases to 0.47 nm when the annealing temperature rises to 500 °C. Further increasing the annealing temperature to 600 °C leads to a significant enhancement in surface roughness with a RMS increasing to 0.69 nm. Same tendency is observed in Ra values. The increase in surface roughness for the annealed films might infer a structural change.
Fig. 1.
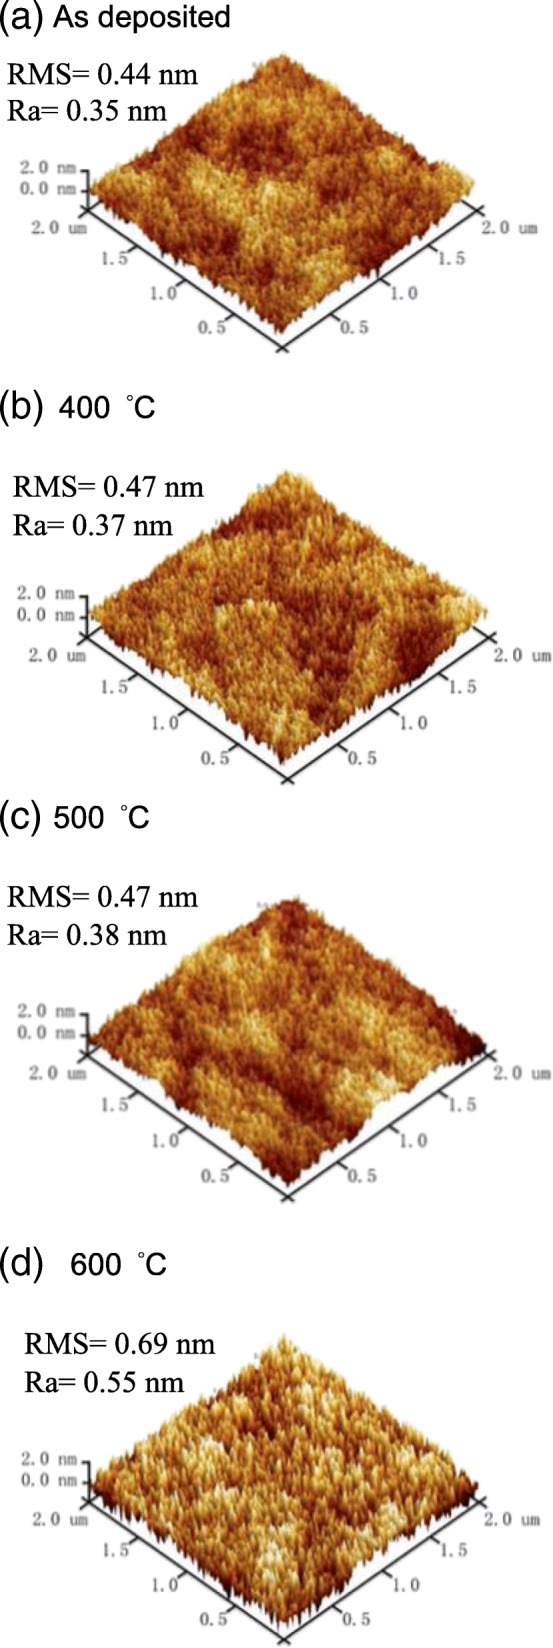
AFM images of a as-deposited, b 400 °C-annealed, c 500 °C-annealed, and d 600 °C-annealed HfO2 films
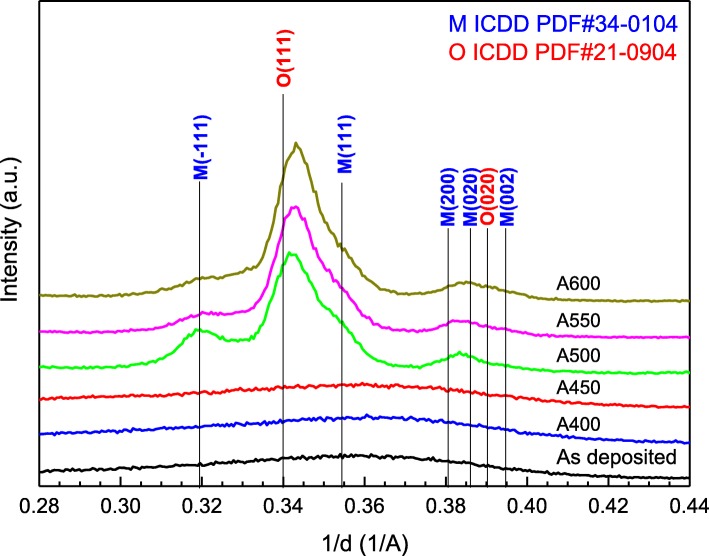
Figure 2 shows the temperature-dependent GIXRD spectra of various HfO2 thin films. The as-deposited HfO2 films is amorphous and remains amorphous after annealing at 400 and 450 °C. At an annealing temperature higher than 500 °C, diffraction peaks appear, indicating the formation of crystalline HfO2. The peaks at 1/d = 0.319 and 0.354 Å−1 correspond to the − 111 and 111 planes to the monoclinic phase (ICDD PDF#34-0104, space group P21/c), respectively. The peak at 1/d = 0.340 Å−1 corresponds to the (111) plane of the orthorhombic phase (ICDD PDF#21-0904, space group Pbcm). Other peaks near 1/d = 0.380~0.395 are the 200, 020, and 002 planes of the monoclinic and the 020 plane of the orthorhombic phases. The results also reveal that the monoclinic phase decrease and the orthorhombic phases increase with the annealing temperature. The orthorhombic HfO2 dominates the crystalline structure at higher annealing temperatures. However, the diffraction peaks of orthorhombic HfO2 were observed at a lower 1/d (a smaller d-spacing) as compared to that in the ICDD PDF#21-0904. In addition, the shift of 1/d = 0.340 Å−1 towards a higher value indicates that the d-spacing decreases with the annealing temperature.
Fig. 2.
GIXRD spectra of HfO2 thin films annealed at different temperatures
The concentrations of Hf and O within the HfO2 films were measured using depth profiled XPS. Figure 3 shows the O/Hf composition ratio of the as-deposited and post-annealed HfO2 films. The O/Hf ratio decreases from 1.60 to 1.29 with the annealing temperature. Due to the use of N2 during the annealing, the HfO2 becomes oxygen deficient with the temperature. The oxygen deficient HfO2 film also results a smaller d-spacing as mentioned previously.
Fig. 3.
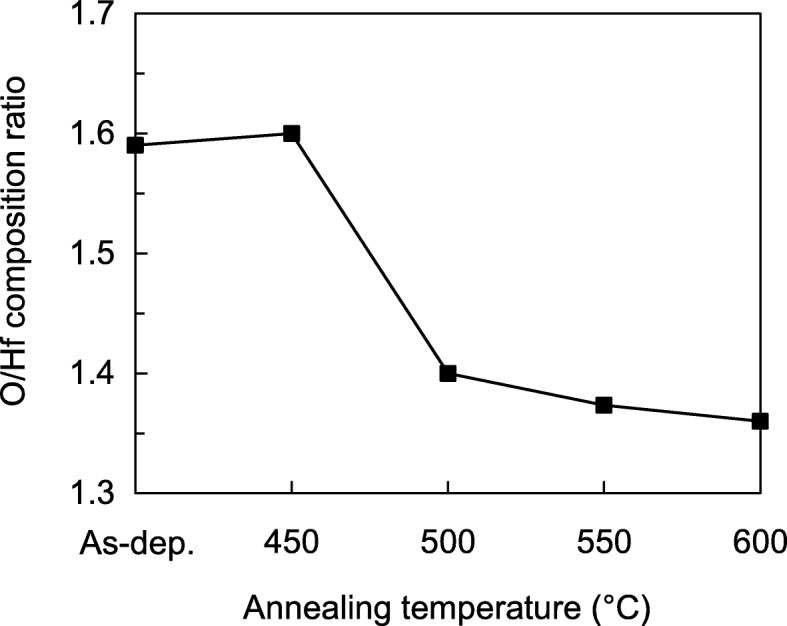
Atomic ratio of oxygen to hafnium for HfO2 thin films annealed at different temperatures
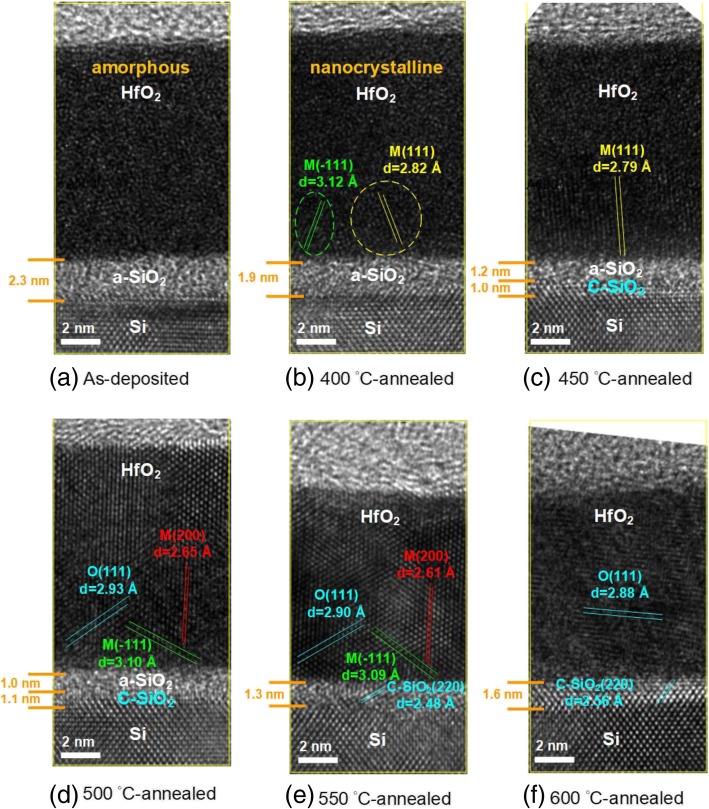
Figure 4a, b, c, d, e, and f show the high-resolution cross-sectional HR-TEM images of as-deposited 400 °C-, 450 °C-, 500 °C-, 550 °C-, and 600 °C-annealed HfO2 thin films on Si substrates, respectively. It can be seen that the HfO2 layer and Si substrate are clearly exhibited in these images. Additionally, a thin layer with the thickness of 1–2 nm between HfO2 and Si substrate could be the SiO2 film. As shown in Fig. 4a, there is no obvious lattice arrangement in the as-deposited HfO2 film, indicating that this film is amorphous. After annealing at 400 °C, although most regions of HfO2 film are still amorphous, we can observe that a fraction of lattice arrangements with the d-spacing values of 2.82 and 3.12 Å are formed in this film. These two d-spacing values are indexed to monoclinic HfO2 (111) and monoclinic HfO2 (− 111) planes, respectively, and the 400 °C-annealed film shows the nanocrystalline structure. With increasing the annealing temperature from 400 to 600 °C, the crystal quality of HfO2 film is gradually enhanced. When the HfO2 film is annealed at 500–550 °C, the main lattice arrangements consisting of monoclinic HfO2 (− 111), monoclinic HfO2 (200), and orthorhombic HfO2 (111) can be identified. However, further increasing the annealing temperature to 600 °C, the lattice structure of orthorhombic HfO2 (111) still exists in the film, and the other two lattice arrangements gradually disappear. On the other hand, the d-spacing values of orthorhombic HfO2 (111) planes for the 500 °C-, 550 °C- and 600 °C-annealed HfO2 films are determined to be 2.93, 2.90, and 2.88 Å, respectively. This agrees well with the XRD result that the orthorhombic HfO2 (111) diffraction peak shifts towards to the high angle direction with increasing the annealing temperature from 500 to 600 °C. The result reveals that the oxygen content of HfO2 film reduces gradually as the annealing temperature is increased. The other interesting phenomenon can be found in the changes of crystal structure and thickness of the SiO2 layer. At the as-deposited state, the SiO2 layer is amorphous. Even if the sample is annealed at 400 °C, the thermal energy is not high enough to transform the structure of SiO2 layer from amorphous to crystalline. Nevertheless, by increasing the annealing temperature from 450 to 600 °C, the crystalline SiO2 layer (with the cubic SiO2 (220) structure) is formed and its thickness increases from 1.0 to 1.6 nm. It can be observed that the amorphous SiO2 layer completely transforms to cubic SiO2 structure after annealing the sample at 600 °C. With an increment of annealing temperature from 550 to 600 °C, the d-spacing value of cubic SiO2 (220) increases from 2.48 to 2.56 Å. This means that the oxygen content of SiO2 layer increases by increasing the annealing temperature. It can be reasonably speculated that the addition of oxygen content in the SiO2 layer is attributed to the diffusion of oxygen atoms sourced from the HfO2 film. Moreover, the overall thickness decreases for the annealing temperature of 550 and 600 °C and might be related to the increase of the film density caused by crystallization and hydrogen removal.
Fig. 4.
Cross-sectional TEM images of a as-deposited, b 400 °C-annealed, c 450 °C-annealed, d 500 °C-annealed, e 550 °C-annealed, and f 600 °C-annealed HfO2/Si
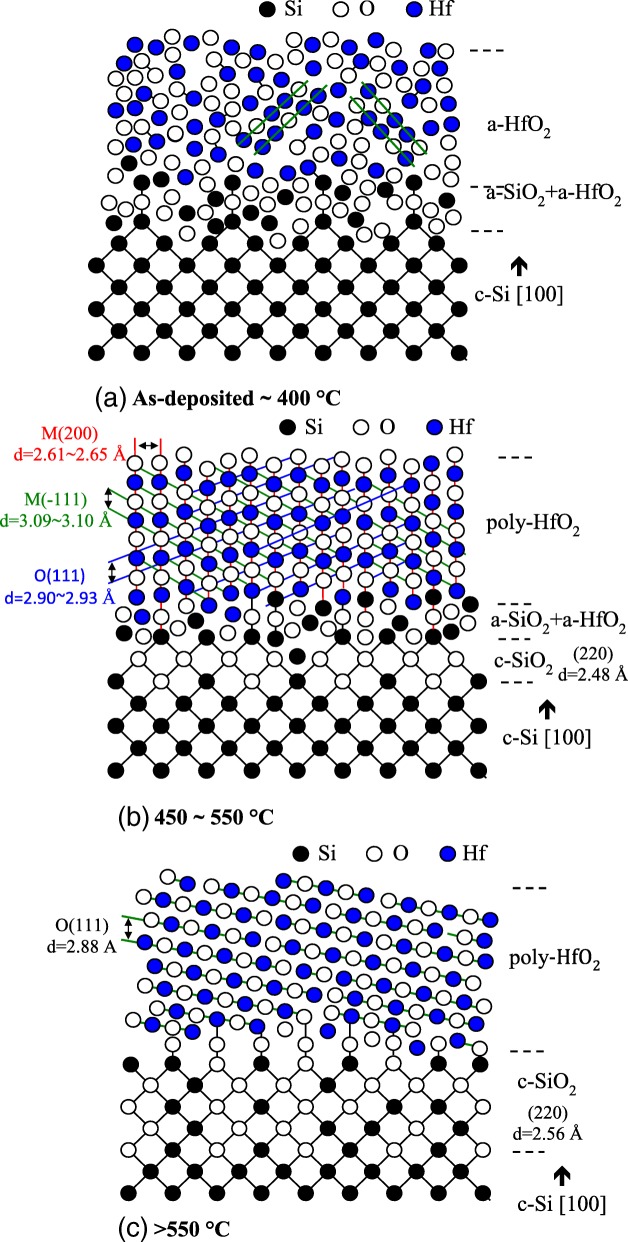
Based on the above results, Fig. 5 illustrates the mechanisms of the HfO2 films with different annealing temperatures. Considering the annealing temperature is smaller than 400 °C (Fig. 5a), the film is amorphous where Hf and O atoms are randomly arranged. The interfacial layer between HfO2 and c-Si wafer is a mixed oxide consisting of a-SiO2 and a-HfO2. At an annealing temperature of 450–550 °C (Fig. 5b), the HfO2 film receives thermal energy leading to a structural change from amorphous to polycrystalline with monoclinic and orthorhombic phases. The crystalline orientation and d-spacing are indicated according to the HR-TEM and GIXRD results. A crystalline SiO2 layer is formed. Several works reported an ordered silicon oxide layer at the interface of a-SiO2 and (100) c-Si, but the mechanism and atomic-scale structure have remained controversial. Silicon thermal oxidation could be regarded as sequential inserting operations of oxygen atoms into Si-Si bonds, and this induces a large accumulation of compressive strains in the oxidized regions and might possibly cause a structural transformation into ordered oxide at the SiO2/c-Si interface [24]. It has also been reported that crystalline oxygen-containing phase could be formed under conditions of high oxygen oversaturation of Si [25] or low interface defect density [26]. From the XPS and TEM images in this work, the HfO2 layer is oxygen deficient. The significant amounts of oxygen diffuse from HfO2 towards silicon substrate, and this might lead to oversaturation of oxygen at the c-Si interface and formation of crystalline SiO2. In this temperature range, the crystalline SiO2 layer thickness would increase but the a-HfO2 + a-SiO2 mixed layer thickness decreases with increasing annealing temperature. At an annealing temperature higher than 550 °C (Fig. 5c), the HfO2 structure is dominated by polycrystalline orthorhombic (111) single phase. The interfacial layer is entirely governed by crystalline SiO2. The d-spacing decreases for orthorhombic HfO2 layer and increases for c-SiO2. Although annealing of HfO2 is necessary for achieving high Si wafer passivation and dielectric constant, at high temperatures, the resultant crystallization of the HfO2 and the interfacial SiO2 may reduce the film properties. The annealing temperature of 500 °C is found to obtain the best dielectric constant of 17.2. Further increasing the annealing temperature leads to a reduction in dielectric constant, possibly due to the change in the crystalline phase. Tomida et al. reported that the dielectric constant of HfO2 decreases when the structure transformed from polycrystalline to monoclinic single phase [27]. The best passivation of HfO2/Si can also be obtained at the annealing temperature of 500 °C, as higher temperatures might lead to a complete c-SiO2 interfacial layer and dehydrogenation at the interface.
Fig. 5.
Diagrams of mechanism of crystallization of HfO2 films and interfacial layer in the temperature ranges a as-deposited to 400 °C, b 450 to 550 °C, and c beyond 550 °C. The d-spacing value and crystalline orientation are also indicated
Conclusion
HfO2 films are prepared using RP-ALD, and effect of annealing temperature on crystalline structure of the HfO2 has been investigated. For as-deposited HfO2 and that annealed below 400 °C, the HfO2 and the interfacial layer are amorphous. With increasing annealing temperature, the d-spacing of orthorhombic reduces while that of the c-SiO2 interfacial layer increases, indicating the oxygen diffusion from HfO2 to Si interface. Annealing temperature higher than 550 °C shows a HfO2 layer with polycrystalline orthorhombic single-phase, and the interfacial layer completely transforms to c-SiO2. Although annealing is required for HfO2 in many applications such as achieving high passivation of Si wafers and high dielectric constant, the crystallization could be harmful to the film properties. The annealing temperature of 500 °C can have the best Si wafer passivation quality and dielectric constant.
Acknowledgments
Funding
This work is sponsored by the Ministry of Science and Technology of Taiwan (nos. 104-2632-E-212-002-, 104-2622-E-212-005-CC3, 104-2221-E-212-002-MY3). This work is also sponsored by the National Natural Science Foundation of China (nos. 61534005 and 61474081), the Science and Technology innovation Project of Xiamen (nos. 3502Z20183054 and 3502Z20173040), and the Science and Technology Program of the Educational Office of Fujian Province (JT180432).
Availability of Data and Materials
All data supporting the conclusions of this article are included within the article.
Abbreviations
- AFM
Atomic force microscopy
- a-HfO2
Amorphous hafnium oxide
- ALD
Atomic layer deposition
- a-SiO2
Amorphous silicon dioxide
- c-SiO2
Crystalline silicon dioxide
- GIXRD
Grazing incident X-ray diffraction
- HfO2
Hafnium oxide
- HR-TEM
High-resolution transmission electron microscopy
- N2
Nitrogen
- O2
Oxygen
- RMS
Root-mean-square
- RP-ALD
Remote plasma atomic layer deposition
- RTA
Rapid thermal annealing
- TEMAH
Tetrakis (ethylmethylamino) hafnium
- XPS
X-ray photoelectron spectroscopy
Authors’ contributions
XYZ carried out the characterization of the HfO2 thin films and drafted the manuscript. CHH, WYW, SLO, and SYL led the experimental and analytical effort. SYC, WH, WZZ, FBX, and SZ contributed to the valuable discussion on experimental and theoretical results. All authors read and approved the final manuscript.
Competing interests
The authors declare that they have no competing interests.
Publisher’s Note
Springer Nature remains neutral with regard to jurisdictional claims in published maps and institutional affiliations.
References
- 1.Wei Y, Xu Q, Wang Z, Liu Z, Pan F, Zhang Q, Wang J, et al. Growth properties and optical properties for HfO2 thin films deposited by atomic layer depositon. J Alloys Compd. 2018;735:1422–1426. doi: 10.1016/j.jallcom.2017.11.222. [DOI] [Google Scholar]
- 2.Cianci E, Lamperti A, Tallarida G, Zanuccoli M, Fiegna C, Lamagna L, Losa S, Rossini S, Vercesi F, Gatti D, Wiemer C, et al. Advanced protective coatings for reflectivity enhancement by low temperature atomic layer deposition of HfO2 on Al surfaces for micromirror applications. Sensors Actuators A. 2018;282:124–131. doi: 10.1016/j.sna.2018.09.028. [DOI] [Google Scholar]
- 3.Stoklas R, Gregusova D, Hasenohrl S, Brytavskyi E, Tajna M, Frohlich K, Hascik S, Mgregor JK, et al. Characterization of interface states in AlGaN/GaN metal-oxide semiconductor heterostructure field-effect transistors with HfO2 gate dielectric grown by atomic layer deposition. Appl Surf Sci. 2018;461:255–259. doi: 10.1016/j.apsusc.2018.05.191. [DOI] [Google Scholar]
- 4.Panigrahi J, Singh VR, Singh PK, et al. Enhanced field effect passivation of c-Si surface via introduction of trap centers: case of hafnium and aluminium oxide bilayer films deposited by thermal ALD. Sol Energy Mater Sol Cells. 2018;188:219–227. doi: 10.1016/j.solmat.2018.08.018. [DOI] [Google Scholar]
- 5.Oudot E, Gros-Jean M, Courouble K, Bertin F, Duru R, Rochat N, Vallee C, et al. Hydrogen passivation of silicon/silicon oxide interface by atomic layer deposited hafnium oxide and impact of silicon oxide underlayer. J Vacuum Sci Technol A. 2018;36:01A116. doi: 10.1116/1.4999561. [DOI] [Google Scholar]
- 6.Polydorou E, Martha B, Drivas C, Seintis K, Sakellis I, Soultati A, Kaltzoglou A, Speliotis T, Fakis M, et al. Insights into the passivation effect of atomic layer deposited hafnium oxide for efficiency and stability enhancement in organic solar cells. J Mater Chem. 2018;6:8051–8059. [Google Scholar]
- 7.Gallais L, Capoulade J, Natoli J-Y, Commandre M, Cathelinaud M, Koc C, Lequime M, et al. Laser damage resistance of hafnia thin films deposited by electron beam deposition, reactive low voltage ion plating and dual ion beam sputtering. Appl Opt. 2008;47(13):C107–C113. doi: 10.1364/AO.47.00C107. [DOI] [PubMed] [Google Scholar]
- 8.Neumayer DA, Cartier E. Materials characterization of ZrO2-SiO2 binary oxides deposited by chemical solution deposition. J Appl Phys. 2001;90(4):1801–1808. doi: 10.1063/1.1382851. [DOI] [Google Scholar]
- 9.Feng L-p, Liu Z-t, Shen Y-m, et al. Compositional, structural and electronic characteristics of HfO2 and HfSiO dielectrics prepared by radio frequency magnetron sputtering. Vacuum. 2009;83:902–905. doi: 10.1016/j.vacuum.2008.08.004. [DOI] [Google Scholar]
- 10.Sokolov AA, Filatova EO, Afanas’ev VV, Yu Taracheva E, Brzhezinskaya MM, Ovchinnikov AA. Interface analysis of HfO2 films on (100) Si using x-ray photoelectron spectroscopy. J Phys D Appl Phys. 2009;42:035308. doi: 10.1088/0022-3727/42/3/035308. [DOI] [Google Scholar]
- 11.Hong M, Wan HW, Chang P, Lin TD, Chang YH, Lee WC, Pi TW, Kwo J, et al. Effective surface passivation of In0.53Ga0.47As(100) using molecular beam epitaxy and atomic layer deposited HfO2 – a comparative study. J Cryst Growth. 2017;477:159–163. doi: 10.1016/j.jcrysgro.2017.04.006. [DOI] [Google Scholar]
- 12.Jeong S, Roh Y. Effects of annealing temperature on the characteristics of HfSixOy-HfO2 films deposited for metal-insulator-metal capacitors by using atomic layer deposition. J Korean Phys Soc. 2007;50(6):1865–1868. doi: 10.3938/jkps.50.1865. [DOI] [Google Scholar]
- 13.Triyoso D, Liu R, Roan D, Ramon M, Edwards NV, Gregory R, et al. Impact of deposition and annealing temperature on material and electrical characteristics of ALD HfO2. J Electrochem Soc. 2004;151(10):F220. doi: 10.1149/1.1784821. [DOI] [Google Scholar]
- 14.García H, Castán H, Dueñas S, Bailón L, Campabadal F, Beldarrain O, et al. Electrical characterization of atomic-layer-deposited hafnium oxide films from hafnium tetrakis (dimethylamide) and water/ozone: effects of growth temperature, oxygen source, and postdeposition annealing. J Vac Sci Technol A. 2013;31(1):01A127. doi: 10.1116/1.4768167. [DOI] [Google Scholar]
- 15.Chaudhary P. Characterization of hafnium oxide film deposited using atomic layer deposition system. Int J Sci Res Eng Technol. 2015;4(8):836–840. [Google Scholar]
- 16.Ho M-Y, Gong H, Wilk GD, Busch BW, Green ML, Voyles PM, et al. Morphology and crystallization kinetics in HfO2 thin films grown by atomic layer deposition. J Appl Phys. 2003;93(3):1477–1481. doi: 10.1063/1.1534381. [DOI] [Google Scholar]
- 17.Shim J, Rivera JA, Bashir R. Electron beam induced local crystallization of HfO2 nanopores for biosensing applications. Nanoscale. 2013;5:10887–10893. doi: 10.1039/c3nr02608f. [DOI] [PMC free article] [PubMed] [Google Scholar]
- 18.Miyata N. Low temperature preparation of HfO2/SiO2 stack structure for interface dipole modulation. Appl Phys Lett. 2018;113(25):251601. doi: 10.1063/1.5057398. [DOI] [Google Scholar]
- 19.Vargas M, Murphy NR, Ramana CV. Structure and optical properties of nanocrystalline hafnium oxide thin films. Opt Mater (Amst) 2014;37:621–628. doi: 10.1016/j.optmat.2014.08.005. [DOI] [Google Scholar]
- 20.Wang Y, Zahid F, Wang J, Guo H. Structure and dielectric properties of amorphous high-κ oxides: HfO2, ZrO2, and their alloys. Phys Rev B. 2012;85:224110. doi: 10.1103/PhysRevB.85.224110. [DOI] [Google Scholar]
- 21.McIntyre P. Bulk and interfacial oxygen defects in HfO2 gate dielectric stacks: a critical assessment. ECS Trans. 2007;11(4):235–249. doi: 10.1149/1.2779564. [DOI] [Google Scholar]
- 22.Nyns L, Ragnarsson L, Hall L, Delabie A, Heyns M, Elshocht SV, et al. Silicon orientation effects in the atomic layer deposition of hafnium oxide. J Electrochem Soc. 2008;155:G9–G12. doi: 10.1149/1.2806093. [DOI] [Google Scholar]
- 23.Kopani M, Milula M, Pincik E, Kobayashi H, Takahashi M, et al. FTIR spectroscopy of nitric acid oxidation of silicon with hafnium oxide very thin layer. Appl Surf Sci. 2018;301:24–27. doi: 10.1016/j.apsusc.2014.01.124. [DOI] [Google Scholar]
- 24.Kageshima H, Uematsu M, Akagi K, Tsuneyuki S, Akiyama T, Shiraishi K. Theoretical study on atomic structures of thermally grown silicon oxide / silicon interfaces. e-Journal Surf Sci Nanotechnol. 2006;4:584–587. doi: 10.1380/ejssnt.2006.584. [DOI] [Google Scholar]
- 25.Afanas V, Stesmans A, Twigg M. Epitaxial growth of SiO2 produced in silicon by oxygen ion implantation. Phys Rev Lett. 1996;77:4206–4209. doi: 10.1103/PhysRevLett.77.4206. [DOI] [PubMed] [Google Scholar]
- 26.Bohra F, Jiang B. Textured crystallization of ultrathin hafnium oxide films on silicon substrate. Appl Phys Lett. 2007;90:161917. doi: 10.1063/1.2724925. [DOI] [Google Scholar]
- 27.Tomida K, Kita K, Toriumi A. Dielectric constant enhancement due to Si incorporation into HfO2. Appl Phys Lett. 2006;89:142902. doi: 10.1063/1.2355471. [DOI] [Google Scholar]
Associated Data
This section collects any data citations, data availability statements, or supplementary materials included in this article.
Data Availability Statement
All data supporting the conclusions of this article are included within the article.


