

Abstract
The aggressiveness and recurrence of glioma are major obstacles for the treatment of this type of tumor. Further understanding of the molecular mechanisms of glioma is necessary to improve the efficacy of therapy. MicroRNAs have been widely studied in many human cancers. Here, we found that miR-940 was one of the primary downregulated miRNAs in clinical samples and glioma cell lines through bioinformatics analysis and qRT-PCR. Upregulating miR-940 expression significantly inhibited the proliferation and invasion and promoted apoptosis of U87 and U118 cells. In addition, experiments in vivo showed that upregulation of miR-940 expression inhibited xenograft growth. Methylenetetrahydrofolate dehydrogenase (MTHFD2), a dual-functional metabolic enzyme, is involved in the one-carbon metabolism of folate in mitochondria. We found MTHFD2 to be overexpressed in glioma tissues and our clinical samples by qRT-PCR and Western blot assays. Through TargetScan prediction and luciferase assays, we found that miR-940 directly targets MTHFD2. Upregulation of miR-940 expression inhibited the expression of MTHFD2 and led to intracellular one-carbon metabolism dysfunction. Furthermore, the antitumor effects of miR-940 could be attenuated by overexpression of MTHFD2. Together, the results of our study suggest that miR-940 may be a new therapeutic target for the treatment of glioma through targeting of MTHFD2.
Keywords: miR-940, proliferation, apoptosis, invasion, MTHFD2, one-carbon metabolism
Introduction
Glioma is the most common type of malignant tumor in the nervous system, and the subtype glioblastoma (GBM) is especially highly invasive and prone to recurrence; approximately twenty-four thousand new glioma cases were reported in America in 2016, and the 5-year survival rate is only 33% [1]. While many new therapeutic approaches such as endocrine therapy, targeted therapy, immunotherapy and oncolytic virotherapy [2] have emerged, surgical resection of the glioma combined with postoperative chemotherapy with temozolomide is still the main clinical treatment strategy. Thus, thorough research on potential therapeutic targets and the molecular mechanisms of glioma is essential to improve therapeutic strategies for malignant gliomas.
MicroRNAs (miRNAs) are small endogenous non-coding RNAs 20~24 nucleotides in length that can regulate various biological processes by downregulating target gene expression [3]. A number of miRNAs have been shown to participate in cell metabolism, apoptosis, autophagy, differentiation, cell cycle progression and other cellular activities by binding to the 3’-untranslated regions (UTRs) of target mRNA sequences to inhibit their translation [4-7]. Recent studies have also demonstrated that abnormal expression of miRNAs is associated with glioma progression. For example, miR-215 can enhance the adaptation of glioma cells to hypoxic environments by targeting KDM1B [8], and overexpression of miR-143 inhibits glycolysis by targeting hexokinase 2 and promotes the differentiation of GBM stem-like cells [9]. miR-940 has been identified as a multifunctional miRNA. In the bone metastatic microenvironment, miR-940 promotes the osteogenic differentiation of human mesenchymal stem cells via targeting ARHGAP1 and FAM134A [10]. miR-940 induces DNA damage and inhibits tumorigenesis by decreasing the expression of nestin, a human nasopharyngeal carcinoma intermediate filament protein [11]. It also inhibits the invasion and migratory potential of cells in prostate cancer and triple-negative breast cancer by targeting MIEN1 [12,13].
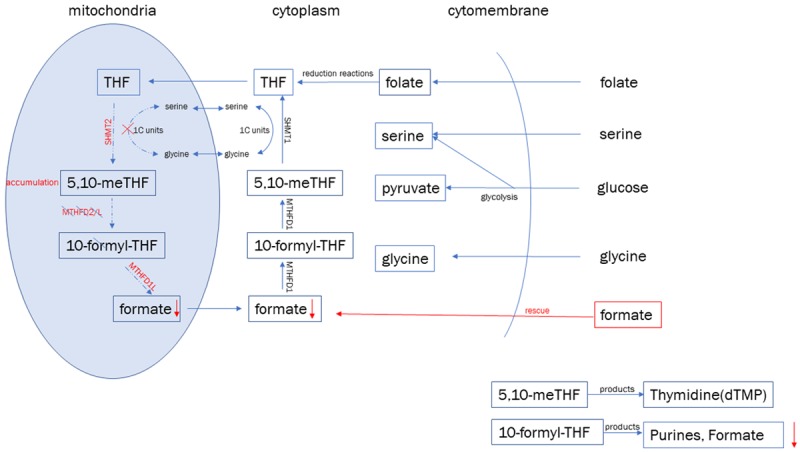
Bifunctional methylenetetrahydrofolate dehydrogenase/cyclohydrolase (MTHFD2), also named NMDMC, is a NAD-dependent bifunctional enzyme located in mitochondria that has dehydrogenase and cyclohydrolase activity [14]. During the process of one-carbon metabolism in mammals, one-carbon units are derived mainly from serine and glycine, but the conversion of serine to glycine also releases one-carbon units. A recent study has shown that tumor cells rely more on serine than on glycine to support growth and metabolism [15]. Folate is reduced twice to form tetrahydrofolate (THF), and then one-carbon units bind to THF with the aid of the enzyme hydroxymethyl transferase 2 (SHMT2) to form 5,10-methylene-THF (5,10-meTHF), which enters the mitochondria and participates in the metabolic cycle. In the mitochondria, MTHFD2 catalyses the conversion of 5,10-meTHF to 10-formyl-THF, which is converted to formate by the enzyme MTHFD1 and is released into the cytoplasm (Figure 1). After that, thymine synthase (TYMS) converts deoxyuridine monophosphate (dUMP) into deoxythymine monophosphate (dTMP) with 5,10-meTHF, and 10-formyl-THF is used for purine synthesis; the newly synthesized pyrimidines and purines are used to maintain cell proliferation [16-19]. Recent studies have demonstrated that knockdown of MTHFD2 in acute myeloid leukaemia (AML) cells can decrease cell growth and cause apoptosis and is thus a new drug target for AML treatment [20]. Previous studies have demonstrated that MTHFD2 is upregulated in cancer cells and is expressed in embryonic cells but is not expressed in adult and normal proliferative cells [14,21-23]. Gene expression and bioinformatics analysis have demonstrated that MTHFD2 is highly expressed in glioma [24,25]. However, no research has been performed on the relationship between high expression of MTHFD2 and glioma.
Figure 1.

A brief one - carbon metabolic cycle. Exogenous folate was reduced twice to form THF to provide a carrier for a carbon unit, SHMT1/2 converted serine to glycine and provided one-carbon units. In the mitochondria, MTHFD2 catalyses the conversion of 5,10-meTHF to 10-formyl-THF, which were the substrates for the synthesis of purines and pyrimidines in cells.
In this study, we found that miR-940 was downregulated in 39 clinical glioma cases and in glioma cell lines. In addition, upregulation of miR-940 induced G1 arrest, promoted apoptosis, and significantly reduced proliferation in glioma cells, Bioinformatics assays revealed that MTHFD2 is a direct target of miR-940. Restoring the expression of MTHFD2 can partly reverse the effects of miR-940 on cell proliferation, invasion and apoptosis. These results demonstrate that miR-940 regulates glioma progression by targeting MTHFD2 and may be a novel biomarker.
Materials and methods
Human tissues and clinical samples
A total of 34 human glioma cases (18 grade II, 7 grade III and 9 grade IV) and 5 normal brain tissue (NBT) samples (from patients with brain trauma) were obtained from the Department of Neurosurgery at the First Affiliated Hospital of Nanjing Medical University. All samples were acquired with the consent of the patients and their family members. The studies using human glioma tissues and NBTs were approved by the ethics committee of Nanjing Medical University. After surgical resection, the glioma samples were stored frozen in liquid nitrogen. Microarray miRNA expression (525 glioma, 5 normal) and mRNA expression (161 glioma, 5 normal) databases were download from the Cancer Genome Atlas (TCGA) data portal (https://cancergenome.nih.gov/). miRNA and mRNA database for 158 gliomas were downloaded from the Chinese Glioma Genome Atlas (CGGA) (http://www.cgga.org.cn/portal.php).
Cell culture and reagents
The human glioma cell lines U87, U251, U118, LN229, T98G, N3 and normal human astrocytes (NHAs) were purchased from the Chinese Academy of Sciences Cell Bank (Shanghai, China). The glioma cell lines were cultured in Dulbecco’s modified Eagle’s medium (DMEM; Gibco, USA) with 10% foetal bovine serum (FBS) and 1% penicillin/streptomycin. NHAs were cultured in high-glucose DMEM (H-DMEM) with recombinant human EGF (rhEGF), insulin, ascorbic acid, gentamicin sulphate/amphotericin (GA-1000), L-glutamine and 5% FBS. All the cells were incubated at 37°C in a humidified atmosphere with 5% CO2.
For the folate sensitivity experiment, cells were cultured in RPMI 1640 medium (no folate; Gibco) with 10% FBS (Gibco) and 1% penicillin/streptomycin. U87 and U118 cells were seeded in 24-well plates at a density of 2.5×10⁵ cells.
For the formate rescue experiment, cells were cultured in RPMI 1640 medium (no folate; Gibco) with 10% dialysed FBS (dFBS) and 1% penicillin/streptomycin. The medium was replaced with 10 mM formate-supplemented medium (Sigma-Aldrich) every 2 days from day 6 to day 12.
For the glycine dependence experiment, cells were cultured in RPMI 1640 medium with 10% dFBS (Gibco) with or without glycine (140 μM). U87 and U118 cells were seeded in 96-well plates at a density of 1×10⁴ cells.
Viability assays
For assessment of growth, cells were seeded in 24-well plates, and viable cells were counted based on Trypan blue exclusion. The cells were stained at room temperature for 3-5 minutes. Then, a drop of cell suspension was added to a slide, and the number of living cells and dead cells among 1000 cells was determined under a microscope. Cell viability was calculated according to the following formula: Cell viability (%) = number of unstained cells/total number of cells observed * 100.
miRNAs, plasmid construction and transfection
miR-940 mimic, miR-940 negative control (miR-NC), miR-940 inhibitor and miR-940 inhibitor negative control (miR-NC-IN) were purchased from GenePharma (Shanghai, China). The MTHFD2 overexpression plasmid pcDNA3.1-MTHFD2 (MTHFD2) and empty pcDNA3.1 plasmid (vector) were also purchased from GenePharma (Shanghai, China). All transfections were conducted using Lipofectamine 3000 Transfection Reagent (Invitrogen, Thermo Fisher, USA) according to the manufacturer’s instructions.
Lentivirus packaging and establishment of stable cell lines
The lentiviral vectors were constructed by GeneChem (Shanghai, China). Lentiviruses carrying miR-940 and miR-NC were packaged in 293T cells and collected according to the manufacturer’s instructions. U87 and U118 cells were transfected with lentivirus (MOI=50) for 12 h. The transfection efficiency was determined by quantitative real-time PCR (qRT-PCR) (after 48 h), Western blot (after 72 h) and fluorescence microscopy of green fluorescent protein (after 24-48 h), Stable U87 and U118 cell lines were screened with puromycin for 7 days.
RNA isolation and quantitative real-time PCR (qRT-PCR)
Total RNA was extracted from cells and human tissues by using TRIzol (Invitrogen). cDNA was obtained by using a reverse transcription kit (Takara). qRT-PCR was performed using SYBR Premix Ex Taq (Takara, Japan) on a 7900HT system (Applied Biosystems, ABI, USA). GAPDH was used as an endogenous control. All fold changes were calculated with the relative quantification method (2-ΔΔCt). The following primers were used: MTHFD2, forward: 5’-CAGCTGCAGTTGTGGGAAT-3’, reverse: 5’GGAGGCCATCTACATTATCATCA-3’; GAPDH, forward: 5’AGGTCGGTGTGAACGGATTC-3’, reverse: 5’-TGTAGACCATGTAGTTGAGGTCA-3’.
Gas chromatography-mass spectrometry (GC-MS)
The cells were collected after centrifugation, and 1 μg of p-aminobenzoic acid was added as an internal standard. The cells were placed in 1 ml of solution (1:2:0.8 chloroform: methanol: water) for 1 minute, and then the mixture was oscillated with ultrasound for 5 minutes. The supernatant was extracted after centrifugation at 3000 rpm for 5 minutes; then, 4.5 ml of water and 4.5 ml of chloroform were added to the supernatant and mixed. The mixture was held at 4°C for 1 h, and the upper layer was freeze-dried and dissolved in 1 ml of hydrochloric acid (6 mol/L) at 30°C for 2 h. Yellow amino acid crystals were obtained after drying under nitrogen flow. The crystals were placed into a vacuum oven and dried at 50°C for 30 minutes to ensure that the amino acid crystals did not contain any water. Then, 0.5 ml of pyridine was added to the crystals, and the mixture was shaken for 10 minutes. Finally, the crystals were silylated in 0.5 ml of N-tert-butyldimethylsilyl-N-methyltrifluoroacetamide (MTBSTFA) with 1% tert-butyldimethylchlorosilane (t-BDMCS) (Sigma) at 60°C for 30 minutes.
The derivatives were analyzed by GC-MS (7890A gas chromatograph and 5975C mass spectrometer, Agilent) with a 30 m DB-5 MS capillary column and a 10 m DuraGuard column. The specific protocol followed the Agilent Fiehn Library method [26]. Sample separation was carried out with continuous high-purity (99.99%) helium flow (1 ml/min), a 70 eV electron impact (EI) source, an ion source temperature of 230°C, an interface temperature of 290°C, and a scan range of 50-600 amµ.
Metabolites were assigned using the Agilent Fiehn Library with the Automated Mass Spectral Deconvolution and Identification System (AMDIS) deconvolution program. The Fiehn library was used for total ion chromatography (TIC). Metabolites with probabilities greater than 80% were selected, and the quantitation ion for each metabolite was taken from the Fiehn library [26].
Protein extraction, immunoblotting and antibodies
Tissues were first ground with liquid nitrogen, and cells and tissue fragments were lysed on ice for 30 minutes in lysate buffer (RIPA; Beyotime, Nanjing, China) with 1% phenylmethylsulfonyl fluoride (1 mM). The lysates were centrifuged at 12000 rpm at 4°C for 15 minutes, the supernatants were collected, and protein concentrations were determined using a bicinchoninic acid assay (KeyGen Biotech, Jiangsu, China). The supernatants were mixed with 5×SDS at a 4:1 ratio and were incubated at 100°C for 10 minutes. Then, the proteins (20 μg) were separated with SDS-polyacrylamide gels (12% separation gels) and transferred to polyvinylidene fluoride (PVDF) membranes (Millipore, USA). The PVDF membranes were blocked with 10% skim milk (skim milk dissolved in TBST) for 2 h at room temperature. The MTHFD2 (ab151447, 1:2000), MTHFD1L (ab229708, 1:1000), SHMT2 (ab180786, 1:500) and β-tubulin (ab6046, 1:500) antibodies were purchased from Abcam.
Dual luciferase reporter assay
The 3’-UTR of MTHFD2 was inserted into the Spel and Hind III (Takara) sites of miRNA luciferase reporter vector (GeneChem, Shanghai, China). U87 and U118 cells were seeded in 24-well plates and co-transfected with wild-type (WT) or mutant (Mut) reporter plasmids. A Dual Luciferase Reporter Assay Kit (Promega) was used to conduct luciferase assays 24 h after transfection according to the manufacturer’s instructions. Each of samples was assayed in triplicate.
Cell proliferation assay
For the Cell Counting Kit-8 (CCK-8) assay, U87 and U118 cells were seeded in 96-well plates, and then the cells were cultured for 24, 48, 72 and 96 h. CCK-8 solution (Beyotime, China) was added to the 96-well plates, and the plates were incubated for 1 h. Then, the absorbance (optical density, OD) at 450 nm was determined to calculate cell viability.
For the colony formation assay, U87 and U118 cells were seeded in six-well plates (200 cells/well) and cultured for 10 days until colony formation was observed. The colonies were fixed with methanol for 30 minutes and dyed with 1% crystal violet for 2 h (Beyotime, China). The colony formation rate was used to determine cell proliferation.
For the 5-ethynyl-2-deoxyuridine (EdU) proliferation assay, U87 and U118 were seeded in 24-well plates 48 h after transfection. An EdU imaging kit (Life Technologies) was used to visualize newly synthesized DNA and thus to analyze cell proliferation. The number of positive cells was determined under a fluorescence microscope.
Transwell invasion assay
The invasion ability of U87 and U118 cells was determined by using transwell chambers with 8 µm-pore polycarbonate membrane inserts on the bottoms of 24-well plates (Corning, USA). For the invasion assay, chambers were coated with 45 µl of Matrigel (1:8 dilution; BD Biosciences, USA) for 24 h and dried at room temperature for 24 h. U87 and U118 cells were plated in the chamber at a density of 1×10⁴ cells and cultured with 200 µl of FBS-free medium in the upper chamber; 500 µl of culture medium containing 10% FBS was placed in the lower chamber. Then, the chambers were incubated for 48 h at 37°C in a 5% CO2 incubator. The cells were fixed with formaldehyde for 30 minutes, and the cells in the upper chamber were removed with a swab. The cells in the lower chamber were stained with 1% crystal violet for 1 h. The number of invaded cells was counted in a randomly selected field of view under a microscope to determine the invasion ability of the cells.
Flow cytometric analysis of cell cycle distribution and apoptosis
U87 and U118 cells transfected with miR-940 mimic, miR-NC or empty plasmids for 48 h were seeded in 6-well plates, for cell cycle distribution analysis. The cells were collected by centrifugation for five minutes at 1500 rpm and washed in 70% alcohol overnight. The supernatant was removed after centrifugation at 1500 rpm for 5 minutes, and the cells were stained using a Cell Cycle Staining Kit (Beyotime, China) for 30 minutes in the dark before being analyzed by flow cytometry. For apoptosis analysis, U87 and U118 cells in six-well plates were digested by trypsin without EDTA. The cells were collected, washed twice with PBS (2000 rpm for 5 minutes), and suspended with 500 µl of binding buffer. The suspension was mixed with 5 μl of Annexin V-EGFP and 5 μl of propidium iodide (PI). The mixture was incubated at room temperature in the dark for 15 minutes. Finally, flow cytometry was used to detect the ratio of apoptotic cells.
Immunohistochemistry (IHC)
To detect MTHFD2 expression, clinical tissue samples and mouse subcutaneous tumors were embedded with paraffin. After dewaxing and xylene rehydration, the antigens were recovered. Endogenous peroxidase activity was blocked with 3% hydrogen peroxide (H2O2). The main antibodies were MTHFD2 (ab151447, 1:100) and Ki-67 (ab156956, 1:150).
Fluorescence in situ hybridization (FISH)
miR-940 probes (green-labelled; Servicebio, Wuhan, China) were used to identify the expression of miR-940 in clinical glioma and normal samples. First, the slides were cleaned with 1% HCl in 70% ethanol, dried and coated with poly-L-lysine. The tissues were fixed with 4% paraformaldehyde for 3 h or more and washed with a 1:1 solution of PBS and ethanol. Second, the tissue samples were mounted on the slides and dried in an oven at 46°C for 10 minutes. The slides were then immersed in 50%, 80% and 96% ethanol solutions for 3 minutes each and incubated with 10 μl of hybridization buffer and 1 μl of probe at 46°C for 1.5 h. Finally, the tissues were washed with wash buffer at 46°C and observed under a fluorescence microscope, the fluorescence intensity of FISH was analyzed by Image J.
TUNEL apoptosis assay
U87 and U118 cells were seeded in 24-well plates. The cells were fixed with 4% paraformaldehyde for 30 minutes, incubated with 0.1% Triton-X PBS for 2 minutes at 4°C, and then covered with 50 μl of TUNEL (Beyotime, China) assay solution (2 μl of TdT enzyme with 48 μl of fluorescence-labelling solution) per well. The nuclei of early apoptotic cells were labelled red. The positive cells were detected by fluorescence microscopy to determine the number of apoptotic cells.
Subcutaneous heterotopic xenograft assay
Male BALB/c nude mice (5 weeks old) were purchased from the Beijing Vital River Laboratory Animal Technology Co. Mice were subcutaneously implanted with 1×10⁶ U87 cells (pretreated with lentivirus containing miR-940 or miR-NC) bilaterally in the axillary lymph nodes. After 7 days of subcutaneous implantation, the tumor volume was measured every 5 days until day 37 (formula: volume = width2 * length/2; units: mm3). The mice were sacrificed on day 37. All procedures involving experimental animals were performed under the guidelines of the animal ethics committee of Nanjing Medical University.
Statistical analysis
Data from three independent experiments are expressed as the mean ± s.e.m. Student’s t-test or one-way analysis of variance (ANOVA) was used to compare means. Correlations between miR-940 expression and MTHFD2 levels in glioma tissues were analyzed using Spearman’s correlation analysis. The relevant data were analyzed with GraphPad 6.0 or SPSS 17.0. Differences between samples were considered significant at P<0.05.
Results
miR-940 expression negatively correlates with glioma grade
First, we analyzed the expression of miR-940 in glioma tissues through the TCGA (5 normal and 530 glioma tissues) and CGGA (61 grade II, 33 grade III, and 64 grade IV samples) databases. miR-940 expression was significantly lower in glioma tissues than in normal tissues (Figure 2A, P<0.0001). Moreover, miR-940 expression was negatively correlated with glioma grade (Figure 2B, grade II vs grade III, grade II vs grade IV, and grade III vs grade IV, P<0.0001). We next quantified the expression of miR-940 in 39 cases (5 NBT samples from traumatic brain injury and 34 glioma tissue samples including 18 grade II, 7 grade III and 9 grade IV samples). miR-940 was downregulated in the glioma tissue samples compared with the NBT samples (Figure 2C, NBT vs grade II, P<0.001; grade II vs grade III, P=0.1675; grade III vs grade IV, P<0.01). Then, FISH analysis also confirmed that miR-940 was downregulated in glioma tissues (Figure 2D and 2E). Finally, we found that miR-940 expression was downregulated in glioma cells compared to NHAs by qRT-PCR (Figure 2F). Our results suggest that miR-940 might play an important role in the occurrence and progression of glioma.
Figure 2.
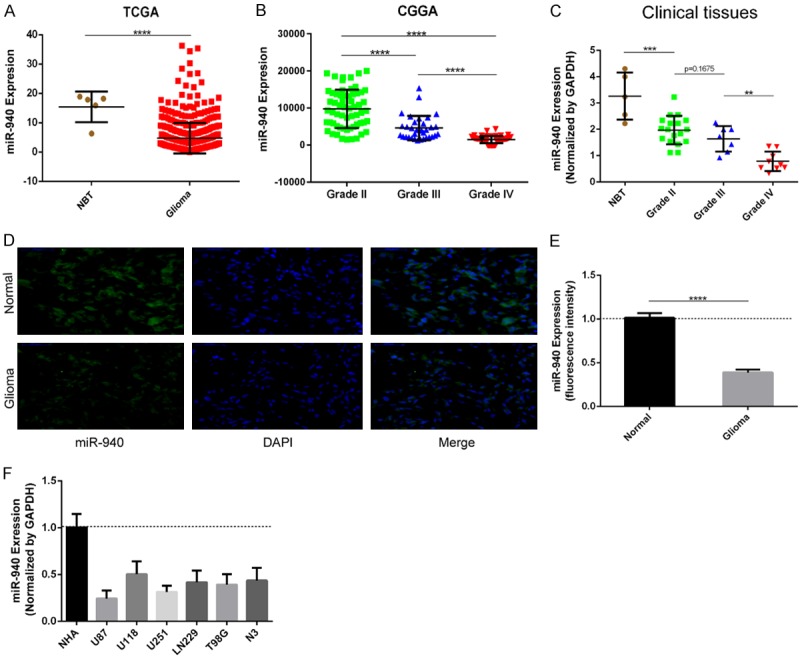
Expression of miR-940 in glioma tissues, clinical samples and glioma cell lines. A. The relative expression of miR-940 was determined in samples from the TCGA database (normal tissues, n=5; glioma tissues, n=530). P<0.0001. B. miR-940 expression negatively correlates with glioma grade in the CGGA dataset. P<0.0001. C. miR-940 levels were analyzed in a clinical database (5 NBT samples from traumatic brain injury and 34 glioma tissue samples (18 grade II, 7 grade III and 9 grade IV tissues)). D, E. miR-940 expression was lower in glioma tissue than in NBT as determined by FISH (Normal vs Glioma, P<0.0001) (scale bars, 50 μm). F. qRT-PCR analysis of miR-940 expression in different cell lines (NHAs and six glioma cell lines). The data are expressed as the mean ± s.e.m.
Upregulation of miR-940 expression inhibits proliferation in glioma cells
Decreased miR-940 expression in glioma cells was observed through analysis of TCGA, CGGA and clinical databases. To investigate the effects of miR-940 on glioma cell proliferation, U87 and U118 cells were transfected with miR-NC, miR-940 mimic, miR-NC-IN or miR-940 inhibitor. The transfection efficiency was determined by qRT-PCR, the results of which confirmed that miR-940 expression was significantly increased or decreased relative to that in the miR-NC groups after 48 h of transfection with mimic or inhibitor respectively (Figure 3A). CCK-8 experiments showed that miR-940 overexpression significantly inhibited cell proliferation in U87 and U118 cells. However, downregulation of miR-940 did not significantly promote tumor cell proliferation in U87 and U118 cells (Figure 3B). The results of the colony formation assay were similar to the results of the CCK-8 assay; the number of colonies in the miR-940 mimic groups were much lower than those in the miR-NC groups, but such an obvious difference was not observed between the miR-NC-IN and miR-940 inhibitor groups (Figure 3C and 3D). Downregulating the expression of miR-940 failed to significantly improve the proliferation of U87 and U118 cells, possibly due to the low original expression of miR-940 in glioma cells. Considering the clear inhibition of cell proliferation upon miR-940 overexpression, we investigated whether cells were arrested in a certain cell cycle phase after transfection. Flow cytometry analysis showed that the proportion of cells in G1 phase increased in the miR-940 mimic groups of U87 and U118 cells after 72 h of transfection, while the proportion of cells in S phase and G2/M phase decreased (Figure 3E and 3F). The decreased number of cells in S phase indicated that most of the glioma cells experienced cell cycle arrest in the G1 phase and could not enter the S phase. To further verify these results, we examined the role of miR-940 in cell proliferation by EdU assay. A lot of cells in the miR-940 mimic groups could not enter the S phase, so they failed to complete DNA replication. The percentage of positive cells in the miR-940 mimic groups was significantly lower than that in the miR-NC groups for both U87 and U118 cells (Figure 3G and 3H). In conclusion, miR-940 strongly inhibits proliferation by promoting G1 phase arrest in glioma cells.
Figure 3.

In vitro, overexpression of miR-940 inhibits glioma proliferation. A. miR-940 expression was analyzed by qRT-PCR after U87 and U118 cells were transfected with miR-940 mimic, miR-940 inhibitor or corresponding negative controls (miR-NC or miR-NC-IN, respectively). B. Cell proliferation was analyzed by CCK-8 assay after 24, 48, 72, and 96 h (U87, miR-NC-IN vs miR-940 inhibitor, P=0.25; U118, miR-NC-IN vs miR-940 inhibitor, P=0.16) (three repeated experiment with 3 replicate wells per group per experiment). C, D. Cell proliferation was analyzed by colony formation assay. The data were analyzed with GraphPad (three repeated experiments with six samples per experiment). E, F. Cell cycle distribution assays were performed in U87 and U118 cells by flow cytometry 48 h after transfection. G, H. The proliferation of cells transfected with miR-NC or miR-940 mimic was detected by EdU assay; scale bar =50 μm (three repeated experiments with six samples per experiment). All data are expressed as the mean ± s.e.m.
Upregulation of miR-940 expression promotes apoptosis and suppresses invasion in glioma cells
Twenty-four hours after transfection, a few cells were found floating in the medium, and there were more floating cells in the miR-940 mimic groups than in the miR-NC groups. This finding prompted us to further study the effect of miR-940 on apoptosis in glioma cells. TUNEL staining was performed on U87 and U118 cells, and the results showed that there were many more positive cells in the miR-940 groups than in the miR-NC groups (Figure 4A and 4B). Overexpression of miR-940 promoted glioma cell apoptosis (Figure 4C and 4D). Transwell assays showed that upregulation of miR-940 expression also inhibited the invasion of U87 and U118 cells (Figure 4E and 4F). Collectively, these results suggest that upregulation of miR-940 expression promotes glioma cell apoptosis and inhibits invasion. Based on these findings, miR-940 may act as an anti-oncogene in glioma cells.
Figure 4.
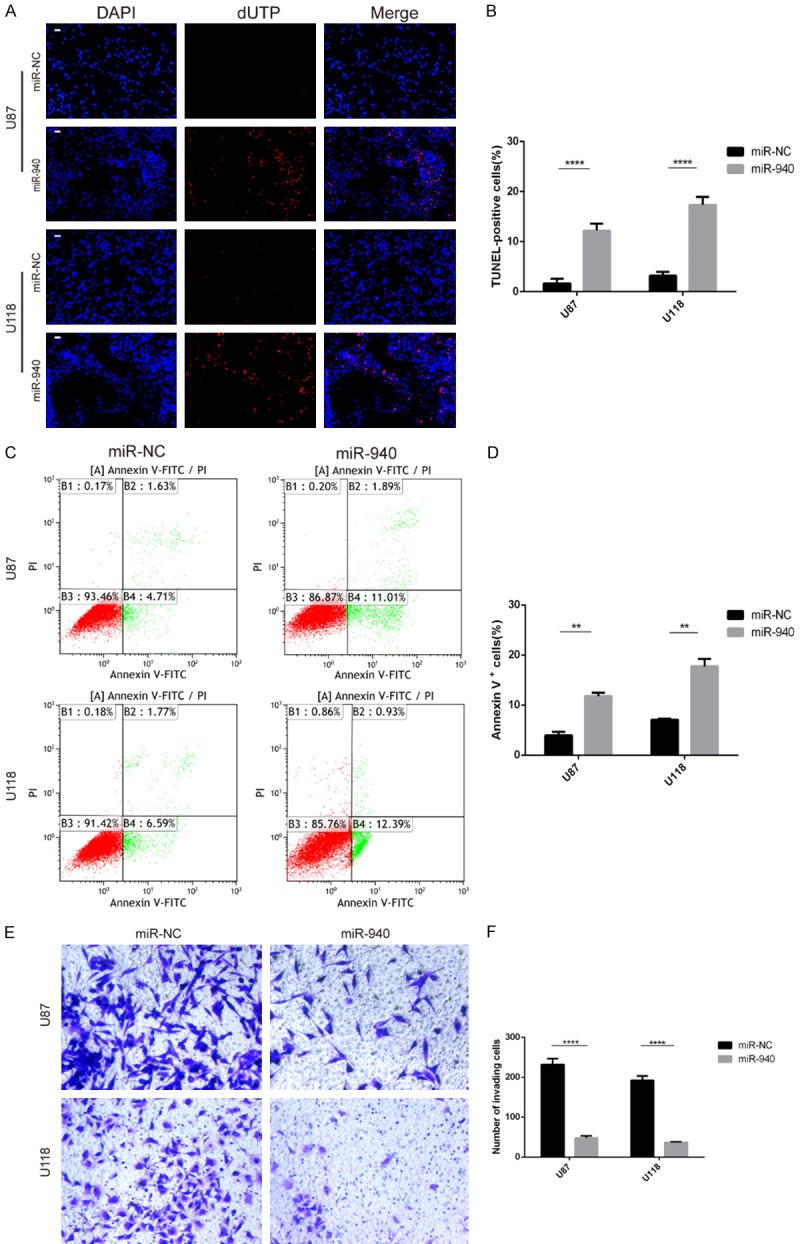
Upregulation of miR-940 expression promoted apoptosis and suppressed invasion in glioma cells. A, B. Apoptosis of U87 and U118 cells was examined by TUNEL assay (three repeated experiments with three samples were experiment). The nuclei labelled with red fluorescence represent early apoptotic cells. C, D. Flow cytometry was used to detect the proportion of apoptotic cells (three repeated experiments with three samples per experiment). E, F. Transwell assays showed the cell invasion ability of U87 and U118 cells. Magnification: 200×. All data are expressed as the mean ± s.e.m.
MTHFD2 is a direct target of miR-940 in glioma cells
MTHFD2 was predicted to be a direct target of miR-940 in TargetScan, miRWalk and miRDB. We analyzed the expression of MTHFD2 in glioma tissues from TCGA and found that expression of MTHFD2 was significantly greater in glioma tissues than in normal tissues (Figure 5A). In addition, MTHFD2 expression in clinical samples as determined by qRT-PCR was similar that reported in TCGA (Figure 5B). MicroRNAs suppress transcription or cause mRNA degradation by binding to the 3’-UTRs of their target mRNA molecules. Luciferase reporter assays were performed to confirm whether MTHFD2 was the direct target of miR-940 in glioma cells (Figure 5C and 5D). Luciferase activity was decreased after transfection of cells with WT vectors and miR-940 mimics. Furthermore, fluorescence intensity was also decreased in cells transfected with plasmids containing the MTHFD2 3’-UTR mutated in binding site 2, site 3 and site 23 but not in cells transfected with site 1 or site 13 mutants (Figure 5E and 5F). These results suggest that miR-940 binds mainly to site 1 (1611-1617) of the MTHFD2 3’-UTR. Next, we measured the expression of MTHFD2 in different glioma cell lines by Western blotting and qRT-PCR. The results showed that MTHFD2 expression was higher in glioma cells than in normal cells (NHAs) (Figure 5G and 5H). Furthermore, an inverse correlation between MTHFD2 and miR-940 expression was found in our 34 clinical glioma samples (Spearman r=-0. 5248, P=0.0014; Figure 5I). Finally, the IHC results for the 34 clinical glioma cases showed that MTHFD2 expression levels were positively correlated with glioma grade (Figure 5J).
Figure 5.
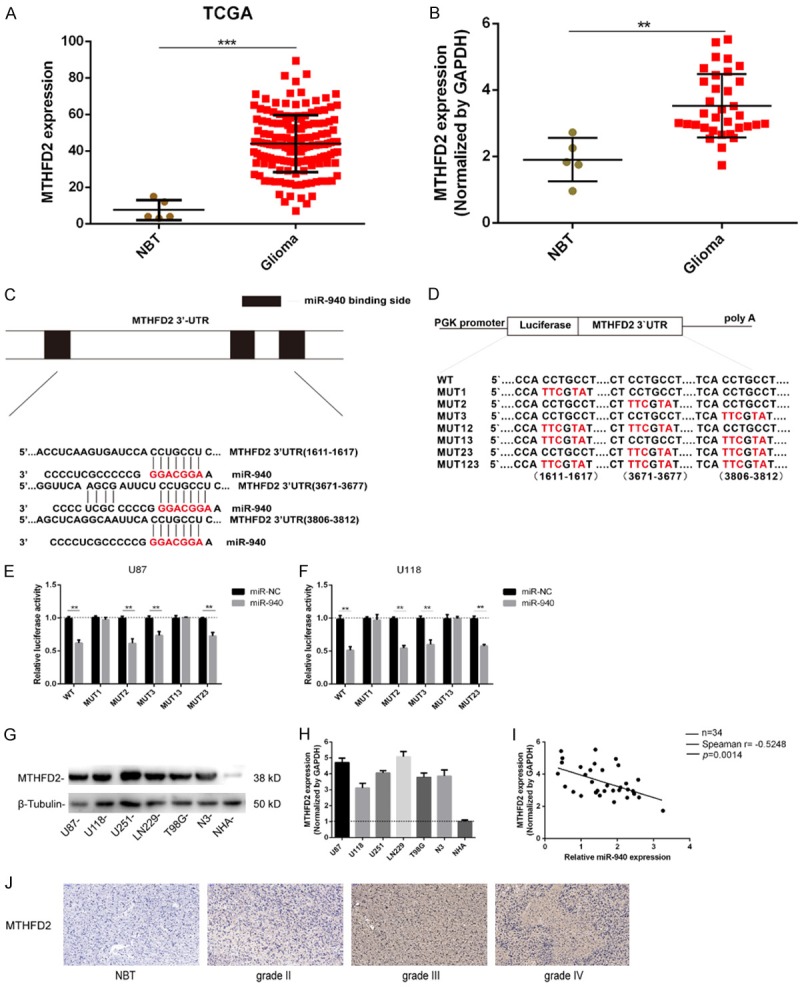
miR-940 directly targets MTHFD2 and negatively regulates its gene expression. A. Relative expression data for MTHFD2 was download from the TCGA database (normal tissues, n=5; glioma tissues, n=530). P<0.0001. B. The expression levels of MTHFD2 in the clinical database (5 NBT samples from traumatic brain injury and 34 glioma tissue samples). C. Predicted miR-940 target sequences in the MTHFD2 3’-UTR. D. Construction of WT and Mut 3’-UTR reporter plasmids. E, F. Luciferase reporter assays were used to assess U87 and U118 cells cotransfected with WT or Mut 3’-UTR reporter plasmids and miR-NC or miR-940 mimic. G. The expression of MTHFD2 in different glioma cell lines and NHAs was determined by Western blotting and normalized to the expression of β-tubulin. H. The expression of MTHFD2 in the cell lines was determined by qRT-PCR and normalized by GAPDH. I. Spearman’s correlation analysis of the expression of miR-940 and MTHFD2 in 34 clinical glioma cases. Spearman r=-0.5248, P=0.0014. J. The expression of MTHFD2 in normal and glioma tissues was analyzed by IHC; scale bar =50 μm. The data are expressed as the mean ± s.e.m.
Overexpression of MTHFD2 reduces the inhibitory effects of miR-940 on U87 glioma cells
To further verify that MTHFD2 was the direct target of miR-940, we transfected U87 cells with MTHFD2 overexpression plasmids (pcDNA3.1-MTHFD2) or empty pcDNA3.1 plasmids (vector). The transfection efficiency was detected by Western blotting and qRT-PCR. MTHFD2 expression was higher in the miR-940+MTHFD2 groups than in the negative control groups (miR-940+vector). MTHFD2 suppression caused by miR-940 was reversed by introduction of MTHFD2 overexpression plasmids (Figure 6A and 6B). To further confirm the rescuing effects of MTHFD2, more experiments on cell proliferation, cell cycle progression, apoptosis and invasion were conducted (Figure 6C-K). Notably, a previous study has shown that MTHFD2 upregulates the expression of vimentin and promotes the migration and invasion of breast cancer [27]. In the current study, proliferation and invasion potential were increased and apoptosis was decreased in miR-940+MTHFD2 U87 cells. Cell G1 phase arrest was also relieved in the miR-940+MTHFD2 groups. Again, these results suggest that MTHFD2 is a functional target of miR-940 in U87 cells.
Figure 6.

Overexpression of MTHFD2 reduces the inhibitory effect of miR-940 on glioma cells. A, B. U87 cells overexpressing miR-940 were transfected with pcDNA3.1 vector plasmids containing MTHFD2 (miR-940+MTHFD2) or with empty plasmids (miR-940+vector). The transfection efficiency was determined by qRT-PCR and Western blotting. C-E. The cell viability of U87 cells was evaluated by CCK-8 assay and colony formation assays 48 h after plasmid transfection (miR-940+MTHFD2 vs miR-940+vector, ***P<0.001). F-I. Cell cycle progression and apoptosis were evaluated in U87 cells by flow cytometry 48 h after transfection. J, K. Transwell assays were performed to examine the effect of MTHFD2 upregulation on cell invasion in miR-940 overexpression U87 cells (***P<0.01). The data are shown as the mean ± SD.
Overexpression of miR-940 affects the one-carbon metabolic pathway in glioma cells
Suppression of MTHFD2 has been reported to inhibit one-carbon metabolism in breast cancer and AML [20,28]. Similarly, depletion of MTHFD2 disrupted the one-carbon metabolic pathway in the two glioma cell lines in this study. After transfection of the cells with miR-940 for 48 h, the expression of MTHFD2 and its related metabolic enzymes SHMT2 and MTHFD1L was decreased (Figure 7A). SHMT2 is responsible for converting serine into glycine in mitochondria. Therefore, intracellular serine accumulated in large quantities and glycine decreased due to the loss of SHMT2 (Figure 7B). Impaired conversion of serine to glycine leads to greater reliance on exogenous glycine for cell proliferation; correspondingly, cell proliferation was significantly inhibited in the culture medium without glycine (miR-940 glycine-) (Figure 7C). The other related enzyme, MTHFD1L, is responsible for converting 10-formyl-THF to formate [29]. Endogenous formate levels were reduced after suppression of MTHFD1L, and cells showed poor tolerance to folate-free culture medium. Cell viability decreased more rapidly in the folate-free groups than in the control groups and could not be rescued by adding exogenous folate (Figure 7D and 7E).
Figure 7.
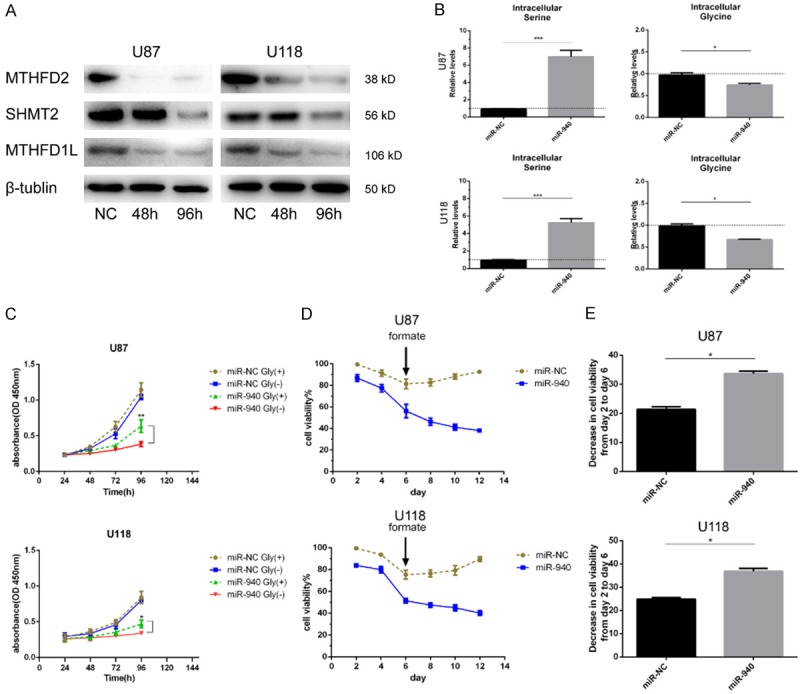
Cells are more dependent on exogenous glycine and are more sensitive to folate deficiency after suppression of MTHFD2. A. U87 and U118 cells were transfected with miR-NC or miR-940 mimic, and the expression of MTHFD2, SHMT2 and MTHFD1L was measured by Western blotting. B. After 96 hours of transfection, intracellular serine and glycine levels were determined by GC-MS (three replicates). C. After 48 hours of transfection, U87 and U118 cells were seeded into 96-well plates with medium containing glycine (glycine+) or not containing glycine (glycine-). Cell proliferation was detected by CCK-8 assay. D. After 2 days of transfection, cells were cultured in folate-free 1640 medium until day 6. The culture medium was replaced every 2 days with medium containing formate (10 mM). Cell viability was not rescued by the addition of formate in the miR-940 mimic group from day 6 to day 12. Cell viability was assayed by trypan blue exclusion according to the equation cell viability (%) = number of unstained cells/total number of cells observed * 100. E. In folate-free culture medium (day 2 to day 6), cell viability decreased faster in the miR-940 mimic groups than in the negative control groups. All data are shown as the mean ± SD of three replicates. *P<0.05, **P<0.01, and ***P<0.001.
miR-940 inhibits glioma xenograft growth in vivo
Although we confirmed the effect of miR-940 overexpression on tumors in vitro, it was necessary to further confirm that the function of miR-940 is the same in vivo. Therefore, we subcutaneously injected U87 cells into the bilateral axillary lymph nodes of nude mice to establish a xenograft model (n=5). U87 cells transfected with miR-NC were injected on the left side, and cells transfected with miR-940 mimic were injected on the right (Figure 8A). Tumor-bearing mice were sacrificed on day 37, and the subcutaneous tumors were removed (Figure 8B). The tumor volumes were measured from day 7 to day 37. By day 17 after implantation, tumor growth was inhibited in the miR-940 mimic group, and the difference in tumor size increased with time (Figure 8C). Finally, subcutaneous tumors were collected for qRT-PCR and IHC analysis. MTHFD2 expression in the xenografts was decreased due to the inhibitory effect of miR-940 mimic (Figure 8D). The in vitro experiments had shown that cell proliferation decreased when MTHFD2 expression was inhibited; similarly, in vivo, the IHC experiments showed that the expression of nuclear protein Ki-67, an indicator of tumor proliferation, was also decreased in the miR-940 mimic group (Figure 8E). All these results indicate that miR-940 suppresses glioma proliferation in vivo.
Figure 8.
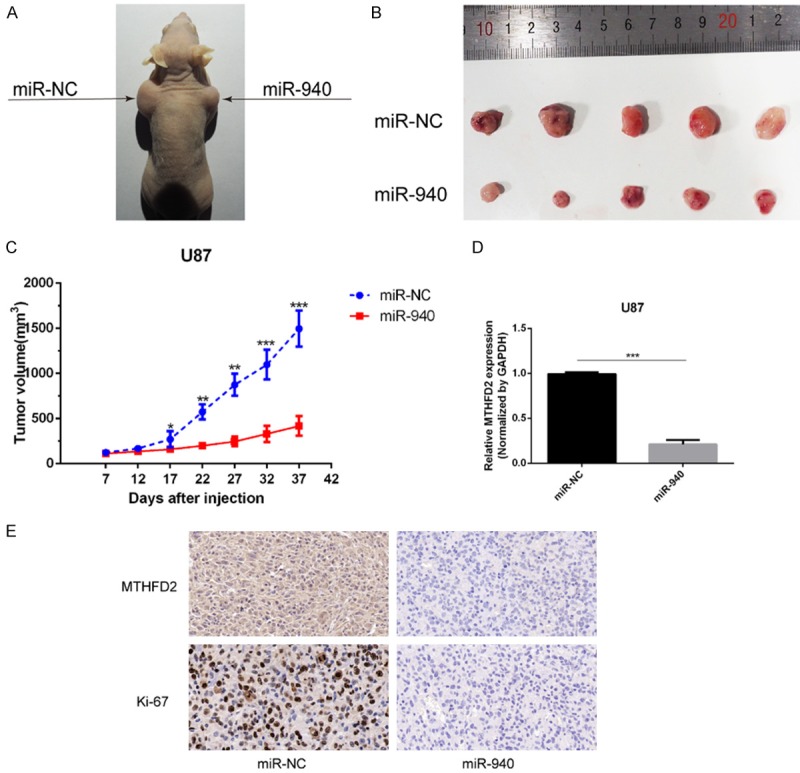
miR-940 inhibits U87 cell-derived subcutaneous ectopic neoplasm growth. A. Photos of tumor-bearing mice on day 37. The control group is on the left and the experimental group is on the right. B. U87 cell-derived subcutaneous neoplasms on day 37 are shown (2 groups, n=5). C. The volumes of the tumors were measured from day 7 to day 37 (formula: volume = width2 * length/2; units: mm3). D. The expression of MTHFD2 in mice neoplasm as determined by qRT-PCR. E. The expression of MTHFD2 and Ki-67 was detected by IHC; scale bar =50 μm. The data are shown as the mean ± SD.
Discussion
It is well known that miRNAs cause mRNA degradation by binding to the 3’-UTR region of mRNA transcripts. Previous studies have shown that abnormal expression of miRNAs in cancers is associated with tumor proliferation, invasion, apoptosis and angiogenesis. We upregulated and downregulated the expression of miR-940 in glioma cells by transfecting them with miRNA-940 mimic or miRNA-940 inhibitor. The proliferation and invasion ability of U87 and U118 cells decreased upon upregulation of miR-940. In this study, miR-940 induced G1/S phase arrest, leading to decreased cell proliferation, as determined by flow cytometry, and increased numbers of apoptotic cells. The decreased expression of miR-940 in glioma samples in the TCGA, CGGA and clinical databases revealed the clinical relevance of this miRNA. miR-940 expression was found to be low in glioma tissues and high in normal tissues, leading us to believe that miR-940 is a potential biomarker and therapeutic target.
MTHFD2, a novel gene on human chromosome 2q12, is significantly differentially expressed between cancers and normal tissues [30]. Previous studies have shown that MTHFD2 plays a key role in AML, hepatocellular carcinoma and renal cell carcinoma [20,31,32]. Abnormal expression of MTHFD2 has also been found in glioma [24,25]. In this study, we demonstrated that MTHFD2 was more highly expressed in glioma samples (n=34) and glioma cell lines than in normal samples (n=5) and NHAs by qRT-PCR and Western blotting. We further found that MTHFD2 expression was low in normally proliferating cells but was high in abnormally proliferating cells such as cancer cells. When we regulated the expression of miR-940, the expression of MTHFD2 also changed in the opposite direction. Furthermore, using luciferase assays, we confirmed that miR-940 can bind to the 3’-UTR of MTHFD2 and reduce the expression of MTHFD2.
In mammalian cells, MTHFD2 is a metabolic enzyme involved in the one-carbon metabolism of folate in mitochondria and is responsible for the conversion of 5,10-meTHF to 10-formyl-THF [33]. Importantly, 5,10-meTHF will accumulate in the mitochondria if the expression of MTHFD2 is reduced because it cannot pass through the mitochondrial membrane [34]. In the current study, 48 h after MTHFD2 expression was inhibited, the expression of enzymes related to upstream and downstream metabolic pathways also began to decline. The decreased expression of SHMT2 resulted in the inability of mitochondria to convert serine into glycine; therefore, serine accumulated in cells, and the cells became more reliant on exogenous glycine to maintain cellular viability. The decreased expression of MTHFD1L reduced formate formation and depleted the available THF pool; this depletion decreased cell tolerance to folate-free environments (Figure 9). Recent studies have shown that glioma cell proliferation and metabolism are more dependent on exogenous serine than on glycine [15]. Therefore, dysfunction of one-carbon metabolism in glioma cells leads to the inhibition of cell proliferation, but the reasons for the decreased invasion and increased apoptosis need further elucidation. These data further indicate that miR-940 plays an inhibitory role in glioma through MTHFD2. Moreover, the MTHFD2 has been found to be the most consistently overexpressed among 1454 metabolic enzymes analyzed in 1981 human tumor samples [27].
Figure 9.
Suppression of MTHFD2 induces changes in intracellular one-carbon metabolism. Red labels indicate the depletion of enzyme expression including SHMT2 and MTHFD1L, 5,10-meTHF accumulates in mitochondria because it cannot pass through mitochondrial membrane, the intracellular synthesis of purine decreases due to the depletion of 10-formyl-THF.
Collectively, all the results demonstrate that miR-940 acts as a tumor suppressor by negatively regulating MTHFD2 expression. Suppression of MTHFD2 expression disrupts mitochondrial one-carbon metabolism and activates the mitochondrial apoptosis pathway. Further study of the relationship between miR-940 and MTHFD2, as well as the expression of these molecules in cancers and normal tissues, may enable the development of valuable tools for early detection of tumors in clinical practice. Moreover, the expression of miRNAs in serum is stable, and peripheral blood is easy to collect from patients. miR-940 may therefore be a potential tumor marker, and MTHFD2 may be a potential new drug target for glioma treatment via manipulation of cell metabolism.
Acknowledgements
The authors disclosed receipt of the following financial support for the research, authorship, and publication of this article: this study was supported by grants from the National Natural Science Foundation of China (No. 81171147), “Key Medical Talents of Qiangwei Project” Research Foundation of Health Department of Jiangsu Province (No. ZDRCA2016010), “Xingwei Project” Key Personal Medical Research Foundation of Health Department of Jiangsu Province (No. RC201156), Jiangsu Province’s Natural Science Foundation (BK20171064), Research Foundation of Jiangsu Provincial Medical Youth Talent, the Project of Inviogorating Health Care through Science, Technology and Education (QNRC2016858). Jiangsu Province’s Key Discipline of Medicine (No. XK201117) and the Priority Academic Program Development of Jiangsu Higher Education Institutions (PAPD).
Disclosure of conflict of interest
None.
References
- 1.Miller KD, Siegel RL, Lin CC, Mariotto AB, Kramer JL, Rowland JH, Stein KD, Alteri R, Jemal A. Cancer treatment and survivorship statistics, 2016. CA Cancer J Clin. 2016;66:271–289. doi: 10.3322/caac.21349. [DOI] [PubMed] [Google Scholar]
- 2.Ribas A, Dummer R, Puzanov I, VanderWalde A, Andtbacka RHI, Michielin O, Olszanski AJ, Malvehy J, Cebon J, Fernandez E, Kirkwood JM, Gajewski TF, Chen L, Gorski KS, Anderson AA, Diede SJ, Lassman ME, Gansert J, Hodi FS, Long GV. Oncolytic virotherapy promotes intratumoral T cell infiltration and improves Anti-PD-1 immunotherapy. Cell. 2018;174:1031–1032. doi: 10.1016/j.cell.2018.07.035. [DOI] [PubMed] [Google Scholar]
- 3.He L, Hannon GJ. MicroRNAs: small RNAs with a big role in gene regulation. Nat Rev Genet. 2004;5:522–531. doi: 10.1038/nrg1379. [DOI] [PubMed] [Google Scholar]
- 4.Geng C, Dong T, Jin W, Yu B, Yin F, Peng F, Chen G, Ji C, Ding F. MicroRNA-98 regulates hepatic cholesterol metabolism via targeting sterol regulatory element-binding protein 2. Biochem Biophys Res Commun. 2018;504:422–426. doi: 10.1016/j.bbrc.2018.08.205. [DOI] [PubMed] [Google Scholar]
- 5.Shang J, Chen ZZ, Wang ZH, Wei TN, Wu WB, Chen WM. [Association of miRNA-196b-5p and miRNA-99a-5p with autophagy and apoptosis in multiple myeloma cells] . Zhonghua Xue Ye Xue Za Zhi. 2018;39:766–772. doi: 10.3760/cma.j.issn.0253-2727.2018.09.013. [DOI] [PMC free article] [PubMed] [Google Scholar]
- 6.Deng YW, Hao WJ, Li YW, Li YX, Zhao BC, Lu D. Hsa-miRNA-143-3p reverses multidrug resistance of triple-negative breast cancer by inhibiting the expression of its target protein cytokine-induced apoptosis inhibitor 1 in vivo. J Breast Cancer. 2018;21:251–258. doi: 10.4048/jbc.2018.21.e40. [DOI] [PMC free article] [PubMed] [Google Scholar]
- 7.Li F, Li D, Zhang M, Sun J, Li W, Jiang R, Han R, Wang Y, Tian Y, Kang X, Sun G. miRNA-223 targets the GPAM gene and regulates the differentiation of intramuscular adipocytes. Gene. 2018;685:106–113. doi: 10.1016/j.gene.2018.10.054. [DOI] [PubMed] [Google Scholar]
- 8.Hu J, Sun T, Wang H, Chen Z, Wang S, Yuan L, Liu T, Li HR, Wang P, Feng Y, Wang Q, McLendon RE, Friedman AH, Keir ST, Bigner DD, Rathmell J, Fu XD, Li QJ, Wang H, Wang XF. MiR-215 is induced post-transcriptionally via HIF-Drosha complex and mediates glioma-initiating cell adaptation to hypoxia by targeting KDM1B. Cancer Cell. 2016;29:49–60. doi: 10.1016/j.ccell.2015.12.005. [DOI] [PMC free article] [PubMed] [Google Scholar]
- 9.Zhao S, Liu H, Liu Y, Wu J, Wang C, Hou X, Chen X, Yang G, Zhao L, Che H, Bi Y, Wang H, Peng F, Ai J. miR-143 inhibits glycolysis and depletes stemness of glioblastoma stem-like cells. Cancer Lett. 2013;333:253–260. doi: 10.1016/j.canlet.2013.01.039. [DOI] [PubMed] [Google Scholar]
- 10.Hashimoto K, Ochi H, Sunamura S, Kosaka N, Mabuchi Y, Fukuda T, Yao K, Kanda H, Ae K, Okawa A, Akazawa C, Ochiya T, Futakuchi M, Takeda S, Sato S. Cancer-secreted hsa-miR-940 induces an osteoblastic phenotype in the bone metastatic microenvironment via targeting ARHGAP1 and FAM134A. Proc Natl Acad Sci U S A. 2018;115:2204–2209. doi: 10.1073/pnas.1717363115. [DOI] [PMC free article] [PubMed] [Google Scholar]
- 11.Ma J, Sun F, Li C, Zhang Y, Xiao W, Li Z, Pan Q, Zeng H, Xiao G, Yao K, Hong A, An J. Depletion of intermediate filament protein Nestin, a target of microRNA-940, suppresses tumorigenesis by inducing spontaneous DNA damage accumulation in human nasopharyngeal carcinoma. Cell Death Dis. 2014;5:e1377. doi: 10.1038/cddis.2014.293. [DOI] [PMC free article] [PubMed] [Google Scholar]
- 12.Hou L, Chen M, Yang H, Xing T, Li J, Li G, Zhang L, Deng S, Hu J, Zhao X, Jiang J. MiR-940 inhibited cell growth and migration in triple-negative breast cancer. Med Sci Monit. 2016;22:3666–3672. doi: 10.12659/MSM.897731. [DOI] [PMC free article] [PubMed] [Google Scholar]
- 13.Rajendiran S, Parwani AV, Hare RJ, Dasgupta S, Roby RK, Vishwanatha JK. MicroRNA-940 suppresses prostate cancer migration and invasion by regulating MIEN1. Mol Cancer. 2014;13:250. doi: 10.1186/1476-4598-13-250. [DOI] [PMC free article] [PubMed] [Google Scholar]
- 14.Christensen KE, Mirza IA, Berghuis AM, Mackenzie RE. Magnesium and phosphate ions enable NAD binding to methylenetetrahydrofolate dehydrogenase-methenyltetrahydrofolate cyclohydrolase. J Biol Chem. 2005;280:34316–34323. doi: 10.1074/jbc.M505210200. [DOI] [PubMed] [Google Scholar]
- 15.Labuschagne CF, van den Broek NJ, Mackay GM, Vousden KH, Maddocks OD. Serine, but not glycine, supports one-carbon metabolism and proliferation of cancer cells. Cell Rep. 2014;7:1248–1258. doi: 10.1016/j.celrep.2014.04.045. [DOI] [PubMed] [Google Scholar]
- 16.Di Pietro E, Sirois J, Tremblay ML, MacKenzie RE. Mitochondrial NAD-dependent methylenetetrahydrofolate dehydrogenase-methenyltetrahydrofolate cyclohydrolase is essential for embryonic development. Mol Cell Biol. 2002;22:4158–4166. doi: 10.1128/MCB.22.12.4158-4166.2002. [DOI] [PMC free article] [PubMed] [Google Scholar]
- 17.MacKenzie RE. Mitochondrial NAD-dependent methylenetetrahydrofolate dehydrogenase-methenyltetrahydrofolate cyclohydrolase. Methods Enzymol. 1997;281:171–177. doi: 10.1016/s0076-6879(97)81023-3. [DOI] [PubMed] [Google Scholar]
- 18.Mejia NR, MacKenzie RE. NAD-dependent methylenetetrahydrofolate dehydrogenase-methenyltetrahydrofolate cyclohydrolase in transformed cells is a mitochondrial enzyme. Biochem Biophys Res Commun. 1988;155:1–6. doi: 10.1016/s0006-291x(88)81040-4. [DOI] [PubMed] [Google Scholar]
- 19.Yang XM, MacKenzie RE. NAD-dependent methylenetetrahydrofolate dehydrogenase-methenyltetrahydrofolate cyclohydrolase is the mammalian homolog of the mitochondrial enzyme encoded by the yeast MIS1 gene. Biochemistry. 1993;32:11118–11123. doi: 10.1021/bi00092a022. [DOI] [PubMed] [Google Scholar]
- 20.Pikman Y, Puissant A, Alexe G, Furman A, Chen LM, Frumm SM, Ross L, Fenouille N, Bassil CF, Lewis CA, Ramos A, Gould J, Stone RM, DeAngelo DJ, Galinsky I, Clish CB, Kung AL, Hemann MT, Vander Heiden MG, Banerji V, Stegmaier K. Targeting MTHFD2 in acute myeloid leukemia. J Exp Med. 2016;213:1285–1306. doi: 10.1084/jem.20151574. [DOI] [PMC free article] [PubMed] [Google Scholar]
- 21.Mejia NR, Rios-Orlandi EM, MacKenzie RE. NAD-dependent methylenetetrahydrofolate dehydrogenase-methenyltetrahydrofolate cyclohydrolase from ascites tumor cells. Purification and properties. J Biol Chem. 1986;261:9509–9513. [PubMed] [Google Scholar]
- 22.Rios-Orlandi EM, MacKenzie RE. The activities of the NAD-dependent methylenetetrahydrofolate dehydrogenase-methenyltetrahydrofolate cyclohydrolase from ascites tumor cells are kinetically independent. J Biol Chem. 1988;263:4662–4667. [PubMed] [Google Scholar]
- 23.Smith GK, Banks SD, Monaco TJ, Rigual R, Duch DS, Mullin RJ, Huber BE. Activity of an NAD-dependent 5,10-methylenetetrahydrofolate dehydrogenase in normal tissue, neoplastic cells, and oncogene-transformed cells. Arch Biochem Biophys. 1990;283:367–371. doi: 10.1016/0003-9861(90)90656-j. [DOI] [PubMed] [Google Scholar]
- 24.Liu M, Xu Z, Du Z, Wu B, Jin T, Xu K, Xu L, Li E, Xu H. The identification of key genes and pathways in glioma by bioinformatics analysis. J Immunol Res. 2017;2017:1278081. doi: 10.1155/2017/1278081. [DOI] [PMC free article] [PubMed] [Google Scholar]
- 25.Wang S, Jin F, Fan W, Liu F, Zou Y, Hu X, Xu H, Han P. Gene expression meta-analysis in diffuse low-grade glioma and the corresponding histological subtypes. Sci Rep. 2017;7:11741. doi: 10.1038/s41598-017-12087-y. [DOI] [PMC free article] [PubMed] [Google Scholar]
- 26.Kind T, Wohlgemuth G, Lee DY, Lu Y, Palazoglu M, Shahbaz S, Fiehn O. FiehnLib: mass spectral and retention index libraries for metabolomics based on quadrupole and time-of-flight gas chromatography/mass spectrometry. Anal Chem. 2009;81:10038–10048. doi: 10.1021/ac9019522. [DOI] [PMC free article] [PubMed] [Google Scholar]
- 27.Nilsson R, Jain M, Madhusudhan N, Sheppard NG, Strittmatter L, Kampf C, Huang J, Asplund A, Mootha VK. Metabolic enzyme expression highlights a key role for MTHFD2 and the mitochondrial folate pathway in cancer. Nat Commun. 2014;5:3128. doi: 10.1038/ncomms4128. [DOI] [PMC free article] [PubMed] [Google Scholar]
- 28.Koufaris C, Gallage S, Yang T, Lau CH, Valbuena GN, Keun HC. Suppression of MTHFD2 in MCF-7 breast cancer cells increases glycolysis, dependency on exogenous glycine, and sensitivity to folate depletion. J Proteome Res. 2016;15:2618–2625. doi: 10.1021/acs.jproteome.6b00188. [DOI] [PubMed] [Google Scholar]
- 29.Christensen KE, Mackenzie RE. Mitochondrial methylenetetrahydrofolate dehydrogenase, methenyltetrahydrofolate cyclohydrolase, and formyltetrahydrofolate synthetases. Vitam Horm. 2008;79:393–410. doi: 10.1016/S0083-6729(08)00414-7. [DOI] [PubMed] [Google Scholar]
- 30.Koseki J, Konno M, Asai A, Colvin H, Kawamoto K, Nishida N, Sakai D, Kudo T, Satoh T, Doki Y, Mori M, Ishii H. Enzymes of the one-carbon folate metabolism as anticancer targets predicted by survival rate analysis. Sci Rep. 2018;8:303. doi: 10.1038/s41598-017-18456-x. [DOI] [PMC free article] [PubMed] [Google Scholar]
- 31.Lin H, Huang B, Wang H, Liu XC, Hong YX, Qiu SP, Zheng JH. MTHFD2 overexpression predicts poor prognosis in renal cell carcinoma and is associated with cell proliferation and vimentin-modulated migration and invasion. Cell Physiol Biochem. 2018;51:991–1000. doi: 10.1159/000495402. [DOI] [PubMed] [Google Scholar]
- 32.Bidkhori G, Benfeitas R, Klevstig M, Zhang C, Nielsen J, Uhlen M, Boren J, Mardinoglu A. Metabolic network-based stratification of hepatocellular carcinoma reveals three distinct tumor subtypes. Proc Natl Acad Sci U S A. 2018;115:E11874–E11883. doi: 10.1073/pnas.1807305115. [DOI] [PMC free article] [PubMed] [Google Scholar]
- 33.Tibbetts AS, Appling DR. Compartmentalization of Mammalian folate-mediated one-carbon metabolism. Annu Rev Nutr. 2010;30:57–81. doi: 10.1146/annurev.nutr.012809.104810. [DOI] [PubMed] [Google Scholar]
- 34.Fan J, Ye J, Kamphorst JJ, Shlomi T, Thompson CB, Rabinowitz JD. Quantitative flux analysis reveals folate-dependent NADPH production. Nature. 2014;510:298–302. doi: 10.1038/nature13236. [DOI] [PMC free article] [PubMed] [Google Scholar]