

Abstract
Activated KRAS is frequently observed and paralleled by inactivating of tumor suppressors in lung cancer, while the mechanisms remained elusive. Here, our study revealed a microRNA was involved in KRAS overexpression, activation of KRAS signaling and its synergy with inactivating of tumor suppressor genes. miR-1205 was selected by its sequence-dependent inhibition on KRAS and negative clinical correlation with KRAS. A549 and H460 cells carrying mutant KRAS, were sensitive to the growth inhibition and G1/S arrest induced by miR-1205. Target analysis revealed that miR-1205 could simultaneously downregulate the expression levels of MDM4 and E2F1, which were downstream of KRAS and synergistic with KRAS. Silencing of MDM4 or E2F1 inhibited cellular proliferation. MiR-1205 decreased the protein levels of MDM4 and E2F1 via directly binding to the coding sequence of E2F1 and 3’UTR of MDM4. Meanwhile, blocking RAS-MAPK signaling using KRAS siRNA or ERK1/2 inhibitor exerted similar inhibitory effects on MDM4 and E2F1. Forced expression of KRAS partially restored the inhibition of miR-1205 on MDM4 and E2F1. Overexpression of KRAS, MDM4 or E2F1 could partially rescued the growth inhibition of miR-1205 in vitro. More importantly, miR-1205 strongly inhibited the tumor growth of A549 xenografts in nude mice and decreased the protein levels of KRAS, MDM4 and E2F1 in tumor tissues. Together, our study firstly confirmed a potential synergy between KRAS and MDM4/E2F1 which are p53/RB inactivators in non-small cell lung cancer, and identified miR-1205 as a potent destructor of this synergy, making miR-1205 function as a tumor suppressor in vitro and in vivo.
Keywords: KRAS, E2F1, MDM4, microRNA, oncogene activation, inactivator of tumor suppressor genes
Introduction
Lung cancer, the most commonly diagnosed cancer, is responsible for nearly one cancer death in five (1.59 million deaths, 19.4% of the total) globally [1]. Non-small cell lung cancer (NSCLC) accounts for at least 80% of lung cancers [1], and the overall five-year survival rate remains as low as about 15% and has not yet been improved in the past 30 years [2]. Generally, the occurrence of cancer is greatly contributed by the inactivation of tumor suppressor genes and activation of oncogenes. In lung cancer, p53, CDKN2A and RB are the main inactivated tumor suppressor genes. KRAS, EGFR and EML4-ALK are always activated in different patient population, diagnosed by mutation, amplification or gene fusion [3].
TP53 is considered to be the most important tumor suppressor gene. However, it is common to see the inactivation of p53 in various cancers including lung cancer. The occurrence of p53 loss-of-function mutation is more than 40% in lung cancer [3]. Synergistic effect between p53 and RAS during the multistep process of tumorigenesis was observed in many studies [4-6]. In some specific subsets (9% in patients with EML4-ALK fusion) [7], p53 inactivation often results from the overexpression of its endogenous inhibitors MDM4 or MDM2 [8,9]. MDM2 is an E3 ubiquitin ligase that inhibits p53 by promoting its degradation, whereas MDM4 inhibits p53 transactivation activity by binding to its N-terminal domain [8,9]. It was recently reported that overexpressed MDM4 could promote the progression of NSCLC, additionally, high levels of MDM4 cooperated with oncogenic KRAS to drive lung tumorigenesis [9,10]. Recent advances in biomedical research have shown that targeting MDM4 was a viable strategy for cancer therapy [11]. The retinoblastoma (RB) protein control of E2F transcription factors is crucial for regulating cell cycle, tumorigenesis, tumor invasion and metastasis in NSCLC [12]. Cyclin D-cyclin-dependent kinase 4 (CDK4) or CDK6 act to hyperphosphorylate RB, then E2F1, E2F2 and E2F3 are released from RB protein, which can be blocked by CDK inhibitor 2A (CDKN2A). In lung cancer, mutations or copy number changes of CDKN2A, CDK4/CDK6 and RB that are very common. Hyperphosphorylation of RB by CDKs when CDKN2A is loss or mutated, relieves the combination of RB with E2F1, promoting the initiation and progression of NSCLC [13,14].
30% patients with lung cancer carried mutations in codon 12 or 13 of KRAS, which could transform normal cells into malignant cells [15,16]. Besides mutation, overexpression, allelic imbalance, gene fusion could also activate KRAS [17,18], whereas the mechanisms for the overexpression of KRAS are still ill-defined. In the progression of cancer, the co-occurrence of oncogenic activation of KRAS and inactivation of tumor suppressor genes is common and exerts obvious synergistic effect to initiate and promote tumor growth [3]. Besides the co-occurrence of genetic alterations, activated KRAS also plays a critical role in tumor suppressors inactivation and oncogenes activation through its downstream MAPK signaling. KRAS upregulated MDM4 via c-ETS-1, a transcription factor phosphorylated by ERK2, and inhibited the activity of p53 [19]. Oncogenic KRAS could enhance the transcription of E2F1 through MAPK pathway, and synergize with FADD to increase the phosphorylation of RB leading to the release of E2F1 [20,21], both of which result in promoting tumor cell proliferation. These types of synergy between KRAS signaling and inactivation of tumor suppressor genes greatly contributed to the poor diagnosis of lung cancer [22,23].
MiRNAs are a class of endogenous and single-stranded small noncoding RNAs that are approximately 22 nucleotides in length [24,25]. They post-transcriptionally silence the expression of target gene via complementary binding to its 3’-untranslated regions (3’UTR) [26,27]. Accumulating studies have clarified vital roles of miRNAs in the development and drug resistance of lung cancer driven by KRAS activation [28-31].
This study aimed to activated KRAS and potential inactivators of tumor suppressor genes synergistic with KRAS in NSCLC, and hypothesized that the post-transcriptional regulation of microRNAs (miRNAs) may have a critical role in regulating the expression of KRAS and inactivators of tumor suppressor genes and playing an important role in tumor inhibition. Here, through target prediction via bioinformatic tools and in-vitro screening by using luciferase reporter, miR-1205 was selected by its negative correlation with KRAS in clinical samples. MiR-1205 suppressed the expression of KRAS, and its downstream MDM4 (an inactivator of p53) and E2F1 (outcome of RB inactivation). MiR-1205 reduced the expression of MDM4 and E2F1 via direct binding and indirect KRAS signaling inhibition. Totally, our study confirmed the potential synergy of oncogenic KRAS and inactivators of tumor suppressors in lung cancer and disclosed miR-1205 as a suppressor of this synergy in vitro and in vivo.
Materials and methods
Cell lines and lung cancer tissue samples
Human non-small cell lung cancer cell lines (A549, H1299, NCI-H1975, H1650, H358, HCC827, H460), immortalized normal human lung bronchial epithelial cell line (16HBE), and human squamous carcinoma cell line (SK-MES-1) were purchased from the Cell Resource Center, Shanghai Institutes for Biological Sciences, Chinese Academy of Sciences. A549, H1299, NCI-H1975, H1650, H358, H460 and HCC827 cells were cultured in RPMI-1640 medium (Gibco, Carlsbad, CA, USA) supplemented with 10% fetal bovine serum (FBS) (Sigma, St Louis, MO, USA). 16HBE cells were cultured in DMEM medium (Hyclone, Logan, UT, USA) supplemented with 10% FBS. SK-MES-1 cells were cultured in MEM medium (Gibco) supplemented with 10% FBS. All cells were cultured in a humidified incubator at 37°C with 5% CO2. Twenty samples of human lung tumor and adjacent tumor tissues were collected from Shanghai Pulmonary Hospital. This study complied with the principles of the Declaration of Helsinki, and was approved by the human ethics and research ethics committees of the Shanghai Pulmonary Hospital.
MicroRNA mimics/siRNAs and cell transfection
MiR-1205 mimics (5’-UCUGCAGGGUUUGCUUUGAG-3’), miR-1205 mutant (5’-UGACGUCGGUUUGCUUUGAG-3’), KRAS siRNA duplexes (5’-CCUUGACGAUACAGCUAAUTT-3’), E2F1 siRNA duplexes (5’-GUCACGCUAUGAGACCUCATT-3’), and MDM4 siRNA duplexes (5’-GCUCCUGUCGUUAGACCUATT-3’) were purchased from GenePharma (Shanghai, China). Reverse transfection of miRNA/siRNA was conducted using RNAiMAX (Invitrogen, Carlsbad, CA, USA) according to the manufacturer’s instructions.
Plasmids and cell transfection
Plasmids of flag-KRAS, flag-MDM4 were purchased from Obio Technology (Shanghai, China), and plasmids of GFP-E2F1 was kindly gifted from Guang-hui WANG’ lab, Laboratory of Molecular Neuropathology, Jiangsu Key Laboratory of Translational Research and Therapy for Neuro-Psycho-Diseases and College of Pharmaceutical Sciences. Cells were transfected with vectors using Lipofectamine 2000 reagent (Invitrogen) according to the manufacturer’s instructions.
3-(4, 5-dimethylthiazoly-2-yl)-2-5 diphenyl tetrazolium bromide (MTT) assay
Cell viability was determined using MTT assay. The cells seeded in 96-well plates, were incubated for specific time points, then 20 μl of 5 mg/ml MTT regent was added into each well and incubated in the dark at 37°C for 4 h. Next, 100 μl of dissolution buffer (10% SDS, 5% isobutanol, 0.012 M HCL) was added and the absorbance at 570 nm was measured using a SYNFRGY4 microplate reader (BioTek, Winooski, VT, USA).
RNA extraction and qRT-PCR
Total RNAs were harvested from cells using Trizol reagent (Invitrogen) and isolated using a UNIQ-10/Trizol total RNA extraction kit (Sangon, Shanghai, China). Reverse transcription was performed with PrimeScript RT Master Mix (TaKaRa, Otus, Shiga, Japan). Quantitative real-time RT-PCR (qRT-PCR) analysis was performed using SYBR Premix Ex Taq (TaKaRa). The primers sets used are listed in Table 1.
Table 1.
List of miRNAs predicted to target KRAS 3’UTR by all three algorithms (TargetScan 7.1, MicroRNA.org, RNA22)
| hsa-miR-1205 | hsa-miR-497-5p | hsa-miR-378a-5p |
| hsa-mir-944 | hsa-miR-616-3p | hsa-miR-3162-5p |
| hsa-mir-142-3P | hsa-miR-129-5p | hsa-miR-2110 |
| hsa-miR-2861 | hsa-miR-2355-3p | hsa-miR-642a-5p |
| hsa-miR-3120-5p | hsa-miR-23a-3p | hsa-miR-1228-3p |
| hsa-miR-574-5p | hsa-miR-26a-2-3p | hsa-miR-607 |
| hsa-miR-622 | hsa-miR-296-3p | hsa-miR-133a-5p |
| hsa-miR-802 | hsa-miR-29b-1-5p | hsa-miR-652-3p |
| hsa-miR-3154 | hsa-miR-3150a-3p | hsa-mir-625-3p |
| hsa-miR-23a-5p | hsa-miR-199b-5p | hsa-miR-411-3p |
| hsa-miR-605-5p | hsa-miR-379-3p | hsa-miR-335-3p |
| hsa-miR-328-5p | hsa-mir-199a-5p | hsa-miR-892a |
| hsa-miR-490-5p | hsa-mir-212-3p | hsa-mir-141-5p |
| hsa-miR-218-1-3p | hsa-mir-629-3p | hsa-mir-628-5p |
| hsa-miR-935 | hsa-miR-377-3p | hsa-mir-380-3p |
| hsa-miR-3192-5p | hsa-mir-188-3p | hsa-miR-501-5p |
MiRNAs were isolated using the mirVana miRNA Isolation Kit (Ambion, Austin, TX), reversely transcribed and amplified using TaqMan MicroRNA assay kit (Invitrogen) according to the manufacturer’s instructions. RNU6-2 was used as an internal loading control.
Western blot analysis
Cells were lysed in RIPA lysis buffer (Beyotime, Shanghai, China) containing protein inhibitor phenylmethanesulfonyl fluoride (PMSF). After separation on 8% SDS-polyacrylamide gels (SDS-PAGE) and transferring onto a polyvinylidene difluoride (PVDF) membranes (Millipore, Billerica, MA, USA), the proteins were incubated with the primary antibody against KRAS (1:200, sc-30, Santa Cruz Biotechnologies, CA, USA), E2F1 (1:1000, 3742, Cell Signaling Technology, Danvers, USA), MDM4 (1:500, 17914-1-ap, proteintech, Chicago, USA). GAPDH (1:10000, 2118S, Cell Signaling Technology, Danvers, USA), α-tubulin (1:10000, OM239217, OmnimAbs, CA, USA) were used as internal control.
Construction of luciferase reporters
The 3’UTR of human KRAS (NM_004985, GenBank) was amplified via PCR from MCF-7 genomic DNA, the 3’UTR of human MDM4 (NM_002393) and CDS of human E2F1 (NM_005225) were amplified via PCR from A549 cDNA, and they were separately cloned into the psiCHECK-2 vector (Promega, Madison, WI, USA) using the In-fusion Advantage PCR Cloning Kit (Clontech, Mountain View, CA, USA). The primers used are listed in Table 2. KRAS and MDM4 3’UTR mutant reporter, and E2F1 CDS mutant reporter were generated using the site-directed mutation strategy by the KOD-Plus-Mutagenesis Kit (Toyobo, Osaka, Japan). The primers sets were designed according to the manufacturer’s instructions and listed in Table 2.
Table 2.
Oligonucleotides used for the construction of plasmids or for quantitative polymerase chain reaction
| KRAS realtime PCR primer-F | GAGGCCTGCTGAAAATGACTG |
| KRAS realtime PCR primer-R | ATTACTACTTGCTTCCTGTAGG |
| E2F1 realtime PCR primer-F | GGACCTGGAAACTGACCATCAG |
| E2F1 realtime PCR primer-R | GGACGTTGGTGATGTCATAGATGCG |
| MDM4 realtime PCR primer-F | TCTCGCTCTCGCACAGGATCACA |
| MDM4 realtime PCR primer-R | AACCACCAAGGCAGGCCAGCTA |
| TAK1 realtime PCR primer-F | TGCCCAAACTCCAAAGAATC |
| TAK1 realtime PCR primer-R | TTTGCTGGTCCTTTTCATCC |
| NOTCH2 realtime PCR primer-F | GGGACCCTGTCATACCCTCT |
| NOTCH2 realtime PCR primer-R | GAGCCATGCTTACGCTTTCG |
| SP1 realtime PCR primer-F | GGCTGTGGGAAAGTGTATGG |
| SP1 realtime PCR primer-R | GGCAAATTTCTTCTCACCTGTG |
| GAPDH realtime PCR primer-F | GGTGGTCTCCTCTGACTTCAACA |
| GAPDH realtime PCR primer-R | GTTGCTGTAGCCAAATTCGTTGT |
| MiR-1205 Taqman primer | TCTGCAGGGTTTGCTTTGAG |
| U6 snRNA realtime PCR primer-F | GCTTCGGCAGCACATATACTAAAAT |
| U6 snRNA realtime PCR primer-R | CGCTTCACGAATTTGCGTGTCAT |
| psiCHECK-KRAS-3’UTR cloning primer-F | TTTTCCTTTTGCGGCCGCGGAGTCATTACTTCTGACCTTGAAATAG |
| psiCHECK-KRAS-3’UTR cloning primer-R | CCGCTCGAGGGCATACTAGTACAAGTGGTAATTTTTG |
| psiCHECK-KRAS-3’UTR mutant cloning primer-F | GACGTCTTATGTTGAGGGCCCATCTCT |
| psiCHECK-KRAS-3’UTR mutant cloning primer-R | AGACGTCATAACTTTTTTTTCCCCTAAATTCA |
| psiCHECK-MDM4-3’UTR cloning primer-F | CCTCGAGCTCCCTTTATAGGAGCCATTGG |
| psiCHECK-MDM4-3’UTR cloning primer-R | TTGCGGCCGCTATAGTCCCAGCTACTAGGGAGGC |
| psiCHECK-MDM4-3’UTR mutant A cloning primer-F | GACGTCTAAGAGATAGCTAATATTTTTTGGTAC |
| psiCHECK-MDM4-3’UTR mutant A cloning primer-R | AGACGTCACATGCCTCTTTCTCTGTTAACAC |
| psiCHECK-MDM4-3’UTR mutant B cloning primer-F | GGACGTCGTTGTTTTCCTTCTTACGATCCTCAT |
| psiCHECK-MDM4-3’UTR mutant B cloning primer-R | GACGTCCGGAAGCAGCATCTTGGATTTCAGAT |
| psiCHECK-E2F1-3’UTR cloning primer-F | CCTCGAGGATTTCTGACAGGGCTTGGA |
| psiCHECK-E2F1-3’UTR cloning primer-R | TTGCGGCCGCCTGGATCTGCTTTTGAGTTAGG |
| psiCHECK-E2F1-CDS cloning primer-F | CCTCGAGTTGCCAAGAAGTCCAAGAACC |
| psiCHECK-E2F1-CDS cloning primer-R | TTGCGGCCGCAGAAGTCCTCCCGCACATG |
| psiCHECK-E2F1-CDS mutant A cloning primer-F | GACGTCCAGAGCGAGCAGCAGCTGGAC |
| psiCHECK-E2F1-CDS mutant A cloning primer-R | GGACGTCCTGTCGGAGGTCCTGGGTCAAC |
| psiCHECK-E2F1-CDS mutant B cloning primer-F | GACGTCTGCAGATGGTTATGGTGATCAAAGCC |
| psiCHECK-E2F1-CDS mutant B cloning primer-R | AGACGTCGGTCTGCAATGCTACGAAGGTC |
Luciferase assays
Cells were seeded in 6-well plates, and reporter plasmids were separately co-transfected with miRNA or NC mimics into HEK293 cells using Lipofectamine 2000 (Invitrogen). Cell extracts were harvested 48 h later, and the luciferase activity was determined by the Dual-Luciferase Reporter Assay System (Promega).
CRISPR/Cas9-mediated miR-1205 knockout
The process of CRISPR/Cas9-mediated nucleotides knockout was performed as previously described [32]. Two sgRNAs (5’-CACCGTTATCACTGAAGGCCTCTGC-3’; 5’-CACCGCCTTCCTGTCAACCCTGTTC-3’) were designed [33], and cloned into px330-mCherry and px330-GFP vectors respectively. The two plasmids constructed were co-transfected into A549 cells. 48 hours later, the mCherry- and GFP-double positive cells were sorted by a flow cytometry (BD Biosciences, San Jose, CA, USA) and seeded into a 96-well-plate as a single cell/well. After two weeks, clones derived from single cells were selected for genomic DNA sequencing to confirm the knockout of miR-1205.
In vivo experiment
BALB/c athymic nude mice (female, 4-6 weeks old) were purchased from Animal Core Facility of Nanjing Medical University (Nanjing, China). All animal experiments were performed according to Guides for the Care and Use of Laboratory Animals and approved by Institutional Animal Care and Use Committee of Shanghai Institute of Materia Medica, Chinese Academy of Sciences. All nude mice were maintained in special pathogen-free (SPF) conditions. Approximately 5 × 10⁶ A549 cells resuspended in Matrigel (Corning, corning, NY, USA): RPMI 1640 medium (1:1) were subcutaneously injected into the nude mice. All nude mice were randomly divided into two groups (n = 6 mice per group). As peritumoral injection was feasible and effective in multiple studies [34-36], and in consideration of the possible puncture and bleeding by intratumoral injection in our highly vascularized xenografted tumors, peritumoral injection was chosen. Two weeks later, while the average volume of tumors reached about 100 mm3, miR-1205 or NC mimics encapsulated in linear polyethylenimine (Polyplus, NY, USA) were injected via peritumoral injection (0.5 mg/kg, three times a week). Tumor size was monitored three times a week, and tumor volume was calculated according to the following formula: volume = (length × width × width)/2. Mice were sacrificed 18 days after inoculation, and the tumor tissues were stripped, weighted, frozen in liquid nitrogen for further analysis.
Statistical analysis
Data were presented as mean ± SEM from at least three times of independent experiments. P<0.05 was defined as statistical significant. Difference between two groups was analyzed using Student’s t-test (GraphPad Prism software), and differences among more than two groups were decided by two-way ANOVA (GraphPad Prism software).
Results
MiR-1205 down-regulated KRAS expression by directly binding KRAS 3’UTR
KRAS mRNA was upregulated in lung adenocarcinoma tissues comparing to the adjacent normal tissues from TCGA database (n = 57, P<0.01; Figure 1A), which was verified in our cohort with 20 pairs of lung tumor and adjacent tumor tissues from Shanghai Pulmonary Hospital (Figure 1B). 48 miRNAs with predicted binding sites on the 3’UTR of KRAS were selected from the intersection of three algorithms: TargetScan 7.1, MicroRNA.org and RNA22 (Table 1), then their inhibitory effects on the luciferase activity of KRAS 3’UTR reporter were examined and plotted against their context++ scores from TargetScan. Here, miRNAs with scores less than -0.01 were selected (Figure 1C). In these miRNAs, expression level of miR-1205 was significantly lower in lung cancer tissues (Figure 1D). Notably, the inverse correlation between miR-1205 and KRAS mRNA expression levels was observed in our cohort by Pearson correlation analysis (r = -0.3380, P<0.05; Figure 1E). MiR-1205 (50 nM for 72 h) decreased the mRNA and protein levels of mutant KRAS in A549 and wildtype KRAS in H1975 (Figure 1F and 1G). To confirm the sequence-dependent interaction between miR-1205 and KRAS mRNA, we mutated the predicted binding site of miR-1205 on KRAS 3’UTR reporter plasmid (Figure 1H). MiR-1205 significantly inhibited the luciferase activity of the wild-type 3’UTR of KRAS (wt 3’UTR), but had no effect on the mutated KRAS 3’UTR reporter (mut 3’UTR) (Figure 1I). In parallel, we synthesized a mutant form of miR-1205 (mut miR-1205) with a 6bp transition in the seed region of miR-1205 (from ‘CUGCAG’ to ‘GACGUC’) (Figure 1H), and found this mutant form had no inhibitory effect on the luciferase activity of the wild-type KRAS 3’UTR, as well as the mRNA and protein levels of KRAS (Figure 1I-L). Finally, genomic deletion of miR-1205 via CRISPR/CAS9 markedly decreased the level of mature miR-1205, and increased KRAS mRNA and protein expression levels in A549 cells (Figure 1M and 1N).
Figure 1.

MiR-1205 down-regulated KRAS expression by directly binding to KRAS 3’UTR. A. Statistical analysis of the data from TCGA database for the KRAS expression in lung cancer tissues. The KRAS mRNA expression level was compared between tumor and adjacent tumor tissue samples (n = 57). B. QRT-PCR was used to measure the KRAS expression in clinical lung cancer tissue pairs (n = 20). GAPDH was used as an internal control. C. Luciferase assay of the extracts from HEK293 cells transfected with the candidate miRNA mimics, for screening the miRNAs targeting KRAS 3’UTR. Data are presented as the mean ± SEM of three independent experiments. D. QRT-PCR analysis of miR-1205 expression in clinical lung cancer tissue pairs (n = 20). U6 snRNA was used as an internal control. E. Spearman’s correlation analysis of the correlation between the miR-1205 and KRAS mRNA expression level in lung cancer tissues. F and G. KRAS mRNA and protein levels in A549 and H1975 cells after transfected with indicated doses of miR-1205 for 72 h. H. Predicted binding between miR-1205 and matched sequence in the 3’UTR of KRAS. Mutant sequence of miR-1205 (mut miR-1205) and KRAS 3’UTR (mut KRAS 3’UTR) were shown. I. Luciferase activity in cells transfected with miR-1205 and reporter plasmids containing wt or mut KRAS 3’UTR. J. Luciferase activity in cells transfected with miR-1205 or mut miR-1205 and reporter plasmids containing wt KRAS 3’UTR. K and L. Western blot and qRT-PCR were used to measure the KRAS protein and mRNA expression level both in A549 and H1975 cells after transfected with miR-1205 and miR-1205 mutant separately for 72 h. M. Schematic representation of the CRISPR/Cas9 mediated deletion of pri-miR-1205. The underlined is the sequence of mature miR-1205. N. The expression level of mature miR-1205 and KRAS protein in miR-1205 deleted A549 cells by CRISPR/CAS9. Data are presented as the mean ± SEM of three independent experiments (* or #P<0.05, ** or ##P<0.01, *** or ###P<0.001).
Target analysis of miR-1205 in lung cancer cell lines with mutant KRAS
The analysis of KRAS protein and miR-1205 expression levels in 8 lung cancer cell lines showed the same inverse correlation pattern as that in lung cancer patients (r = -0.9762, P<0.01; Supplementary Figure 1). Six NSCLC cell lines with different KRAS status were then used to examine their sensitivity to miR-1205 and KRAS siRNA (ranging from 0.001-10 nM). Due to the short period of treatment (72 h), growth inhibition of 30% (GI30, Figure 2A) and cellular viability after high-dose shock (10 nM, 107 folds of endogenous miRNA concentration, Figure 2B) were used to compare the sensitivity. A549 and H460, harboring KRAS G12S and Q61H mutation individually, were more sensitive to miR-1205 and KRAS siRNA (Cell viability was less than 50%) (Figure 2B). Subsequent cell cycle analysis found miR-1205 and siKRAS resulted in G0/G1 phase arrest, respectively, and A549 cells seemed to be a bit more sensitive (Figure 2C). Additionally, cellular apoptosis was not found after treatment of miR-1205 and KRAS siRNA (data not shown). Based on the above cellular functional analysis, 2835 targets of miR-1205 predicted by TargetScan were input into DAVID algorithm for gene annotation enrichment, KEGG pathway and gene-disease association analysis. Gene annotation enrichment and KEGG pathway analysis found a significant enrichment of miR-1205 targets in the pathway of cancer, RAS signaling, etc (Supplementary Figures 2 and 3).
Figure 2.

Targeting analysis of miR-1205 in lung cancer cell lines with mutant KRAS. A. Growth inhibition of 30% (GI30) analysis of lung cancer cell lines via MTT assay after transfected with indicated doses of miR-1205 or KRAS siRNA (0.001, 0.01, 0.1, 1, 10 nM) for 72 h, each group data was normalized to the negative control group. B. Cellular viability of lung cancer cell lines via MTT assay after transfected with 10 nM miR-1205 or KRAS siRNA for 72 h, each group data was normalized to the negative control group. C. Flow cytometry analysis of cell cycle in A549 and H1975 cells after transfected with miR-1205 mimics or siKRAS or NC for 48 h. D. KEGG pathway analysis of 2835 predicted targets of miR-1205 from TargetScan by using DAVID algorithm, the non-small cell lung cancer related pathway was shown, which was modified to remove the irrelevant genes. E and F. QRT-PCR and WB analysis of genes which both were predicted to be targeted by miR-1205 in the KRAS signaling pathway. Data are presented as the mean ± SEM of three independent experiments (* or #P<0.05, ** or ##P<0.01, *** or ###P<0.001).
In the non-small cell lung cancer related pathway from KEGG (Figure 2D, modified to remove the irrelevant genes), miR-1205 predictably targeted multiple cascades of RAS signaling: KRAS, NRAS, PI3K, PKB/AKT, forkhead, etc. Interestingly, MDM4, the endogenous inhibitor of p53, and E2Fs, activated by loss of p16INK4A (CDKN2A) in lung cancer [14,15,37,38], were both targeted by miR-1205 (Figure 2E). Therefore, we performed a screening using qRT-PCR and western blotting in A549 cells. MiR-1205 and KRAS siRNA literally downregulated KRAS signaling: KRAS, phosphorylated c-Raf (p-c-Raf), phosphorylated ERK1/2 (p-ERK1/2), and slightly influenced phosphorylated AKT (p-AKT) (Figure 2F). In p53-related signaling, miR-1205 and KRAS siRNA obviously decreased the protein level of MDM4 and increased phosphorylated p53 levels (Figure 2F). In RB/E2Fs signaling, miR-1205 and KRAS siRNA reduced the protein levels of E2F1 and SP1, a known downstream factor of E2F1 [39,40]. Additionally, miR-1205 and KRAS siRNA also downregulated the mRNA of MDM4 and E2F1 (Figure 2E), indicating the potential transcriptional regulation from KRAS signaling.
MiR-1205 regulated the expression of MDM4 and E2F1 via direct binding and indirect KRAS signaling inhibition
After screening, we firstly investigated the effects of MDM4 and E2F1 siRNAs on cellular viability of A549 and H460 cells. These two siRNAs knocked down the protein expression levels of MDM4 and E2F1 well (Figures 3A, 4A), and significantly reduced the cellular viability of A549 and H460 cells (Figures 3B, 4B). Similarly, miR-1205 dramatically downregulated the mRNA and protein levels of MDM4 and E2F1 in these two cell lines (Figures 3C and 3D, 4C and 4D). To confirm the sequence-dependent interaction between miR-1205 and MDM4, E2F1 mRNA, we constructed psiCHECK-2 vectors containing the 3’UTR of MDM4 and E2F1. As expected, miR-1205 inhibited the luciferase activity of the wild-type 3’UTR of MDM4 (wt 3’UTR, two binding sites), mutating the two predicted sites of miR-1205 rescued the inhibitory effect of miR-1205 (mut 3’UTR) (Figure 3E and 3F). Surprisingly, miR-1205 did not change the luciferase activity of E2F1 3’UTR (Supplementary Figure 4), while inhibited the luciferase activity of E2F1 coding sequence in psiCHECK2 vector (E2F1 CDS). Mutating the B binding site on E2F1 CDS could rescue the inhibitory effect of miR-1205 (mut B CDS, Figure 4E and 4F). Similar to KRAS, the mutant form (mut miR-1205) had no inhibitory effects on the luciferase activity of the MDM4 3’UTR and E2F1 CDS, genomic deletion of miR-1205 via CRISPR/CAS9 also increased the protein levels of MDM4 and E2F1 (Figures 3H, 4H).
Figure 3.

MDM4 expression was regulated by miR-1205 via direct 3’UTR binding and indirect KRAS signaling inhibition. A. MDM4 protein levels in A549 and H460 cells after transfected with siMDM4 or NC for 72 h, 10 nM. B. MTT analysis of A549 and H460 cells transfected with miR-1205 mimics or siMDM4 or NC for 72 h, 10 nM. C and D. QRT-PCR and WB analysis of MDM4 mRNA and protein levels in A549 and H460 cells after transfected with miR-1205. E. Predicted binding between miR-1205 and matched sequence in the 3’UTR of MDM4. Mutant sequence of miR-1205 (mut miR-1205) and MDM4 3’UTR (mut MDM4 3’UTR with mut A and mut B) were shown. F. Luciferase activity in cells transfected with miR-1205 and reporter plasmids containing wt or mut MDM4 3’UTR. G. Luciferase activity in cells transfected with miR-1205 or mut miR-1205 and reporter plasmids containing wt MDM4 3’UTR. H. MDM4 protein level in miR-1205 deleted A549 cells by CRISPR/CAS9. I. A549 or H460 cells were transfected with different dose of siKRAS (5, 10 nM) or NC for 72 h, p-ERK1/2, ERK1/2 and MDM4 protein levels were detected. J. A549 or H460 cells were treated with SCH772984 (0, 0.1, 1, 10 μM) for 24 h, and analyzed for the expression of p-ERK1/2 and MDM4. Data are presented as the mean ± SEM of three independent experiments (* or #P<0.05, ** or ##P<0.01, *** or ###P<0.001).
Figure 4.

E2F1 expression was regulated by miR-1205 via direct CDS binding and indirect KRAS signaling inhibition. A. E2F1 protein levels in A549 and H460 cells after transfected with siE2F1 or NC for 72 h, 10 nM. B. MTT analysis of A549 and H460 cells transfected with miR-1205 mimics or siE2F1 or NC for 72 h, 10 nM. C and D. QRT-PCR and WB analysis of E2F1 mRNA and protein levels in A549 and H460 cells after transfected with miR-1205. E. Predicted binding between miR-1205 and matched sequence in the CDS of E2F1. Mutant sequence of miR-1205 (mut miR-1205) and E2F1 CDS (mut E2F1 CDS with mut A and mut B) were shown. F. Luciferase activity in cells transfected with miR-1205 and reporter plasmids containing wt or mut E2F1 CDS. G. Luciferase activity in cells transfected with miR-1205 or mut miR-1205 and reporter plasmids containing wt E2F1 CDS. H. E2F1 protein level in miR-1205 deleted A549 cells by CRISPR/CAS9. I. A549 or H460 cells were transfected with different dose of siKRAS (5, 10 nM) or NC for 72 h, KRAS signaling and E2F1 protein level were analyzed. J. A549 or H460 cells were treated with SCH772984 (0, 0.1, 1, 10 μM) for 24 h, and analyzed for the expression of p-ERK1/2 and E2F1. Data are presented as the mean ± SEM of three independent experiments (* or #P<0.05, ** or ##P<0.01, *** or ###P<0.001).
To confirm the role of KRAS signaling in the expression of MDM4 and E2F1, KRAS siRNA and a p-ERK1/2 specific inhibitor (SCH772984) were used and found that knockdown of the upstream key protein, KRAS, or inhibited the downstream effector, p-ERK1/2, both markedly and dose-dependently reduced the expression of MDM4 and E2F1 (Figures 3I and 3J, 4I and 4J). Forced expression of KRAS apparently restored the inhibitory effects of miR-1205 on MDM4 and E2F1 in A549 and H460 cell lines (Figure 5A). Functionally, overexpressing of KRAS and MDM4 could rescue the growth inhibition of miR-1205, and overexpressing of E2F1 only had a partial rescuing (Figure 5B-D).
Figure 5.
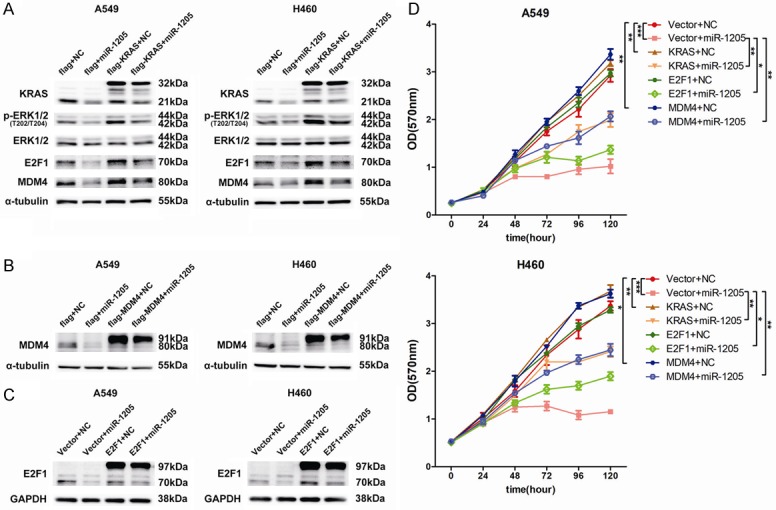
Overexpression of KRAS or E2F1 or MDM4 reverses the function of miR-1205. A. p-ERK1/2, ERK1/2, MDM4 and E2F1 protein levels were measured by western blot in A549 and H460 cells after transfected with indicated miRNA mimics or plasmids. B and C. MDM4 and E2F1 protein levels were detected after transfected with indicated miRNA mimics or plasmids. D. MTT analysis of A549 and H460 cells after transfected with indicated miRNA mimics or plasmids at indicated time points. Data are presented as the mean ± SEM of three independent experiments (*P<0.05, **P<0.01, ***P<0.001).
MiR-1205 suppressed tumor growth in vivo and negatively correlated with MDM4 and E2F1 clinically
The in-vivo effect of miR-1205 was evaluated in nude mice xenografted human lung tumors derived from A549 cells. The mimics of miR-1205 and negative control (NC) were separately packaged into liposomes and were peritumorally injected for three times a week. MiR-1205 markedly reduced the tumor volume (Figure 6A), and decreased tumor weight (Figure 6B). 72 h post the final injection, miR-1205 level was still detectable in the tumor tissue (Figure 6C). The protein levels of KRAS, ERK2, E2F1 and MDM4 in tumor tissues were obviously reduced (Figure 6D and 6E). The expression of MDM4 and E2F1 in paired peri-tumor and tumor tissues of lung adenocarcinoma were compared using TCGA data and clinical samples in our cohort. MDM4 did not show a higher level in tumor tissues of TCGA, while significantly increased in the tumor tissues from our cohort (Figure 6F and 6H). E2F1 showed a marked augment in the tumor tissue both in TCGA data and our cohort (Figure 6F and 6H). Correlation analysis found an apparent positive correlation between KRAS and E2F1, but not MDM4 (Figure 6G), and negative correlations between miR-1205 and MDM4 (P = 0.4007), E2F1 (P = 0.0275) (Figure 6I).
Figure 6.
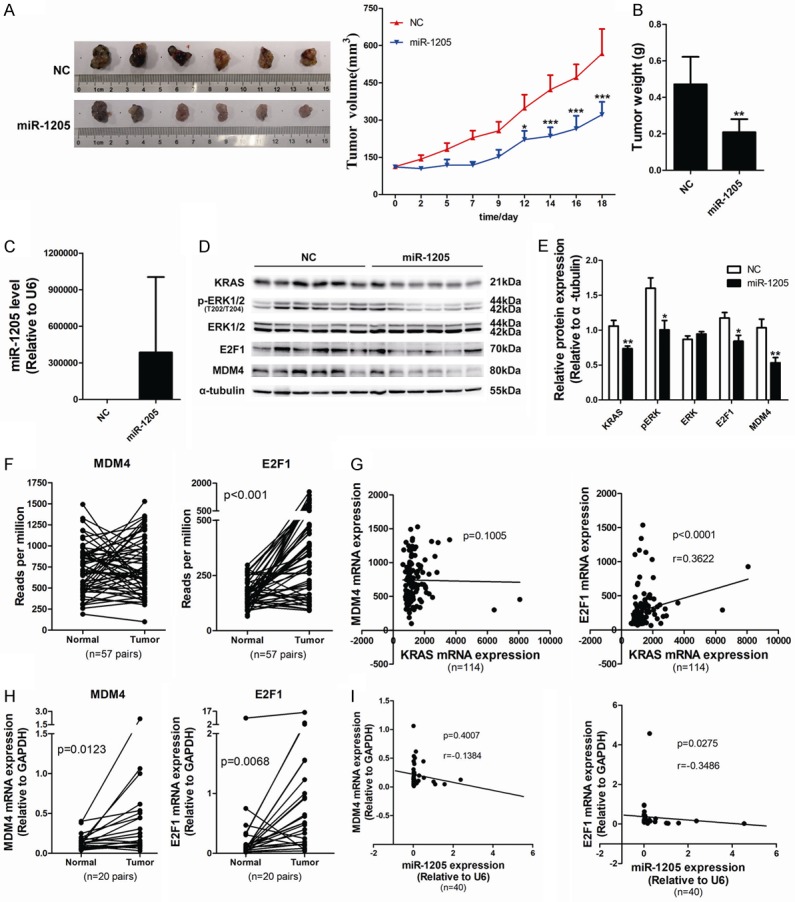
MiR-1205 suppresses tumor growth in vivo and negatively correlated with MDM4 and E2F1 clinically. A. Tumor growth curves of subcutaneously implanted tumor model in nude mice are shown (n = 6). Tumor volumes were monitored three times a week and calculated as length × width × width/2. B. Tumor weight was recorded at the day of experiment termination. C. MiR-1205 level was detected by qRT-PCT using TaqMan MicroRNA assay kit. D and E. KRAS signaling, MDM4 and E2F1 protein levels of NC group and miR-1205 group were detected and analyzed. F. Statistical analysis of the data from TCGA database for MDM4 and E2F1 expression in lung cancer tissues. The MDM4 and E2F1 mRNA expression level was compared between tumor and adjacent tumor tissue samples (n = 57). G. Spearman’s correlation analysis of the correlation between KRAS mRNA and MDM4 or E2F1 mRNA expression level. H. QRT-PCR was used to measure the MDM4 and E2F1 mRNA expression in clinical lung cancer tissue pairs (n = 20). I. Spearman’s correlation analysis of the correlation between the miR-1205 and MDM4 or E2F1 mRNA expression level in lung cancer tissues. Data are presented as the mean ± SEM of three independent experiments (*P<0.05, **P<0.01, ***P<0.001).
Discussion
Activation of oncogenes and inactivation of tumor suppressor genes are the critical factors in tumor initiation and progression, which always step-by-step or simultaneously happen and contribute great synergistic effects on the advancing of cancer [41,42]. KRAS is the most frequently mutated protein in human cancer. The synergy of oncogenic KRAS and the mutation or loss of tumor suppressor genes such as p53, EZH2, CDKN2A. etc, drives the occurrence, invasion and metastasis of tumor [43-45]. Besides the cooperation of genomic alteration, oncogenic KRAS also can inactivate various tumor suppressor genes through its downstream signaling: transcriptionally upregulating MDM4 via c-ETS-1 [19]; enhancing the phosphorylation of RB and promoting the expression of E2Fs [20,21,46], while in non-small cell lung cancer, this synergy has not been clearly clarified. The present study firstly confirmed the role of oncogenic KRAS and its signaling in MDM4 and E2F1 overexpression in lung cancer cell lines, and found miR-1205 dually inhibited this synergy and functioned as a tumor suppressor in vitro and in vivo: miR-1205 directly bound to the mRNAs of MDM4 and E2F1 and post-transcriptionally repressed their expression, meanwhile, miR-1205 indirectly suppressed their expression through inhibiting KRAS signaling.
In our study, KRAS siRNA obviously decreased the mRNA levels of MDM4 and E2F1, implying the potential transcriptional regulation by KRAS signaling on MDM4 and E2F1. In the study of Daniele and etc., ChIP and luciferase assay clearly demonstrated that the downstream transcription factors of ERK2, c-ETS-1 and ELK-1 bound to the promoter of MDM4 in KRAS signaling-dependent manner and transcriptionally regulated the expression of MDM4 [19]. In addition, miR-1205 and siKRAS reduced MDM4 protein to a similar level, while miR-1205 induced higher phosphorylation of p53 (Figure 2F), which might be due to the multi-target characteristic of microRNA and multiple signaling ways tightly regulating p53 such as ATM/ATR, PHF1, etc. [47,48].
The influence of RAS signaling on E2F1 mRNA has been reported multiple times [40,49]. Knockdown KRAS by siRNA or inactivating RAS by farnesyl thiosalicylic acid downregulated the mRNA level of E2F1 [20,49]. Overexpression of KRAS upregulated E2F1 mRNA [40]. MAPK signaling inhibitors including U0126 (ERK2 inhibitor) and cobimetinib (MEKs inhibitor) could decrease the transcript of E2F1 [49,50]. The previous work strongly indicated the potential that the expression of E2F1 is dependent on the RAS-ERK1/2 activity; however, the intermediates between ERK1/2 and E2F1 are still unknown, the precise regulation mechanisms of ERK1/2 on E2F1 need more work.
Both our and Daniele’s work strongly demonstrated the role of RAS signaling in MDM4 transcription in cancer cell lines [19]. While this study did not find a distinct correlation between the expression levels of MDM4 mRNA and KRAS mRNA or miR-1205. MDM4 gene generates two alternative transcripts through including or skipping of exon 6. One containing exon 6 encodes a full-length MDM4 protein (MDM4-FL), whereas the second alternative transcript with the skipping of exon 6, encodes a short carboxy-truncated MDM4 protein (MDM4-S) [51]. Mice engineered for an Mdm4 exon 6 skipping exhibited increased p53 activity and Mdm4-FL decrease [52]. In the heterozygous mice, the mRNA levels of Mdm4-S were higher than Mdm4-FL, but Mdm4-FL protein was much more abundant than Mdm4-S, implying the potential post-transcriptional negative regulation of Mdm4-S, and the skipping of MDM4 exon 6 may be a post-transcriptional mechanism to decrease the protein level of MDM4-FL. Consistently, in melanoma cells where MDM4 protein is often overexpressed, there is no correlation between MDM4 protein levels and total MDM4 mRNA levels [53]. The mechanism that underlies MDM4 upregulation in different cancer cells depends on a specific alternative splicing switch promoting exon 6 inclusion [54], and this mechanism may influence the outcome of correlation analysis using mRNA level of MDM4 in this study.
In conclusion, our study identified that miR-1205 was down-regulated in NSCLC and suppressed tumor growth by targeting KRAS, MDM4 and E2F1 in a dual inhibition way, which provide a rationale for the development of hsa-miR-1205 as a potential therapeutic target against NSCLC.
Acknowledgements
This work was supported by grants from the National Science and Technology Major Project [2015ZX09102005], Personalized Medicines-Molecular Signature-based Drug Discovery and Development, Strategic Priority Research Program of the Chinese Academy of Sciences, Grant No. XDA12020339, One Hundred Talent Program of Chinese Academy of Sciences (to R.H.), and the Research Fund of Institutes for Drug Discovery and Development, Chinese Academy of Sciences (CASIMM0120163010, to R.H.).
Disclosure of conflict of interest
None.
Supporting Information
References
- 1.Ferlay J, Soerjomataram I, Dikshit R, Eser S, Mathers C, Rebelo M, Parkin DM, Forman D, Bray F. Cancer incidence and mortality worldwide: sources, methods and major patterns in GLOBOCAN 2012. Int J Cancer. 2015;136:E359–386. doi: 10.1002/ijc.29210. [DOI] [PubMed] [Google Scholar]
- 2.Torre LA, Siegel RL, Jemal A. Lung cancer statistics. Adv Exp Med Biol. 2016;893:1–19. doi: 10.1007/978-3-319-24223-1_1. [DOI] [PubMed] [Google Scholar]
- 3.Chen Z, Fillmore CM, Hammerman PS, Kim CF, Wong KK. Non-small-cell lung cancers: a heterogeneous set of diseases. Nat Rev Cancer. 2014;14:535–546. doi: 10.1038/nrc3775. [DOI] [PMC free article] [PubMed] [Google Scholar]
- 4.Ventura A, Kirsch DG, McLaughlin ME, Tuveson DA, Grimm J, Lintault L, Newman J, Reczek EE, Weissleder R, Jacks T. Restoration of p53 function leads to tumour regression in vivo. Nature. 2007;445:661–665. doi: 10.1038/nature05541. [DOI] [PubMed] [Google Scholar]
- 5.Taylor WR, Egan SE, Mowat M, Greenberg AH, Wright JA. Evidence for synergistic interactions between ras, myc and a mutant form of p53 in cellular transformation and tumor dissemination. Oncogene. 1992;7:1383–1390. [PubMed] [Google Scholar]
- 6.Lee SH, Lee SJ, Jung YS, Xu YB, Kang HS, Ha NC, Park BJ. Blocking of p53-Snail binding, promoted by oncogenic K-Ras, recovers p53 expression and function. Neoplasia. 2009;11:22–31. doi: 10.1593/neo.81006. [DOI] [PMC free article] [PubMed] [Google Scholar]
- 7.Inamura K, Takeuchi K, Togashi Y, Hatano S, Ninomiya H, Motoi N, Mun MY, Sakao Y, Okumura S, Nakagawa K, Soda M, Choi YL, Mano H, Ishikawa Y. EML4-ALK lung cancers are characterized by rare other mutations, a TTF-1 cell lineage, an acinar histology, and young onset. Mod Pathol. 2009;22:508–515. doi: 10.1038/modpathol.2009.2. [DOI] [PubMed] [Google Scholar]
- 8.Carvajal LA, Neriah DB, Senecal A, Benard L, Thiruthuvanathan V, Yatsenko T, Narayanagari SR, Wheat JC, Todorova TI, Mitchell K, Kenworthy C, Guerlavais V, Annis DA, Bartholdy B, Will B, Anampa JD, Mantzaris I, Aivado M, Singer RH, Coleman RA, Verma A, Steidl U. Dual inhibition of MDMX and MDM2 as a therapeutic strategy in leukemia. Sci Transl Med. 2018;10 doi: 10.1126/scitranslmed.aao3003. [DOI] [PMC free article] [PubMed] [Google Scholar]
- 9.Xiong SB, Pant V, Zhang Y, Aryal NK, You MJ, Kusewitt D, Lozano G. The p53 inhibitor Mdm4 cooperates with multiple genetic lesions in tumourigenesis. J Pathol. 2017;241:501–510. doi: 10.1002/path.4854. [DOI] [PMC free article] [PubMed] [Google Scholar]
- 10.Wasylishen AR, Lozano G. Attenuating the p53 Pathway in human cancers: many means to the same end. Cold Spring Harb Perspect Med. 2016;6 doi: 10.1101/cshperspect.a026211. [DOI] [PMC free article] [PubMed] [Google Scholar]
- 11.Wade M, Li YC, Wahl GM. MDM2, MDMX and p53 in oncogenesis and cancer therapy. Nat Rev Cancer. 2013;13:83–96. doi: 10.1038/nrc3430. [DOI] [PMC free article] [PubMed] [Google Scholar]
- 12.Yin J, Fu WF, Dai L, Jiang ZY, Liao HY, Chen WB, Pan L, Zhao J. ANKRD22 promotes progression of non-small cell lung cancer through transcriptional up-regulation of E2F1. Sci Rep. 2017;7:4430. doi: 10.1038/s41598-017-04818-y. [DOI] [PMC free article] [PubMed] [Google Scholar]
- 13.McNair C, Xu K, Mandigo AC, Benelli M, Leiby B, Rodrigues D, Lindberg J, Gronberg H, Crespo M, De Laere B, Dirix L, Visakorpi T, Li F, Feng FY, de Bono J, Demichelis F, Rubin MA, Brown M, Knudsen KE. Differential impact of RB status on E2F1 reprogramming in human cancer. J Clin Invest. 2018;128:341–358. doi: 10.1172/JCI93566. [DOI] [PMC free article] [PubMed] [Google Scholar]
- 14.Choi S, Kim HR, Sung CO, Kim J, Kim S, Ahn SM, Choi CM, Chun SM, Choi EK, Kim SW, Kim YH, Lee JY, Song JS, Kim D, Haq F, Lee SY, Lee JE, Jung WR, Jang HY, Yang E, Lee C, Yu E, Kong G, Baek D, Jang SJ. Genomic alterations in the RB pathway indicate prognostic outcomes of early-stage lung adenocarcinoma. Clin Cancer Res. 2015;21:2613–2623. doi: 10.1158/1078-0432.CCR-14-0519. [DOI] [PubMed] [Google Scholar]
- 15.Campbell PM, Der CJ. Oncogenic Ras and its role in tumor cell invasion and metastasis. Semin Cancer Biol. 2004;14:105–114. doi: 10.1016/j.semcancer.2003.09.015. [DOI] [PubMed] [Google Scholar]
- 16.Riely GJ, Marks J, Pao W. KRAS mutations in non-small cell lung cancer. Proc Am Thorac Soc. 2009;6:201–205. doi: 10.1513/pats.200809-107LC. [DOI] [PubMed] [Google Scholar]
- 17.Zhou B, Der CJ, Cox AD. The role of wild type RAS isoforms in cancer. Semin Cell Dev Biol. 2016;58:60–69. doi: 10.1016/j.semcdb.2016.07.012. [DOI] [PMC free article] [PubMed] [Google Scholar]
- 18.Hoa M, Davis SL, Ames SJ, Spanjaard RA. Amplification of wild-type K-ras promotes growth of head and neck squamous cell carcinoma. Cancer Res. 2002;62:7154–7156. [PubMed] [Google Scholar]
- 19.Gilkes DM, Pan Y, Coppola D, Yeatman T, Reuther GW, Chen J. Regulation of MDMX expression by mitogenic signaling. Mol Cell Biol. 2008;28:1999–2010. doi: 10.1128/MCB.01633-07. [DOI] [PMC free article] [PubMed] [Google Scholar]
- 20.Chu PC, Yang MC, Kulp SK, Salunke SB, Himmel LE, Fang CS, Jadhav AM, Shan YS, Lee CT, Lai MD, Shirley LA, Bekaii-Saab T, Chen CS. Regulation of oncogenic KRAS signaling via a novel KRAS-integrin-linked kinase-hnRNPA1 regulatory loop in human pancreatic cancer cells. Oncogene. 2016;35:3897–3908. doi: 10.1038/onc.2015.458. [DOI] [PubMed] [Google Scholar]
- 21.Bowman BM, Sebolt KA, Hoff BA, Boes JL, Daniels DL, Heist KA, Galban CJ, Patel RM, Zhang J, Beer DG, Ross BD, Rehemtulla A, Galban S. Phosphorylation of FADD by the kinase CK1alpha promotes KRASG12D-induced lung cancer. Sci Signal. 2015;8:ra9. doi: 10.1126/scisignal.2005607. [DOI] [PMC free article] [PubMed] [Google Scholar]
- 22.Baslan T, Hicks J. Unravelling biology and shifting paradigms in cancer with single-cell sequencing. Nat Rev Cancer. 2017;17:557–569. doi: 10.1038/nrc.2017.58. [DOI] [PubMed] [Google Scholar]
- 23.Sethi N, Kang Y. Unravelling the complexity of metastasis-molecular understanding and targeted therapies. Nat Rev Cancer. 2011;11:735–748. doi: 10.1038/nrc3125. [DOI] [PMC free article] [PubMed] [Google Scholar]
- 24.Ambros V. The functions of animal microRNAs. Nature. 2004;431:350–355. doi: 10.1038/nature02871. [DOI] [PubMed] [Google Scholar]
- 25.Bartel DP. MicroRNAs: genomics, biogenesis, mechanism, and function. Cell. 2004;116:281–297. doi: 10.1016/s0092-8674(04)00045-5. [DOI] [PubMed] [Google Scholar]
- 26.Calin GA, Croce CM. MicroRNA signatures in human cancers. Nat Rev Cancer. 2006;6:857–866. doi: 10.1038/nrc1997. [DOI] [PubMed] [Google Scholar]
- 27.Bartel DP. MicroRNAs: target recognition and regulatory functions. Cell. 2009;136:215–233. doi: 10.1016/j.cell.2009.01.002. [DOI] [PMC free article] [PubMed] [Google Scholar]
- 28.He XY, Chen JX, Zhang Z, Li Cl, Peng Ql, Peng HM. The let-7a microRNA protects from growth of lung carcinoma by suppression of k-Ras and c-Myc in nude mice. J Cancer Res Clin Oncol. 2009;136:1023–1028. doi: 10.1007/s00432-009-0747-5. [DOI] [PMC free article] [PubMed] [Google Scholar]
- 29.Edmonds MD, Boyd KL, Moyo T, Mitra R, Duszynski R, Arrate MP, Chen X, Zhao Z, Blackwell TS, Andl T, Eischen CM. MicroRNA-31 initiates lung tumorigenesis and promotes mutant KRAS-driven lung cancer. J Clin Invest. 2015;126:349–64. doi: 10.1172/JCI82720. [DOI] [PMC free article] [PubMed] [Google Scholar]
- 30.Kasinski AL, Slack FJ. miRNA-34 prevents cancer initiation and progression in a therapeutically resistant K-ras and p53-induced mouse model of lung adenocarcinoma. Cancer Res. 2012;72:5576–5587. doi: 10.1158/0008-5472.CAN-12-2001. [DOI] [PMC free article] [PubMed] [Google Scholar]
- 31.Barger JF, Nana-Sinkam SP. MicroRNA as tools and therapeutics in lung cancer. Respir Med. 2015;109:803–812. doi: 10.1016/j.rmed.2015.02.006. [DOI] [PMC free article] [PubMed] [Google Scholar]
- 32.Miao L, Yao H, Li C, Pu M, Yao X, Yang H, Qi X, Ren J, Wang Y. A dual inhibition: microRNA-552 suppresses both transcription and translation of cytochrome P450 2E1. Biochim Biophys Acta. 2016;1859:650–662. doi: 10.1016/j.bbagrm.2016.02.016. [DOI] [PubMed] [Google Scholar]
- 33.Ran FA, Hsu PD, Wright J, Agarwala V, Scott DA, Zhang F. Genome engineering using the CRISPR-Cas9 system. Nat Protoc. 2013;8:2281–2308. doi: 10.1038/nprot.2013.143. [DOI] [PMC free article] [PubMed] [Google Scholar]
- 34.Clark PA, Bhattacharya S, Elmayan A, Darjatmoko SR, Thuro BA, Yan MB, van Ginkel PR, Polans AS, Kuo JS. Resveratrol targeting of AKT and p53 in glioblastoma and glioblastoma stem-like cells to suppress growth and infiltration. J Neurosurg. 2017;126:1448–1460. doi: 10.3171/2016.1.JNS152077. [DOI] [PMC free article] [PubMed] [Google Scholar]
- 35.Marini I, Siegemund M, Hutt M, Kontermann RE, Pfizenmaier K. Antitumor activity of a mesenchymal stem cell line stably secreting a tumor-targeted TNF-related apoptosis-inducing ligand fusion protein. Front Immunol. 2017;8:536. doi: 10.3389/fimmu.2017.00536. [DOI] [PMC free article] [PubMed] [Google Scholar]
- 36.Chang CE, Hsieh CM, Chen LC, Su CY, Liu DZ, Jhan HJ, Ho HO, Sheu MT. Novel application of pluronic lecithin organogels (PLOs) for local delivery of synergistic combination of docetaxel and cisplatin to improve therapeutic efficacy against ovarian cancer. Drug Deliv. 2018;25:632–643. doi: 10.1080/10717544.2018.1440444. [DOI] [PMC free article] [PubMed] [Google Scholar]
- 37.Dick FA, Goodrich DW, Sage J, Dyson NJ. Non-canonical functions of the RB protein in cancer. Nat Rev Cancer. 2018;18:442–451. doi: 10.1038/s41568-018-0008-5. [DOI] [PMC free article] [PubMed] [Google Scholar]
- 38.Collisson EA. RB and prognosis in resected lung adenocarcinoma. Clin Cancer Res. 2015;21:2418–2420. doi: 10.1158/1078-0432.CCR-14-2931. [DOI] [PubMed] [Google Scholar]
- 39.Elena C, Banchio C. Specific interaction between E2F1 and Sp1 regulates the expression of murine CTP: phosphocholine cytidylyltransferase alpha during the S phase. Biochim Biophys Acta. 2010;1801:537–546. doi: 10.1016/j.bbalip.2010.01.005. [DOI] [PubMed] [Google Scholar]
- 40.Berkovich E, Ginsberg D. Ras induces elevation of E2F-1 mRNA levels. J Biol Chem. 2001;276:42851–42856. doi: 10.1074/jbc.M103596200. [DOI] [PubMed] [Google Scholar]
- 41.Hanahan D, Weinberg RA. Hallmarks of cancer: the next generation. Cell. 2011;144:646–674. doi: 10.1016/j.cell.2011.02.013. [DOI] [PubMed] [Google Scholar]
- 42.Ding L, Bailey MH, Porta-Pardo E, Thorsson V, Colaprico A, Bertrand D, Gibbs DL, Weerasinghe A, Huang KL, Tokheim C, Cortés-Ciriano I, Jayasinghe R, Chen F, Yu L, Sun S, Olsen C, Kim J, Taylor AM, Cherniack AD, Akbani R, Suphavilai C, Nagarajan N, Stuart JM, Mills GB, Wyczalkowski MA, Vincent BG, Hutter CM, Zenklusen JC, Hoadley KA, Wendl MC, Shmulevich L, Lazar AJ, Wheeler DA, Getz G Cancer Genome Atlas Research Network. Perspective on oncogenic processes at the end of the beginning of cancer genomics. Cell. 2018;173:305–320. e10. doi: 10.1016/j.cell.2018.03.033. [DOI] [PMC free article] [PubMed] [Google Scholar]
- 43.Boutin AT, Liao WT, Wang M, Hwang SS, Karpinets TV, Cheung H, Chu GC, Jiang S, Hu J, Chang K, Vilar E, Song X, Zhang J, Kopetz S, Futreal A, Wang YA, Kwong LN, DePinho RA. Oncogenic Kras drives invasion and maintains metastases in colorectal cancer. Genes Dev. 2017;31:370–382. doi: 10.1101/gad.293449.116. [DOI] [PMC free article] [PubMed] [Google Scholar]
- 44.Muzumdar MD, Dorans KJ, Chung KM, Robbins R, Tammela T, Gocheva V, Li CM, Jacks T. Clonal dynamics following p53 loss of heterozygosity in Kras-driven cancers. Nat Commun. 2016;7:12685. doi: 10.1038/ncomms12685. [DOI] [PMC free article] [PubMed] [Google Scholar]
- 45.Vaz M, Hwang SY, Kagiampakis I, Phallen J, Patil A, O’Hagan HM, Murphy L, Zahnow CA, Gabrielson E, Velculescu VE, Easwaran HP, Baylin SB. Chronic cigarette smoke-induced epigenomic changes precede sensitization of bronchial epithelial cells to single-step transformation by KRAS mutations. Cancer Cell. 2017;32:360–376. e6. doi: 10.1016/j.ccell.2017.08.006. [DOI] [PMC free article] [PubMed] [Google Scholar]
- 46.McNair C, Xu KX, Mandigo AC, Benelli M, Leiby B, Rodrigues D, Lindberg J, Gronberg H, Crespo M, De Laere B, Dirix L, Visakorpi T, Li FG, Feng FY, de Bono J, Demichelis F, Rubin MA, Brown M, Knudsen KE. Differential impact of RB status on E2F1 reprogramming in human cancer. J Clin Invest. 2018;128:341–358. doi: 10.1172/JCI93566. [DOI] [PMC free article] [PubMed] [Google Scholar]
- 47.Kruse JP, Gu W. Modes of p53 regulation. Cell. 2009;137:609–622. doi: 10.1016/j.cell.2009.04.050. [DOI] [PMC free article] [PubMed] [Google Scholar]
- 48.Yang Y, Wang CJ, Zhang PZ, Gao K, Wang DJ, Yu HX, Zhang T, Jiang SR, Hexige S, Hong ZH, Yasui A, Liu JO, Huang HJ, Yu L. Polycomb group protein PHF1 regulates p53-dependent cell growth arrest and apoptosis. J Biol Chem. 2013;288:529–539. doi: 10.1074/jbc.M111.338996. [DOI] [PMC free article] [PubMed] [Google Scholar]
- 49.Blum R, Nakdimon I, Goldberg L, Elkon R, Shamir R, Rechavi G, Kloog Y. E2F1 identified by promoter and biochemical analysis as a central target of glioblastoma cell-cycle arrest in response to Ras inhibition. Int J Cancer. 2006;119:527–538. doi: 10.1002/ijc.21735. [DOI] [PubMed] [Google Scholar]
- 50.Gong S, Xu D, Zhu J, Zou F, Peng R. Efficacy of the MEK inhibitor cobimetinib and its potential application to colorectal cancer cells. Cell Physiol Biochem. 2018;47:680–693. doi: 10.1159/000490022. [DOI] [PubMed] [Google Scholar]
- 51.Rallapalli R, Strachan G, Cho B, Mercer WE, Hall DJ. A novel MDMX transcript expressed in a variety of transformed cell lines encodes a truncated protein with potent p53 repressive activity. J Biol Chem. 1999;274:8299–8308. doi: 10.1074/jbc.274.12.8299. [DOI] [PubMed] [Google Scholar]
- 52.Bardot B, Bouarich-Bourimi R, Leemput J, Lejour V, Hamon A, Plancke L, Jochemsen AG, Simeonova I, Fang M, Toledo F. Mice engineered for an obligatory Mdm4 exon skipping express higher levels of the Mdm4-S isoform but exhibit increased p53 activity. Oncogene. 2015;34:2943–2948. doi: 10.1038/onc.2014.230. [DOI] [PubMed] [Google Scholar]
- 53.Gembarska A, Luciani F, Fedele C, Russell EA, Dewaele M, Villar S, Zwolinska A, Haupt S, de Lange J, Yip D, Goydos J, Haigh JJ, Haupt Y, Larue L, Jochemsen A, Shi HB, Moriceau G, Lo RS, Ghanem G, Shackleton M, Bernal F, Marine JC. MDM4 is a key therapeutic target in cutaneous melanoma. Nat Med. 2012;18:1239–47. doi: 10.1038/nm.2863. [DOI] [PMC free article] [PubMed] [Google Scholar]
- 54.Bardot B, Toledo F. Targeting MDM4 splicing in cancers. Genes (Basel) 2017;8 doi: 10.3390/genes8020082. [DOI] [PMC free article] [PubMed] [Google Scholar]
Associated Data
This section collects any data citations, data availability statements, or supplementary materials included in this article.