Abstract
For decades, E2F1 has been recognized as a retinoblastoma protein (RB) binding transcription factor that regulates the cell cycle. E2F1 binds preferentially to RB and accelerates the cell cycle in most cancer cells. However, it is thought that E2F1 modulates cell proliferation in other ways as well. Herein, it has been discovered that in pathological tissues derived from hepatocellular carcinoma (HCC) patients, E2F1 correlates positively with IQGAP3 and that both of these factors are highly expressed (N = 164, R = 0.6716). In addition, a high level of E2F1 or IQGAP3 predicted poor survival in HCC patients. Further study determined that E2F1 transactivates IQGAP3, the GTPase binding protein in MHCC-97H cells. Co-immunoprecipitation analysis indicated that IQGAP3 interacts with PKCδ and competitively inhibits the interaction between PKCδ and PKCα, resulting in phosphorylation of PKCα activation and promotion of cell proliferation. This study reveals that highly expressed E2F1 not only transactivates cell-cycle-related factors but also promotes HCC proliferation by activating the phosphorylation of PKCα.
Keywords: E2F1, IQGAP3, hepatocellular carcinoma, PKCα activation, cell proliferation
Introduction
Hepatocellular carcinoma (HCC) is the third leading cause of cancer-related deaths worldwide, and it has limited treatment options [1-3]. Hepatitis B virus (HBV) and hepatitis C virus (HCV) infections increase the occurrence of HCC, and statistically more than 80% of HCC patients are infected with HBV or HCV [2,3]. Recurrence and metastasis are the main causes of HCC-related deaths [4]. Generally, the progression of HCC advances rapidly as plentiful vessels exist in pathological tissues, providing cancer cells with energy and promoting cell proliferation [5]. Therefore, to extend the survival time of HCC patients, it is critical to control the proliferation of HCC cells in the early stages of disease [6,7].
E2F1 is a common transcription co-factor that regulates the cell cycle via the retinoblastoma protein (RB), a recognized E2F1 binding protein [8,9]. The CDK4-pRB-E2F1 axis is essential for progression of the cell cycle in normal and cancer cells, and if highly expressed, E2F1 promotes cell proliferation in cancer cells [10]. It is also known that E2F1 is involved in the modulation of apoptosis through p53-dependent or -independent pathways [11]. However, it is thought that E2F1, as a vital transcription factor, might regulate the cell cycle or cell proliferation through its transcriptional products.
IQGAP3 is a scaffolding protein that is highly expressed in most cancers [12,13]. IQGAP3 binds the small GTPases Rac1 and cdc42 through GAP-related domains [14]. It has been reported that IQGAP3 regulates small GTPases by stabilizing their GTP-bound forms. Previous studies indicated that highly expressed IQGAP3 can promote the proliferation of cancer cells through the EGFR-ERK signaling pathway, but how IQGAP3 activates this pathway is poorly understood [15,16].
In this study, results showed that E2F1 correlated positively with IQGAP3 in HCC pathological tissues. Highly expressed E2F1 transactivated IQGAP3 in HCC cells and IQGAP3, as a potential GTPase-binding protein, competitively bound to PKCδ, which reduced the interaction of PKCδ and PKCα. PKCα was activated while PKCδ dissociated, resulting in activation of the AKT signaling pathway and promotion of cell proliferation. This study revealed that E2F1 and IQGAP3 play critical roles in the regulation of PKCα activity, and that IQGAP3 may serve as a potential target in combating HCC proliferation.
Materials and methods
Reagents and antibodies
Dulbecco’s modified Eagle’s medium (DMEM) was purchased from GE Healthcare Inc. (Lafayette, CO, USA). Fetal bovine serum (FBS), Lipofectamine 3000, Lipofectamine RNAi Max, hygromycin and puromycin were purchased from Thermo Fisher (Carlsbad, CA, USA). Antibodies against IQGAP3 were obtained from Novus (Littleton, CO, USA). Antibodies against E2F1, PKCδ, p-PKCα (T638), PKCα, p-Akt (S473), Akt, BrdU and rabbit IgG were purchased from Cell Signaling Technology (Danvers, MA, USA). Antibodies against β-actin and HRP-conjugated secondary antibodies against rabbit IgG and mouse IgG were purchased from EarthOx (San Francisco, CA, USA). Alexa Fluor 568 conjugated secondary antibodies against mouse IgG were obtained from Thermo Fisher.
Cell culture
MHCC-97H cells were purchased from the Liver Cancer Institute (Zhongshan Hospital, Fudan University, China) and HepG2 cells were obtained from American Type Culture Collection (ATCC, Manassas, VA). Cells above were cultured in Dulbecco’s modified Eagle’s medium supplemented with 10% FBS in 5% CO2 at 37°C. Cell lines above were authenticated by STR profiling at Cobioer Bioscience Co., Ltd. (Nanjing, China) and experiments were performed within <10 passages after authentication.
Immunohistochemistry
For analysis of the correlation between E2F1 and IQGAP3 expression, pathological tissues (N = 164) were freshly obtained from HCC patients undergoing surgery at Sanmen People’s Hospital of Zhejiang (Sanmen, China). The Institutional Review Board at Sanmen People’s Hospital approved the protocol of this study and all patients were provided with informed consent. Immunohistochemistry was performed and analyzed as described in the previous study [17].
Vectors, siRNAs and construction of stably transfected cells
E2F1 and IQGAP3 expression vectors were purchased from Sinobiological Inc. (Beijing, China). E2F1 and IQGAP3 siRNAs were purchased from Genepharma (Shanghai, China). Vectors containing shRNAs targeting IQGAP3 were constructed based on the pLKO.1-turbo-GFP vector (from Lu Sheming’s lab, Xi’an Jiaotong University, Xi’an, China). For construction of stably transfected cells, HepG2 and MHCC-97H cells were seeded onto 24-well plates. HepG2 cells were transfected with pCMV-blank (Beyotime Biotech Inc, Nanjing, China) or pCMV-IQGAP3 vectors and screened using hygromycin (100 μg/ml) for 10 days, and MHCC-97H cells were transfected with pLKO.1-turbo-GFP or pLKO.1-turbo-GFP-shIQGAP3 vectors and screened using puromycin (2 μg/ml) for 6 days. Positive colonies were identified by comparison with shV groups using immunoblotting analysis. Stably transfected HepG2 cells were maintained using DMEM containing hygromycin (30 μg/ml), and stably transfected MHCC-97H cells were maintained using DMEM containing puromycin (1 μg/ml). Sequences of siRNAs and shRNAs are listed in Table S1A and S1B.
Immunoblotting analysis
For whole cell protein extraction, the cells were lysed using RIPA lysis buffer (Merck-Millipore, Billerica, MA, USA) for 30 minutes on ice and boiled for 5 minutes after centrifugation (12,000 × g, 15 minutes). The samples were subjected to SDS-PAGE, and immunoblotting was performed as described previously [17]. Primary antibodies were diluted in 1 × TBST with 5% Bovine Serum Albumin (BSA) as the following ratio: IQGAP3 (1:1000); E2F1, PKCδ, p-PKCα (T638), PKCα, p-Akt (S473), Akt (1:2000); β-actin (1:5000).
Chromatin immunoprecipitation assay
Chromatin immunoprecipitation (ChIP) assay was performed using the SimpleChIP Enzymatic Chromatin IP Kit (Cell Signaling Technology) following the manufacturer’s instructions. DNA-protein complexes were immunoprecipitated using a specific antibody against E2F1. Immunoprecipitated DNA fragments and input DNA fragments were used as templates for ChIP-PCR analysis using KOD-Plus polymerase PCR mix (TOYOBO, CO., Japan). Positive binding sites identified in the ChIP-PCR analysis were verified using ChIP-qPCR analysis. The primers used in the ChIP-PCR or ChIP-qPCR analysis are listed in Table S1C.
Luciferase reporter assay
MHCC-97H cells were seeded onto 24-well plates and transfected with pCMV-E2F1 or pCMV-blank vectors. The cells were co-transfected with the pGL4.19-IQGAP3 promoter, binding site mutants (shown in Figure 2F) and the pRL-TK vector 24 hours before harvest. Cells were lysed using 1 × passive lysis buffer (Promega, Madison, WI, USA) at room temperature for 15 minutes. Luciferase activity was then analyzed using the Dual Luciferase Reporter Assay System Kit (Promega) according to the manufacturer’s instructions. Total light production (OD 490 nm) was measured with the SpectraMax M3 multimode microplate reader (Molecular Devices, Sunnyvale, CA, USA) and normalized using renilla light production.
Figure 2.
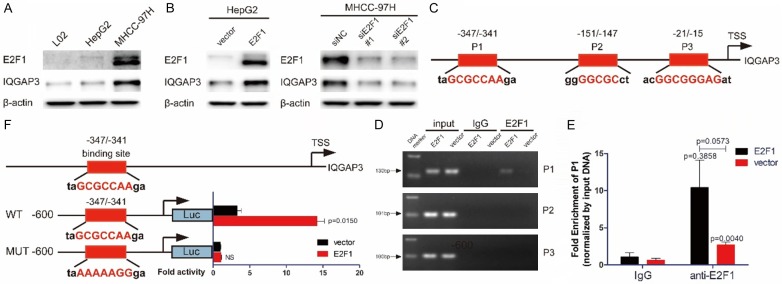
E2F1 transactivates IQGAP3 in HCC cells. (A) Total proteins were extracted from L02, HepG2 and MHCC-97H cells. The level of E2F1 and IQGAP3 was determined by immunoblot. (B) HepG2 cells were transfected with 2 μg pCMV-E2F1 or pCMV vectors. MHCC-97H cells were transfected with E2F1-specific siRNAs or control siRNAs. Samples were harvested 48 hours after transfection. The level of E2F1 and IQGAP3 was determined by immunoblot. (C) Schematic representation of the promoter region of human IQGAP3. The predicted E2F1 binding sites are indicated. (D) Products of ChIP-PCR in the input, IgG and ChIP groups were analyzed using agarose gel electrophoresis. It was demonstrated that E2F1 interacted with the promoter of IQGAP3 at P1. (E) Quantitative PCR analysis of samples in the input, IgG and ChIP groups using P1-specific primers. (F) Luciferase activity was measured after MHCC-97H cells were transfected with pGP4.19-IQGAP3 promoter/pGP4.19-IQGAP3 promoter P1-mutant, pRL-TK and vector/c-Myc. Data in (D and E) are mean ± SEM. Two-tailed Student’s t test was used for statistical calculation.
Co-immunoprecipitation
After reaching approximately 70% confluence in 10 cm dishes, MHCC-97H cells were lysed in 500 μl of RIPA lysis buffer. The samples were centrifuged to remove insoluble debris after cell lysing, and the supernatant was split into two equal aliquots (20 μl lysate remained as input). Anti-IQGAP3 antibodies and anti-rabbit IgG antibodies were added. Immunoprecipitation was performed using PierceTM Protein A/G Magnetic Beads (Thermo Fisher) according to the manufacturer’s instructions.
MTS proliferation assay
HepG2 and MHCC-97H cells were seeded onto 96-well plates and transfected with the siRNAs or vectors as described in Figure 5A. After transfection, cells were cultured with 100 μl complete medium for 24, 48 and 72 hours. Next, 100 μl of MTS solution (Promega Biosciences, San Luis Obispo, CA, USA) mixed with DMEM complete medium (1:9 ratio) was added to each well and incubated for 4 hours at 37°C. Results were quantified using the SpectraMax M3 multimode microplate reader (Molecular Devices) at an absorbance of 490 nm.
Figure 5.
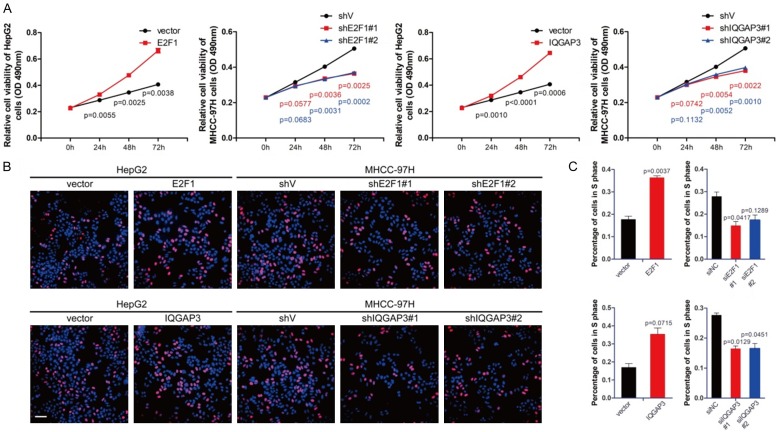
Upregulation of IQGAP3 promotes cell proliferation in vitro. (A) HepG2 cells were transfected with 0.5 μg pCMV-E2F1, pCMV-IQGAP3 or pCMV vectors. MHCC-97H cells were transfected with E2F1, IQGAP3-specific siRNAs, or control siRNAs. Cell viability was measured using MTS assay 0, 24, 48 and 72 hours after transfection. (B) Cells were treated with vectors and siRNAs as described in (A). Representative immunofluorescence images from a BrdU study of HepG2 and MHCC-97H cells. Total DNA (blue) and DNA under replication (red) are shown (scale bar: 50 μm). (C) Percentage of cells with DNA under replication in (B) was measured using image-J. Data in (A and C) are mean ± SEM. Two-tailed Student’s t test was used for statistical calculation.
BrdU and immunofluorescence analysis
HepG2 and MHCC-97H cells were seeded onto 24-well plates containing circular cover glass and transfected with the siRNAs or vectors as described in Figure 5B. After transfection, cells were cultured with 700 μl complete medium for an extra 48 hours. Cells were treated with complete medium containing BrdU at a final concentration of 0.03 mg/mL and incubated for 20 minutes in 5% CO2 at 37°C. BrdU-specific immunofluorescence analysis was performed according to the manufacturer’s instructions using the BrdU Mouse mAb #5292 (Cell Signaling Technology). Fluorescence was examined using a FV3000 confocal microscope (Olympus Corporation, Japan), and BrdU-positive cells were analyzed using Image-J.
Xenograft model and immunohistochemical analysis
After reaching approximately 95% confluence in 15 cm dishes, stably transfected HepG2 and MHCC-97H cells were collected and suspended in 50% Matrigel-1 × PBS solution (Matrigel, Becton Dickinson, Bedford, MA). Male BALB/c nude mice (4 weeks old) were purchased from Slac Laboratories (Shanghai, China). All the animals received care in compliance with guidelines according to the Guide for the Care and Use of Laboratory Animals. The procedures were approved by the Zhejiang University Laboratory Animal Center. Xenograft tumor models were generated by subcutaneously injecting 100 μl of stably transfected HepG2 cells (4 × 10⁶ cell/mouse) or MHCC-97H cells (2 × 10⁶ cells/mouse) into the left fat pads of nude mice. The tumors were examined every 2 days, the length and width measurements were obtained with calipers, and the tumor volumes were calculated. On day 21, the animals were euthanized and the tumors were excised and weighed.
Statistical analysis
A database was created and transferred to SPSS 22.0 and GraphPad Prism 5.0 for Windows. Statistical data analysis was performed using the two-tailed Student’s t-test, chi-squared, and ANOVA. Kaplan-Meier plots and log-rank tests were used for survival analysis. The Spearman test was used in analyzing the correlation. The results are presented as the mean ± S.E of three separate experiments. A P value <0.05 was considered statistically significant.
Results
E2F1 is positively correlated with IQGAP3 in pathological tissues derived from HCC patients
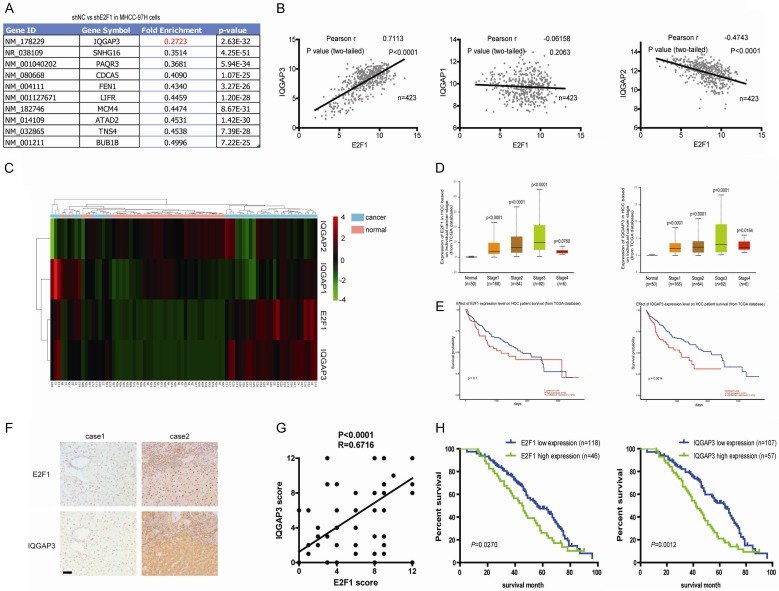
E2F1, as a multi-functional transcription factor, has been reportedly involved in the regulation of the cell cycle and apoptosis through modulation of the cyclin-dependent kinases (CDKs) and p53 signaling pathways [18,19]. However, it is thought that E2F1 may also directly modulate cell-proliferation-related factors and promote cell proliferation. Herein, to investigate this thesis in HCC, gene expression of MHCC-97HsiNC and MHCC-97HsiE2F1 cells was measured using transcriptome analysis. Notably, IQGAP3 was identified as the foremost significantly downregulated gene in MHCC-97HsiE2F1 cells, compared with MHCC-97HsiNC cells (Figure 1A). To further verify the results, the correlation between E2F1 and IQGAP3 was analyzed using the Cancer Genome Atlas (TCGA) database, which indicated that E2F1 was positively correlated with IQGAP3 with high correlation (N = 423, R = 0.7113). However, the IQGAP3 homogeneous proteins, IQGAP1 and IQGAP2, were not positively correlated with E2F1, demonstrating that only IQGAP3 was highly correlated with E2F1 in HCC cells (Figure 1B). Expression of E2F1 and IQGAP3 was analyzed in pathological tissues and adjacent liver tissues derived from HCC patients (n = 50). Results showed that both factors were highly expressed in pathological tissues (Figure 1C). Therefore, it was deemed that both E2F1 and IQGAP3 facilitate tumor progression in HCC patients. Expression of E2F1 and IQGAP3 at individual cancer stages and the effect on the probability of survival in HCC patients were analyzed to further prove the hypothesis. Results showed that expression of E2F1 and IQGAP3 increased with tumor progression, and highly expressed E2F1 or IQGAP3 reduced the survival probability of HCC patients (Figure 1D and 1E). To further confirm the thesis, specimens of pathological tissues derived from HCC patients were collected (N = 164). Immunohistochemical analysis revealed that E2F1 and IQGAP3 were highly expressed in pathological tissues derived from HCC patients and they were positively correlated with each other (R = 0.6716, Figure 1F and 1G). Clinical relevance analysis showed that the expression of E2F1 and IQGAP3 was positively associated with intrahepatic metastasis and distant metastasis (Table 1). The potential association between immunostaining and overall survival (OS) was retrospectively evaluated in these patients. Kaplan-Meier analysis showed that OS was worse in patients with high E2F1 or IQGAP3 staining than in those with low staining (Figure 1H). The above results indicated that E2F1 is positively correlated with IQGAP3 in pathological tissues derived from HCC patients, and that this is involved in HCC development.
Figure 1.
E2F1 is positively correlated with IQGAP3 in pathological tissues derived from HCC patients. (A) The lead gene, IQGAP3, was significantly reduced in MHCC-97HsiE2F1 compared with MHCC-97HsiNC. (B) The correlation between E2F1 and IQGAPs in HCC pathological tissues (based on the TCGA database, N = 423) is represented using linear correlativity. (C) E2F1 and IQGAPs differentially expressed in pathological HCC tissues vs adjacent liver tissues (N = 50). Red color represents increased expression and green indicates reduced expression. (D) Expression of E2F1 and IQGAP3 in HCC based on individual cancer stage (based on TCGA database, N = 390). (E) Overall survival of probability of HCC patients with high/low E2F1 (high: n = 92; low: n = 273) and IQGAP3 (high: n = 91; low: n = 274) expression (based on TCGA database). (F) Immunohistochemical analysis of E2F1 and IQGAP3 in pathological HCC (scale bar: 200 μm). (G) The correlation among concurrent immunostaining scores of E2F1 and IQGAP3 in HCC tissues. (H) The overall survival of HCC patients with low and high expression of E2F1 or IQGAP3 is shown. Data in (D) are mean ± SEM. Two-tailed Student’s t test was used for statistical calculation.
Table 1.
Correlation of the expression of E2F1 and IQGAP3 with clinicopathological features in HCC
| Cases | E2F1 expression | IQGAP3 expression | |||||
|---|---|---|---|---|---|---|---|
|
| |||||||
| Low cases | High cases | P Value | Low cases | High cases | P Value | ||
| 164 | 107 | 57 | 118 | 46 | |||
| Gender | 0.6856 | 0.7207 | |||||
| Male | 123 | 78 | 45 | 86 | 37 | ||
| Female | 41 | 29 | 12 | 32 | 9 | ||
| Age | 0.5327 | 0.1644 | |||||
| <60 | 93 | 61 | 32 | 65 | 28 | ||
| ≥60 | 71 | 46 | 25 | 53 | 18 | ||
| Tumor size | 0.3544 | 0.0327* | |||||
| <5 cm | 65 | 45 | 20 | 51 | 14 | ||
| ≥5 cm | 99 | 62 | 37 | 67 | 32 | ||
| AFP | 0.9651 | 0.4262 | |||||
| ≤20 U/L | 56 | 36 | 20 | 37 | 19 | ||
| >20 U/L | 108 | 71 | 37 | 81 | 27 | ||
| HBsAg | 0.1364 | 0.0245* | |||||
| Positive | 147 | 99 | 48 | 110 | 37 | ||
| Negative | 17 | 8 | 9 | 8 | 9 | ||
| Liver cirrhosis | 0.1339 | 0.2842 | |||||
| Yes | 121 | 84 | 37 | 92 | 29 | ||
| No | 43 | 23 | 20 | 26 | 17 | ||
| TNM | 0.2958 | 0.2252 | |||||
| I/II | 69 | 48 | 21 | 52 | 17 | ||
| III/IV | 95 | 59 | 36 | 66 | 29 | ||
| Edmondson stage | 0.0522 | 0.3273 | |||||
| I/II | 86 | 63 | 23 | 67 | 19 | ||
| III/IV | 78 | 44 | 34 | 51 | 27 | ||
| Intrahepatic metastasis | 0.0428* | 0.0306* | |||||
| Yes | 51 | 31 | 20 | 35 | 16 | ||
| No | 113 | 76 | 37 | 83 | 30 | ||
| Distant metastasis | 0.0065* | 0.0014* | |||||
| Yes | 39 | 18 | 21 | 20 | 19 | ||
| No | 125 | 89 | 36 | 98 | 27 | ||
AFP: alpha-fetoprotein;
P<0.05.
Upregulation of E2F1 promotes transactivation of IQGAP3
It has been shown that knockdown of E2F1 downregulated gene expression of IQGAP3, and it is thought that E2F1 may positively modulate IQGAP3 expression. Expression of E2F1 and IQGAP3 was measured using immunoblotting in L02, HepG2 and MHCC-97H cells, which demonstrated that E2F1 correlated positively with IQGAP3 in liver and liver cancer cells (Figure 2A). Immunoblotting analysis indicated that expression of IQGAP3 increased in E2F1 overexpressing HepG2 cells and was reduced in MHCC-97H cells transfected with E2F1 targeted siRNAs, proving the hypothesis (Figure 2B). We searched IQGAP3 in the Kyoto Encyclopedia of Genes and Genomes (KEGG) and discovered no link to E2F1 in signaling pathways (Figure S1). Therefore, IQGAP3 was hypothesized to be a potential transcriptional product, since E2F1 is known as a transcription factor. Three potential binding sites of the E2F1 and IQGAP3 promoters were discovered through the JASPAR database, and E2F1-binding DNA fragments were immunoprecipitated using ChIP analysis (Figure 2C). ChIP-PCR and ChIP-qPCR analysis demonstrated that E2F1 interacted with the IQGAP3 promoter at the -347/-341 site (Figure 2D and 2E).
Additionally, luciferase reporter analysis was performed to determine the transcriptional activity. It was demonstrated that the luciferase activity of pGL4.19-containing fragments of the IQGAP3 promoter was transactivated when MHCC-97H cells were transfected with pCMV-E2F1. However, luciferase was not transactivated when cells were transfected with pGL4.19 containing fragments of the -347/-341 mutant IQGAP3 promoter. These results in-dicated that E2F1 interacted with the IQGAP3 promoter at the -347/-341 site and promoted transactivation of IQGAP3 (Figure 2E).
IQGAP3 interacts with PKCδ and competitively inhibits the interaction between PKCδ and PKCα, resulting in phosphorylation and activation of PKCα and AKT
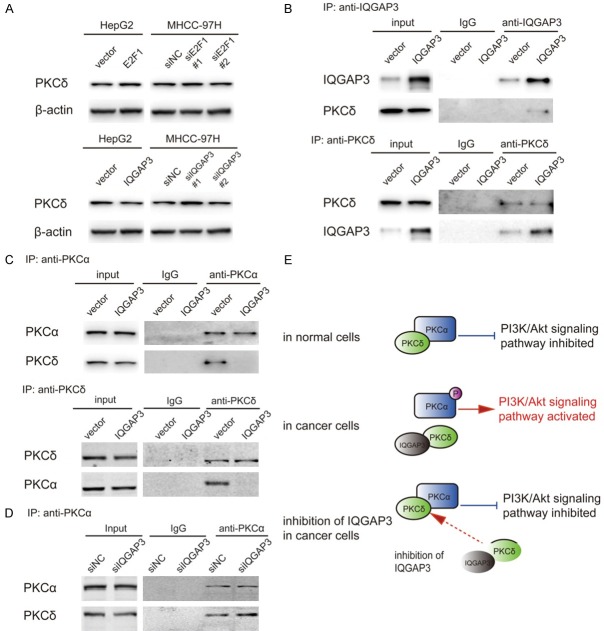
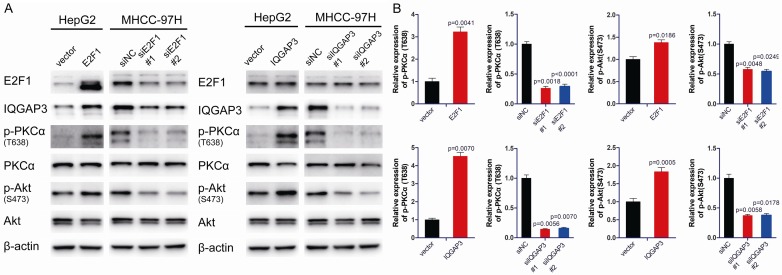
As predicted by the Scansite 4.0 database, IQGAP3 contains multiple PKCδ binding domains. PKCδ is known as a tumor suppressor that interacts with PKCα and inhibits phosphorylation of PKCα, resulting in inhibition of the AKT signaling pathway [20-23]. Initially, we modified the expression of E2F1 and IQGAP3 in HepG2 and MHCC-97H cells. Immunoblotting analysis revealed that modification of E2F1 or IQGAP3 did not impact PKCδ expression, which indicated that IQGAP3 had little impact on the expression of PKCδ, or that PKCδ expression was stable (Figure 3A).
Figure 3.
IQGAP3 interacts with PKCδ and competitively inhibits the interaction between PKCδ and PKCα, resulting in phosphorylation and activation of PKCα. (A) HepG2 cells were transfected with 2 μg pCMV-E2F1, pCMV-IQGAP3 or pCMV vectors. MHCC-97H cells were transfected with E2F1, IQGAP3-specific siRNAs or control siRNAs. Samples were harvested 48 hours after transfection. The level of PKCδ was determined by immunoblot. (B) Co-immunoprecipitation and immunoblot analysis of IQGAP3 and PKCδ in MHCC-97H cells transfected for 48 hours with pCMV-IQGAP3 or pCMV vectors. The proteins were immunoprecipitated using Protein A/G beads conjugated with anti-IQGAP3 or anti-PKCδ antibodies. (C) Co-immunoprecipitation and immunoblot analysis of PKCα and PKCδ in MHCC-97H cells transfected for 48 hours with pCMV-IQGAP3 or pCMV vectors. The proteins were immunoprecipitated using Protein A/G beads conjugated with anti-PKCα or anti-PKCδ antibodies. (D) Co-immunoprecipitation and immunoblot analysis of PKCα and PKCδ in MHCC-97H cells transfected for 48 hours with IQGAP3-siRNA or control-siRNA. The proteins were immunoprecipitated using Protein A/G beads conjugated with anti-PKCα antibody. (E) Schematic representation of IQGAP3- and PKCα-PKCδ interaction. IQGAP3 interacted with PKCδ and competitively inhibited the interaction between PKCδ and PKCα, resulting in PKCα activation in HCC cells. Inhibition of IQGAP3 promoted PKCα-PKCδ interaction and activated PKCα. Data in (D) are mean ± SEM. Two-tailed Student’s t test was used for statistical calculation.
To explore the possibility of IQGAP3-PKCδ interaction, MHCC-97H cells were transfected with pCMV-IQGAP3. Cell lysate was prepared and immunoprecipitated with anti-IQGAP3 or anti-PKCδ antibodies. The resulting precipitate was reciprocally analyzed with anti-IQGAP3 or anti-PKCδ antibodies. It was of interest that immunoprecipitation of IQGAP3 was observed with PKCδ, indicating that IQGAP3 interacted with PKCδ. On the contrary, immunoprecipitation of PKCδ was observed with IQGAP3 and, significantly, overexpression of IQGAP3 had not impacted expression of PKCδ but enhanced its interaction with PKCδ (Figure 3B).
Since PKCδ is known as a PKCα binding factor, a similar interaction between PKCδ and PKCα was revealed as described above. Strikingly, it was observed that overexpression of IQGAP3 reduced the interaction of PKCδ and PKCα (Figure 3C), while knockdown of IQGAP3 enhanced the interaction (Figure 3D). The above results indicated that IQGAP3 interacted with PKCδ and competitively inhibited the interaction between PKCδ and PKCα, which was hypothesized to activate phosphorylation of PKCα in HCC cells (Figure 3E).
To further prove this hypothesis, the expression of E2F1 and IQGAP3 was modified in HepG2 and MHCC-97H cells, and phosphorylation of PKCα was measured. Immunoblotting analysis demonstrated that overexpression of E2F1 or IQGAP3 activated phosphorylation of PKCα at T638 and that p-AKT (S473) was activated. Knockdown of E2F1 or IQGAP3 suppressed PKCα phosphorylation and inhibited the AKT signaling pathway (Figure 4A and 4B). The results proved that IQGAP3 positively regulated the phosphorylation of PKCα at T638 and activated the AKT signaling pathway. The above results indicate that IQGAP3 interacts with PKCδ and competitively inhibits the interaction between PKCδ and PKCα, resulting in phosphorylation of PKCα and activation of the AKT signaling pathway in HCC cells.
Figure 4.
Upregulation of IQGAP3 facilitates phosphorylation of PKCα and activates the AKT signaling pathway. (A) HepG2 cells were transfected with 2 μg pCMV-E2F1, pCMV-IQGAP3 or pCMV vectors. MHCC-97H cells were transfected with E2F1, IQGAP3-specific siRNAs or control siRNAs. Samples were harvested 48 hours after transfection. The levels of E2F1, IQGAP3 and factors in the AKT pathway were determined by immunoblot. (B) Relative expression levels of the proteins indicated in (A). Data are mean ± SEM. Two-tailed Student’s t test was used for statistical calculation.
Upregulation of IQGAP3 promotes cell proliferation in vitro and in vivo
Since it has been proved that overexpression of IQGAP3 activates the AKT signaling pathway in HCC cells, it is thought that highly expressed IQGAP3 might promote HCC proliferation. Therefore, the expression of E2F1 and IQGAP3 in HepG2 and MHCC-97H cells was modified using overexpression constructs or siRNAs for 24, 48 and 72 hours. MTS proliferation assay was utilized to measure cell proliferation. Results showed that overexpression of E2F1 or IQGAP3 facilitated cell proliferation in HepG2 cells, and knockdown of E2F1 or IQGAP3 inhibited cell proliferation in MHCC-97H cells, indicating that highly expressed IQGAP3 promoted the proliferation of HCC cells (Figure 5A). To further investigate whether IQGAP3 facilitates HCC progression, BrdU and immunofluorescence analyses were performed after the cells were transfected. Results showed that expression of E2F1 or IQGAP3 positively regulated DNA synthesis and mitosis, which was similar to the results shown in Figure 5A-C.
To further explore the function of IAGAP3 in vivo, HepG2 cells stably overexpressing IQGAP3 and MHCC-97H cells with IQGAP3 stably knocked down were constructed and utilized. HepG2vector, HepG2IQGAP3, MHCC-97HshV and MHCC-97HshIQGAP3 cells were injected subcutaneously into nude mice to generate xenografts model. It was demonstrated that IQGAP3 positively regulated tumor proliferation in vivo (Figure 6A and 6B). Additionally, immunohistochemical analysis confirmed that expression of IQGAP3 in each group did not change during of tumor growth (Figure 6C).
Figure 6.
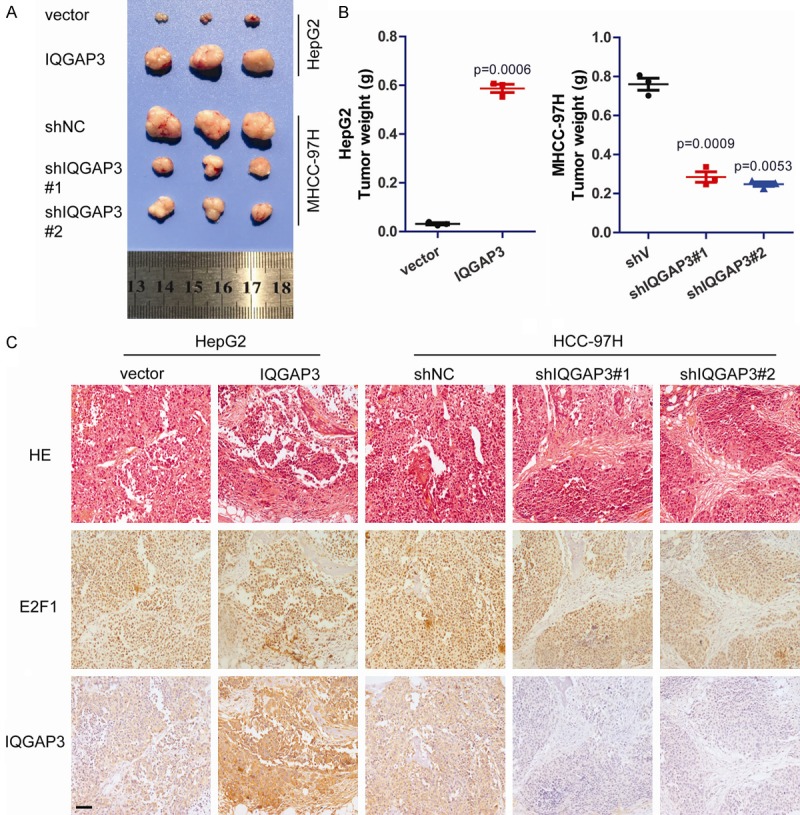
Upregulation of IQGAP3 promotes cell proliferation in vivo. (A) HepG2vector, HepG2IQGAP3, MHCC-97HshV and MHCC-97HshIQGAP3 cells were injected subcutaneously into nude mice to generate xenograft models. Three weeks after injection, the animals were sacrificed and xenografts were obtained. (B) Tumor weights of xenografts. (C) Immunohistochemical analysis of E2F1 and IQGAP3 in xenografts (scale bar: 200 μm). Data in (B) are mean ± SEM. Two-tailed Student’s t test was used for statistical calculation.
The above data indicate that E2F1 transactivated IQGAP3 and promoted the proliferation of hepatocellular carcinoma cells in vitro and in vivo through IQGAP3-mediated PKC-alpha activation, showing that IQGAP3 may serve as a potential target against HCC proliferation (Figure 7).
Figure 7.
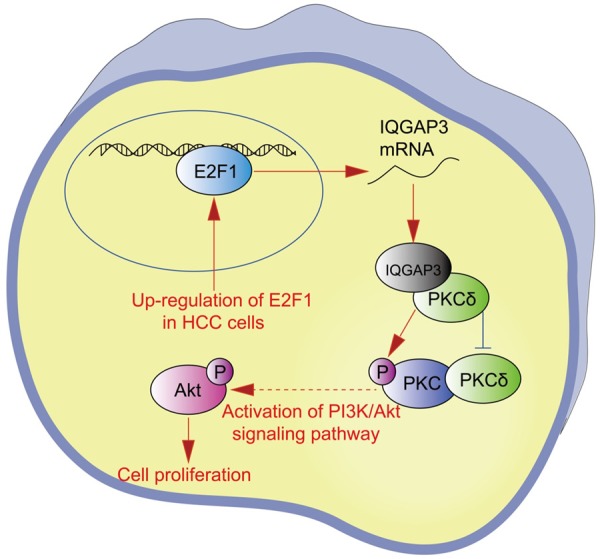
Overview of IQGAP3-mediated signaling pathways in HCC cells. E2F1 transactivates IQGAP3, and IQGAP3 competitively inhibits the interaction between PKCδ and PKCα, resulting in phosphorylation and activation of PKCα and promotion of cell proliferation in HCC cells.
Discussion
HCC is the most common type of liver cancer and the most common cause of death in individuals with cirrhosis [24]. HCC is most closely linked to HBV/HCV infection or exposure to alcohol [3,25,26]. Oxygen supply is sufficient due to plentiful vessels in liver and HCC tissues, which provides a proper microenvironment for tumor proliferation [27]. Therefore, it is critical to identify strategies to inhibit HCC proliferation. E2F1 is known as a vital transcription factor that modulates cell cycle and cell proliferation, is often upregulated in HCC cells and promotes cell proliferation. Most studies have indicated that the CDK4-pRB-E2F1 axis facilitates cell proliferation [28]. However, as a transcription factor, it is thought that E2F1 might promote cell proliferation through its transcriptional products. To investigate the potential transcriptional products of endogenous E2F1, gene expression was measured after MHCC-97H cells were transfected with E2F1-specific siRNAs. Strikingly, IQGAP3, a protein highly expressed in cancer cells, was sharply downregulated after E2F1 silencing. Since it has been reported that highly expressed IQGAP3 facilitated cell proliferation in cancer cells, it is thought that E2F1 might facilitate cell proliferation through IQGAP3 activation [29]. We have discovered that IQGAP3 competitively interacted with the PKCα binding protein PKCδ and promoted the dissociation of PKCδ and PKCα. The dissociation of PKCδ and PKCα promoted phosphorylation of PKCα at T638 and facilitated the activation of the PI3K/AKT signaling pathways, resulting in the promotion of cell proliferation in HCC cells.
It is known that PKCα is highly phosphorylated in cancer cells, and PKCδ is a PKCα binding regulator that inhibits the phosphorylation of PKCα and suppresses the activation of the PI3K/AKT signaling pathways [20,21]. PKCδ is stably expressed in normal and cancer cells; however, few studies have focused on the regulation of PKCα-PKCδ interaction. In this study, results indicated that IQGAP3, as a PKCδ binding factor, competitively bound to PKCδ in HCC cells, reducing PKCα-PKCδ interaction and promoting PKCα phosphorylation. Therefore, IQGAP3 has been identified as a regulator that modulates the activity of PKCα, supplying a new approach to the activation of PKCα phosphorylation.
It has been discovered that IQGAP3, as a GTPase binding factor, binds to the small GTPases Rac1 and cdc42 through GAP-related domains and regulates small GTPases by stabilizing their GTP-bound forms. Theoretically, IQGAP3 might function in the regulation of cell proliferation and cell metabolism, but the mechanism remains poorly understood. Additionally, this study has also shown that E2F1 positively correlates with IQGAP3 in pathological tissues derived from HCC patients. Because these factors are cell proliferation related and closely related to each other, it is hypothesized that they may serve as potential indicators in HCC staging.
In summary, this study indicates that E2F1 transactivates IQGAP3, and IQGAP3 competitively inhibits the interaction between PKCδ and PKCα, resulting in phosphorylation and activation of PKCα and promotion of cell proliferation in HCC cells. This work has explained the mechanism of regulation of PKCα activity, and IQGAP3 has been deemed a potential target in HCC therapeutics.
Acknowledgements
This work was mainly supported by Zhejiang Medical and Health Science and Technology Plan (2018ZD055) and Taizhou Science and Technology Plan (1702KY77). It was also supported by the Project from Department of Science and Technology of Zhejiang Province (2015c33262, 2013C14011), Zhejiang Medical and Health Science and Technology Plan (2018KY920, 2019RC317), Zhejiang Medical Association Clinical Research Fund (2018ZYC-A158) and Science and Technology Program of Sanmen County Public Technology Social Development Project (16312).
Disclosure of conflict of interest
None.
Supporting Information
References
- 1.Siegel RL, Miller KD, Jemal A. Cancer statistics, 2018. CA Cancer J Clin. 2018;68:7–30. doi: 10.3322/caac.21442. [DOI] [PubMed] [Google Scholar]
- 2.Chen W, Zheng R, Baade PD, Zhang S, Zeng H, Bray F, Jemal A, Yu XQ, He J. Cancer statistics in China, 2015. CA Cancer J Clin. 2016;66:115–132. doi: 10.3322/caac.21338. [DOI] [PubMed] [Google Scholar]
- 3.Chan SL, Wong VW, Qin S, Chan HL. Infection and cancer: the case of hepatitis B. J. Clin. Oncol. 2016;34:83–90. doi: 10.1200/JCO.2015.61.5724. [DOI] [PubMed] [Google Scholar]
- 4.Nguyen DX, Bos PD, Massague J. Metastasis: from dissemination to organ-specific colonization. Nat Rev Cancer. 2009;9:274–284. doi: 10.1038/nrc2622. [DOI] [PubMed] [Google Scholar]
- 5.Zhu AX, Duda DG, Sahani DV, Jain RK. HCC and angiogenesis: possible targets and future directions. Nat Rev Clin Oncol. 2011;8:292–301. doi: 10.1038/nrclinonc.2011.30. [DOI] [PMC free article] [PubMed] [Google Scholar]
- 6.Greten TF, Wang XW, Korangy F. Current concepts of immune based treatments for patients with HCC: from basic science to novel treatment approaches. Gut. 2015;64:842–848. doi: 10.1136/gutjnl-2014-307990. [DOI] [PMC free article] [PubMed] [Google Scholar]
- 7.Forner A, Gilabert M, Bruix J, Raoul JL. Treatment of intermediate-stage hepatocellular carcinoma. Nat Rev Clin Oncol. 2014;11:525–535. doi: 10.1038/nrclinonc.2014.122. [DOI] [PubMed] [Google Scholar]
- 8.La Thangue NB. The yin and yang of E2F-1: balancing life and death. Nat Cell Biol. 2003;5:587–589. doi: 10.1038/ncb0703-587. [DOI] [PubMed] [Google Scholar]
- 9.Flowers S, Xu F, Moran E. Cooperative activation of tissue-specific genes by pRB and E2F1. Cancer Res. 2013;73:2150–2158. doi: 10.1158/0008-5472.CAN-12-1745. [DOI] [PMC free article] [PubMed] [Google Scholar]
- 10.Annicotte JS, Blanchet E, Chavey C, Iankova I, Costes S, Assou S, Teyssier J, Dalle S, Sardet C, Fajas L. The CDK4-pRB-E2F1 pathway controls insulin secretion. Nat Cell Biol. 2009;11:1017–1023. doi: 10.1038/ncb1915. [DOI] [PMC free article] [PubMed] [Google Scholar]
- 11.Polager S, Ginsberg D. p53 and E2f: partners in life and death. Nat Rev Cancer. 2009;9:738–748. doi: 10.1038/nrc2718. [DOI] [PubMed] [Google Scholar]
- 12.Kim WT, Kim YH, Jeong P, Seo SP, Kang HW, Kim YJ, Yun SJ, Lee SC, Moon SK, Choi YH, Lee GT, Kim IY, Kim WJ. Urinary cell-free nucleic acid IQGAP3: a new non-invasive diagnostic marker for bladder cancer. Oncotarget. 2018;9:14354–14365. doi: 10.18632/oncotarget.24436. [DOI] [PMC free article] [PubMed] [Google Scholar]
- 13.Qian EN, Han SY, Ding SZ, Lv X. Expression and diagnostic value of CCT3 and IQGAP3 in hepatocellular carcinoma. Cancer Cell Int. 2016;16:55. doi: 10.1186/s12935-016-0332-3. [DOI] [PMC free article] [PubMed] [Google Scholar]
- 14.Xu W, Xu B, Yao Y, Yu X, Cao H, Zhang J, Liu J, Sheng H. Overexpression and biological function of IQGAP3 in human pancreatic cancer. Am J Transl Res. 2016;8:5421–5432. [PMC free article] [PubMed] [Google Scholar]
- 15.Nojima H, Adachi M, Matsui T, Okawa K, Tsukita S, Tsukita S. IQGAP3 regulates cell proliferation through the Ras/ERK signalling cascade. Nat Cell Biol. 2008;10:971–978. doi: 10.1038/ncb1757. [DOI] [PubMed] [Google Scholar]
- 16.Yang Y, Zhao W, Xu QW, Wang XS, Zhang Y, Zhang J. IQGAP3 promotes EGFR-ERK signaling and the growth and metastasis of lung cancer cells. PLoS One. 2014;9:e97578. doi: 10.1371/journal.pone.0097578. [DOI] [PMC free article] [PubMed] [Google Scholar]
- 17.Gu H, Fang Z, Cai X, Song R, Lin M, Ye J, Ding X, Ke Q, Chen H, Gong C, Ye M. Highly expressed histone deacetylase 5 promotes the growth of hepatocellular carcinoma cells by inhibiting the TAp63-maspin pathway. Am J Cancer Res. 2018;8:462–475. [PMC free article] [PubMed] [Google Scholar]
- 18.Jung JK, Arora P, Pagano JS, Jang KL. Expression of DNA methyltransferase 1 is activated by hepatitis B virus X protein via a regulatory circuit involving the p16INK4a-cyclin D1-CDK 4/6-pRb-E2F1 pathway. Cancer Res. 2007;67:5771–5778. doi: 10.1158/0008-5472.CAN-07-0529. [DOI] [PubMed] [Google Scholar]
- 19.Aubrecht TG, Faden AI, Sabirzhanov B, Glaser EP, Roelofs BA, Polster BM, Makarevich O, Stoica BA. Comparing effects of CDK inhibition and E2F1/2 ablation on neuronal cell death pathways in vitro and after traumatic brain injury. Cell Death Dis. 2018;9:1121. doi: 10.1038/s41419-018-1156-y. [DOI] [PMC free article] [PubMed] [Google Scholar]
- 20.Lee JM, Kim IS, Kim H, Lee JS, Kim K, Yim HY, Jeong J, Kim JH, Kim JY, Lee H, Seo SB, Kim H, Rosenfeld MG, Kim KI, Baek SH. RORalpha attenuates Wnt/beta-catenin signaling by PKCalpha-dependent phosphorylation in colon cancer. Mol Cell. 2010;37:183–195. doi: 10.1016/j.molcel.2009.12.022. [DOI] [PubMed] [Google Scholar]
- 21.Hsu AH, Lum MA, Shim KS, Frederick PJ, Morrison CD, Chen B, Lele SM, Sheinin YM, Daikoku T, Dey SK, Leone G, Black AR, Black JD. Crosstalk between PKCalpha and PI3K/AKT signaling is tumor suppressive in the endometrium. Cell Rep. 2018;24:655–669. doi: 10.1016/j.celrep.2018.06.067. [DOI] [PMC free article] [PubMed] [Google Scholar]
- 22.Sokolova O, Vieth M, Naumann M. Protein kinase C isozymes regulate matrix metalloproteinase-1 expression and cell invasion in Helicobacter pylori infection. Gut. 2013;62:358–367. doi: 10.1136/gutjnl-2012-302103. [DOI] [PMC free article] [PubMed] [Google Scholar]
- 23.Chen X, Wu Q, Depeille P, Chen P, Thornton S, Kalirai H, Coupland SE, Roose JP, Bastian BC. RasGRP3 mediates MAPK pathway activation in GNAQ mutant uveal melanoma. Cancer Cell. 2017;31:685–696. e686. doi: 10.1016/j.ccell.2017.04.002. [DOI] [PMC free article] [PubMed] [Google Scholar]
- 24.Maluccio M, Covey A. Recent progress in understanding, diagnosing, and treating hepatocellular carcinoma. CA Cancer J Clin. 2012;62:394–399. doi: 10.3322/caac.21161. [DOI] [PubMed] [Google Scholar]
- 25.Arzumanyan A, Reis HM, Feitelson MA. Pathogenic mechanisms in HBV- and HCV-associated hepatocellular carcinoma. Nat Rev Cancer. 2013;13:123–135. doi: 10.1038/nrc3449. [DOI] [PubMed] [Google Scholar]
- 26.Marengo A, Rosso C, Bugianesi E. Liver cancer: connections with obesity, fatty liver, and cirrhosis. Annu Rev Med. 2016;67:103–117. doi: 10.1146/annurev-med-090514-013832. [DOI] [PubMed] [Google Scholar]
- 27.Xiong XX, Qiu XY, Hu DX, Chen XQ. Advances in hypoxia-mediated mechanisms in hepatocellular carcinoma. Mol Pharmacol. 2017;92:246–255. doi: 10.1124/mol.116.107706. [DOI] [PubMed] [Google Scholar]
- 28.Blanchet E, Annicotte JS, Fajas L. Cell cycle regulators in the control of metabolism. Cell Cycle. 2009;8:4029–4031. doi: 10.4161/cc.8.24.10110. [DOI] [PMC free article] [PubMed] [Google Scholar]
- 29.Hu G, Xu Y, Chen W, Wang J, Zhao C, Wang M. RNA interference of IQ motif containing GTPase-activating protein 3 (IQGAP3) inhibits cell proliferation and invasion in breast carcinoma cells. Oncol Res. 2016;24:455–461. doi: 10.3727/096504016X14685034103635. [DOI] [PMC free article] [PubMed] [Google Scholar]
Associated Data
This section collects any data citations, data availability statements, or supplementary materials included in this article.


