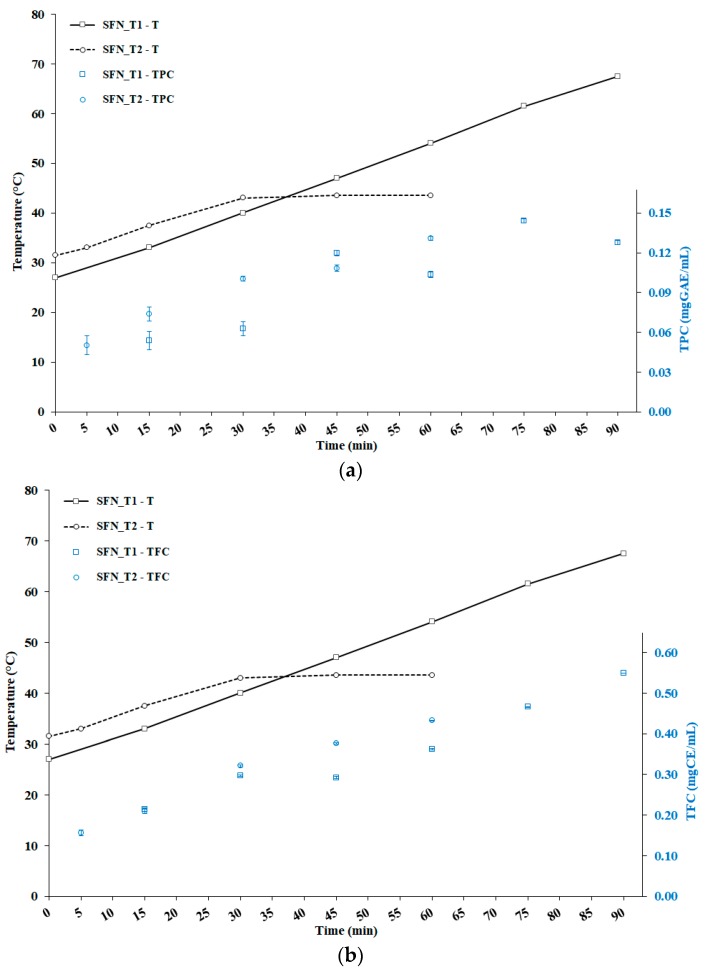
Figure 3.
(a) Joint evolution of temperature (T) and total phenolic content (TPC) for tests SFN_T1 (Silver Fir Needles—Test 1) and SFN_T2 (Silver Fir Needles—Test 2); (b) Joint evolution of temperature (T) and total flavonoids content (TFC) for tests SFN_T1 and SFN_T2. Error bars represent the standard deviations.

