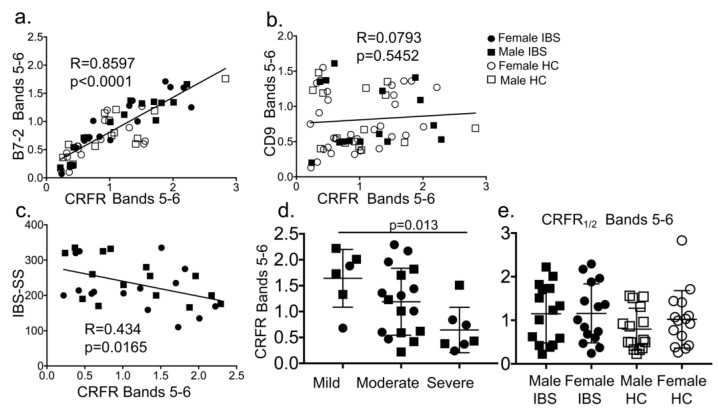
Figure 3.
CRF receptor levels show a strong positive association with B7-2+ EVs and a negative relationship with IBS scores. (a) Linear regression analysis showed a strong positive correlation (R = 0.859, p < 0.0001) between B7-2 and CRFR expression in plasma from IBS-D patients and HC (n = 15/sex/group). (b) No correlation was seen between CD9 and CRFR expression in plasma from IBS-D patients and HC (n = 15/sex/group). (c) A negative correlation between IBS severity score (IBS-SS) and CRFR expression (R = 0434, p = 0.0165) was seen (n = 30 IBS patients). (d) CRFR expression decreased in accordance with disease severity of IBS (mild: 1.64 ± 0.56 vs. severe: 0.64 ± 0.44, p = 0.013). Statistical analysis: Tukey’s multiple comparisons test. (e) CRFR expression was quantified from immunoblot and Two-way ANOVA showed no significant main effect of disease (IBS vs. HC), or sex (n = 15/sex/group).

