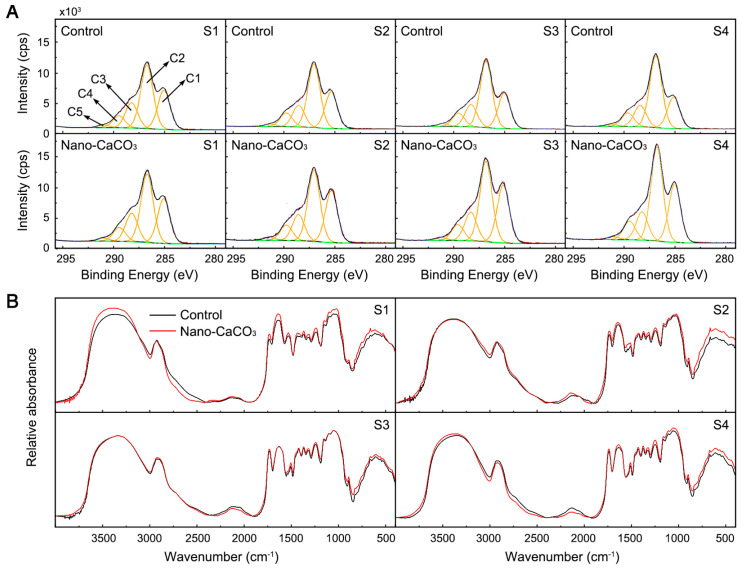
Figure 8.
Effects of nano-CaCO3 treatment on the cell wall compositions of P. lactiflora inflorescence stems. (A) Deconvoluted high-resolution XPS C1s spectrum of cell wall. (B) Absorption FTIR spectra of cell wall in the 4000–400 cm−1 region. S1, flower-bud stage; S2, pigmented stage; S3, unfold-petal stage; and S4, full-flowering stage.

