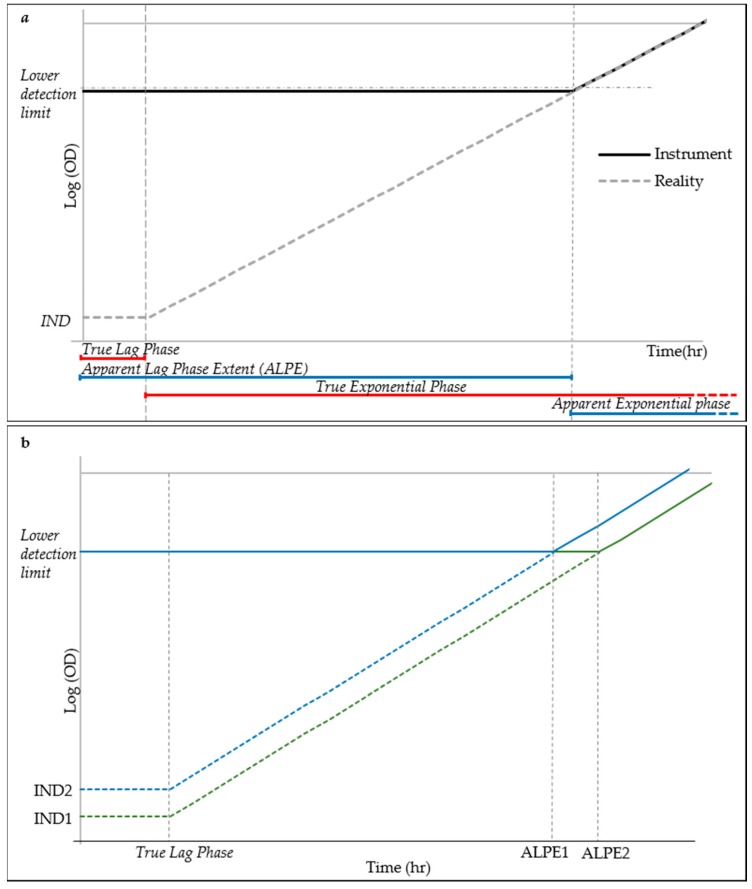
Figure 3.
Simplified model of cell growth for ALPE explanation: (a) schematic explanation of the Apparent Lag Phase Extent (ALPE), where IND indicates initial cell density; and (b) simplified growth curves (in green and blue markers) from two different inocula concentrations corresponding to different ALPE.

