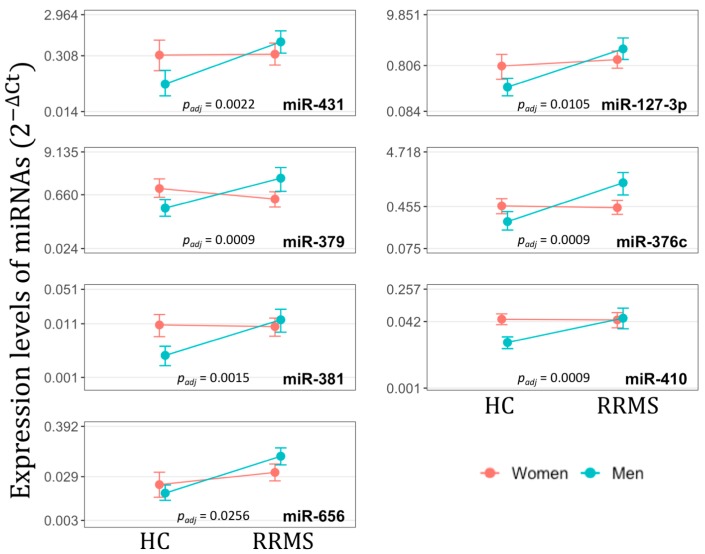
Figure 2.
Interaction plots for expression levels (2−ΔCt) of miR-431, miR-127-3p, miR-379, miR-376c, miR-381, miR-410 and miR-656 according to “health–disease” status and gender of individuals, as determined by RT-qPCR. Mean (2−ΔCt) values were calculated for healthy controls (HC), i.e., healthy men and healthy women, and for relapsing-remitting multiple sclerosis (RRMS) patients, i.e., RRMS men and RRMS women. The intersection of lines on the plot suggests that there is an interaction effect between “health–disease” status and gender, what is confirmed by the significant padj values.

