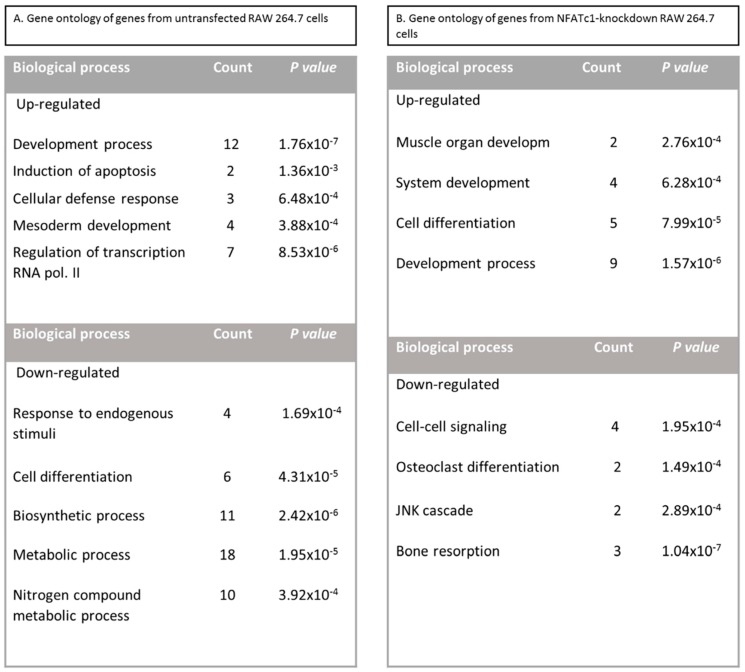
Figure 3.
Gene Ontology analysis as biological function of untransfected and NFATc1-knockdown RAW 264.7 cells. (A) Untransfected cells, RANKL-induced. (B) NFATc1-knockdown cells, RANKL-induced. The count represents the number of genes showing variation in their expression levels involved in the annotated biological process. The p value denotes the significance of Gene Ontology (GO) term enrichment in the differentially expressed mRNAs based on the PANTHER classification system. This analysis allowed us to determine the biological pathways for which a significant enrichment of differentially expressed genes existed (p < 0.05) calculated with Fischer’s exact test with FDR multiple test correction.

