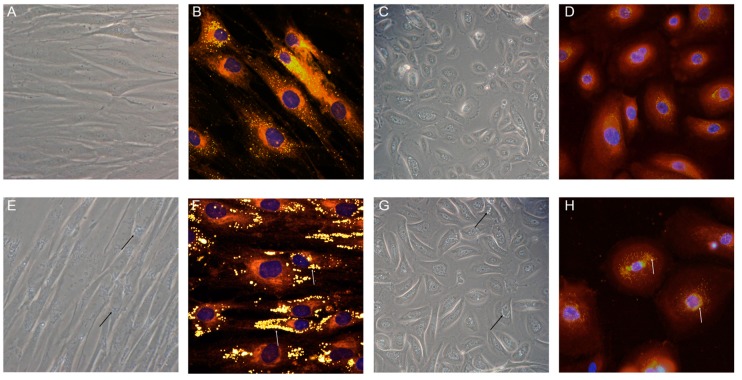
Figure 6.
LD images obtained from NLSDI skin cells. Phase-contrast images of cultured fibroblasts and keratinocytes from control (A,C) and affected subjects (E,G); fluorescent microscopy images with Nile Red and DAPI staining of fibroblasts and keratinocytes from normal (B,D) and NLSDI (F,H) subjects. LDs are indicated by arrows. Phase-contrast images: magnification 20×; fluorescent microscopy images: magnification 40×.

