

Abstract
Objective
Medicare's Hospital Readmissions Reduction Program (HRRP) does not account for social risk factors in risk adjustment, and this may lead the program to unfairly penalize safety‐net hospitals. Our objective was to determine the impact of adjusting for social risk factors on HRRP penalties.
Study Design
Retrospective cohort study.
Data Sources/Study Setting
Claims data for 2 952 605 fee‐for‐service Medicare beneficiaries with acute myocardial infarction (AMI), congestive heart failure (CHF) or pneumonia from December 2012 to November 2015.
Principal Findings
Poverty, disability, housing instability, residence in a disadvantaged neighborhood, and hospital population from a disadvantaged neighborhood were associated with higher readmission rates. Under current program specifications, safety‐net hospitals had higher readmission ratios (AMI, 1.020 vs 0.986 for the most affluent hospitals; pneumonia, 1.031 vs 0.984; and CHF, 1.037 vs 0.977). Adding social factors to risk adjustment cut these differences in half. Over half the safety‐net hospitals saw their penalty decline; 4‐7.5 percent went from having a penalty to having no penalty. These changes translated into a $17 million reduction in penalties to safety‐net hospitals.
Conclusions
Accounting for social risk can have a major financial impact on safety‐net hospitals. Adjustment for these factors could reduce negative unintended consequences of the HRRP.
Keywords: Medicare, readmission
1. INTRODUCTION
Since its implementation in 2012, Medicare's Hospital Readmissions Reduction Program (HRRP) has been the source of significant controversy. One major source of that controversy has been the program's lack of accounting for social risk factors that are beyond hospitals’ control but may influence readmissions, such as poverty, low education, and homelessness, either in its risk‐adjustment models or in program administration. Critics have argued that as a consequence, safety‐net hospitals, which care for a disproportionate share of patients with such risk factors, are being unfairly penalized under the HRRP.1 Proponents of the program have argued that adjustment is only appropriate for medical, not social, risk factors2 and that accounting for social risk should be done in other ways or not at all.
While a large body of evidence has demonstrated that social risk factors such as individual poverty and residence in a highly disadvantaged community are powerfully linked to readmission,3, 4, 5, 6, 7, 8, 9, 10, 11 less is known about how these relationships might impact performance under the HRRP or the magnitude of penalties levied against safety‐net hospitals. In the first year of the HRRP, safety‐net hospitals were more likely to receive maximum penalties than non–safety‐net hospitals,12 but as the program expanded in its first few years, these differences became smaller.13 In the only peer‐reviewed study to date examining the potential impact of adding adjustment for social risk factors to the HRRP, Bernheim et al14 reported that adjusting readmission rates for Medicaid enrollment status and/or area income did not meaningfully change hospital performance, with only 3‐4 percent of low socioeconomic status hospitals moving from penalty to no penalty after adjustment. However, the social risk factors evaluated in that study were limited, and the authors’ treatment of improved performance with the inclusion of those factors was a dichotomous outcome (ie, penalty vs no penalty), while in actual application HRRP penalties are continuous (ie, hospitals can receive anywhere from a 0 to 3 percent penalty).15, 16 In addition, no information was provided on the overall penalty percent or dollar impact of adjustment, which could be substantial if such adjustment impacted performance assessment broadly.
Whether to adjust for social risk factors, and the real‐world impact of doing so, has become even more salient recently, as Congress passed the 21st Century Cures Act requiring Medicare to take social risk into account in the HRRP by 2019.17 In the short term, Medicare plans to stratify penalty assignments by the proportion of poor beneficiaries at each hospital, but the statute allows for different approaches to social risk to be implemented in the future. This debate also has important and broad implications for the rapidly growing list of other value‐based payment programs that include readmission measures, including those for physician groups,18 accountable care organizations,19 dialysis facilities,20 skilled nursing facilities,21 and home health agencies.22
We therefore set out with three key aims. First, to characterize the association between claims‐based social risk factors and readmission rates, using a broader group of such factors than previously analyzed; second, to characterize safety‐net hospitals’ performance on readmissions with and without adjustment for social risk factors; and third, to determine whether accounting for social risk factors changes penalties levied on safety‐net hospitals, both in terms of the proportional and absolute dollar penalty for these institutions.
2. METHODS
2.1. Data
We used Medicare 100 percent Research Identifiable Files (RIF) including inpatient and outpatient claims for beneficiaries ages 65 and older with an index admission for acute myocardial infarction (AMI), congestive heart failure (CHF), or pneumonia between December 1, 2012, and November 30, 2015. Because risk adjustment for the HRRP requires a 1‐year lookback period for comorbidities, claims for these beneficiaries generated between December 1, 2011, and November 30, 2012, were also used where appropriate. CMS Master Beneficiary Summary File data were used to identify dual‐eligibility for Medicaid, original Medicare eligibility for disability status, and monthly enrollment in Medicare Part A.
The CMS Vital Records File was used to geocode beneficiary mailing addresses to a highly granular geographic unit—the census block group‐level (ie, “neighborhood level”)—which allows for precise linkage to area‐based social factor measurements. We merged the geocoded records with 2013 Area Deprivation Index (ADI) data from the University of Wisconsin, School of Medicine and Public Health (www.neighborhoodatlas.medicine.wisc.edu) to obtain an ADI score for each address.10, 11, 23 The ADI measures neighborhood disadvantage across an array of social factors such as education, employment, income, and housing quality, and has been previously demonstrated to be associated with readmission.10, 11 We used the CMS fiscal year 2017 Inpatient Prospective Payment System (IPPS) final rule impact file to obtain information on HRRP penalties.
2.2. Patient cohort
We identified index admissions for AMI, CHF, and pneumonia using principal diagnosis codes used by CMS for the HRRP.24 Diagnosis codes for claims during the final 2 months of our study period were converted from 10th to the 9th revision of International Classification of Diseases, Clinical Modification (ICD‐10 CM to ICD‐9 CM). Admissions were excluded per CMS methodology if the beneficiary was under age 65 or not fully enrolled in Medicare Part A during the 365 days prior to and 30 days following the index admission; if the claim included a final disposition of transferred, self‐discharged against medical advice, or deceased; if the patient was readmitted on the same day as discharge; or if the claim occurred at a non–acute care facility.
2.3. Primary predictors: social risk factors
A conceptual framework for inclusion of social risk factors in Medicare payment policy has been proposed by the National Academies of Sciences, Engineering, and Medicine.25, 26 From this framework, we evaluated several measures of beneficiaries’ community and individual social risk factors as predictors of readmission. The first was residence in a neighborhood belonging to the highest (most disadvantaged) ADI quintile, based on prior work10, 11 and our own confirmatory analyses suggesting that the relationship between neighborhood disadvantage and readmission is concentrated in the highest quintile (Figures S1‐S3). We also included an indicator for beneficiaries with missing ADI as a result of invalid address information, which constituted 10.4 percent of our sample. Dual‐eligibility for Medicaid was used as an indicator of low income. We considered beneficiaries as dually eligible if they had at least 1 month of Medicaid eligibility during the year of the index admission. Original Medicare eligibility prior to age 65 as a result of disability was used as a marker of functional status, which is related to many social risk factors.24 We categorized housing stability into groups reporting one, 2‐3, or 4 or more unique residential ZIP codes on inpatient and outpatient claims between 2012 and 2015, with 4 or more indicating the most unstable housing. Finally, we included an indicator of disadvantage at the hospital level for hospitals’ surrounding communities, using the fifth‐quintile of hospitals’ percentage of patients residing in the most disadvantaged ADI quintile of neighborhoods. We categorized hospitals into safety‐net status using quintiles of dual‐eligible payer mix. We defined first quintile hospitals as most affluent, second through fourth quintile hospitals as mid‐affluence, and fifth‐quintile hospitals as safety‐net providers as has been done previously.14, 17
2.4. Primary outcome: readmission
Unplanned readmissions occurring within 30 days of discharge from an index admission were identified using the criteria defined by CMS for the HRRP.24 As per CMS specifications, we excluded planned readmissions for procedures, transplantation, chemotherapy, and rehabilitation, and multiple readmissions, such that each beneficiary within a cohort was eligible for only one index admission and readmission pair per thirty days.
2.5. Analyses
First, we replicated CMS 30‐day readmission performance assessments for AMI, CHF, and pneumonia with hierarchical generalized logistic models (HGLM) using CMS‐supplied SAS packs. Next, we compared observed readmission rates for each of the social risk factors evaluated. We fit social risk‐only hierarchical models for the AMI, CHF, and pneumonia cohorts using age, gender, and the social risk variables that we evaluated, first entering each into the model on its own, and then running a model with all social risk factors included. We then fit hierarchical models for each cohort using the CMS‐specified clinical covariates in addition to our social risk variables. Following HRRP methodology, we calculated and compared readmission performance, in the form of excess readmission ratios, before and after the inclusion of social risk factors in risk adjustment. We conducted sensitivity analyses in which we used generalized linear models to calculate relative risk ratios as a robustness check, as well as analyses examining the frequency and impact of missing address within our models (Tables S1‐S2).
Finally, we calculated HRRP penalties. We estimated base operating DRG payments for AMI, CHF, and pneumonia as well as total base operating DRG payments for each hospital using 2013‐2015 MedPAR data. We then scaled the cohort‐specific DRG payments by the readmission ratios derived with the CMS baseline and social risk‐augmented models. The results were divided by total base operating DRG payments and subtracted from one to estimate the readmissions adjustment factor for each of the competing models. We imposed a floor of 0.97 for these factors to ensure a maximum possible penalty of 3 percent of total base operating DRG payments, as prescribed by the HRRP.27 To simulate the penalty impact for federal fiscal year 2017, we applied the readmission adjustment factors for each competing model to 2017 base operating IPPS revenue using the CMS final rule impact file of the same year.
All analyses were conducted using SAS version 9.4, SAS Institute, Cary, NC. We considered a two‐tailed P‐value of <0.05 to be statistically significant.
3. RESULTS
3.1. Sample, patient, and hospital characteristics
We identified 2084 hospitals participating in the HRRP for AMI, 2949 for pneumonia, and 2874 for CHF during the study period (Table 1). Across clinical cohorts, patients at safety‐net hospitals were more often female, much more often dually enrolled in Medicaid, and more often originally entitled to Medicare due to disability. They were also less often white and had a higher prevalence of housing instability (4 or more ZIP codes). Patients at safety‐net hospitals more often resided in highly disadvantaged neighborhoods, and safety‐net hospitals much more often cared for large populations residing in highly disadvantaged neighborhoods.
Table 1.
Patient and hospital characteristics
| Patient characteristics | AMI cohort | Pneumonia cohort | CHF cohort | ||||||
|---|---|---|---|---|---|---|---|---|---|
| All | Most affluent | Safety‐net | All | Most affluent | Safety‐net | All | Most affluent | Safety‐net | |
| Number of index admissions (mean) | 516 793 (122.3) | 108 869 (245.8) | 53 528 (120.8) | 1 215 126 (257.7) | 276 796 (322.2) | 158 771 (184.8) | 1 220 686 (262.2) | 286 437 (370.6) | 146 776 (189.9) |
| Number of hospitals participating in HRRP | 2084 | 417 | 417 | 2949 | 590 | 590 | 2874 | 575 | 575 |
| Age 85+ (%) | 26.9% | 26.3% | 30.5% | 37.4% | 40.1% | 36.8% | 38.1% | 42.3% | 34.4% |
| Female | 46.6% | 43.5% | 51.2% | 53.2% | 51.8% | 55.2% | 54.0% | 51.6% | 57.4% |
| Medicaid | 20.9% | 9.4% | 47.1% | 30.3% | 15.1% | 58.4% | 26.5% | 12.8% | 55.6% |
| Originally entitled to Medicare due to disability | 14.7% | 10.8% | 18.1% | 17.0% | 12.1% | 21.3% | 16.8% | 12.5% | 20.7% |
| Race | |||||||||
| White | 86.4% | 91.6% | 69.0% | 87.3% | 91.2% | 72.3% | 82.5% | 90.1% | 61.9% |
| Black | 8.2% | 4.3% | 16.2% | 7.4% | 4.8% | 12.8% | 12.5% | 6.6% | 23.9% |
| Unknown/other | 5.4% | 4.2% | 14.8% | 5.3% | 4.1% | 14.9% | 4.9% | 3.2% | 14.2% |
| Hispanic | 1.7% | 0.8% | 7.0% | 1.9% | 1.0% | 6.8% | 1.8% | 0.9% | 7.4% |
| Housing stability | |||||||||
| 4 or more ZIPs during study period | 0.2% | 0.2% | 0.4% | 0.3% | 0.3% | 0.4% | 0.3% | 0.2% | 0.5% |
| 2‐3 ZIPs during study period | 12.2% | 12.2% | 13.2% | 15.8% | 16.7% | 15.3% | 15.0% | 15.8% | 14.4% |
| One ZIP during study period | 87.6% | 87.7% | 86.4% | 83.8% | 83.0% | 84.2% | 84.6% | 84.0% | 85.2% |
| Proportion of beneficiaries residing in ADI Quintile 5 (highly disadvantaged home neighborhood) | 14.7% | 7.6% | 21.0% | 14.9% | 6.8% | 24.5% | 15.8% | 7.6% | 26.2% |
| Proportion of hospitals in Quintile 5 of beneficiaries residing in most highly disadvantaged neighborhoods | 17.8% | 1.9% | 33.0% | 14.3% | 0.8% | 38.5% | 12.2% | 1.4% | 36.8% |
| Mean number of comorbidities (HCCs) | 9.00 | 8.61 | 9.45 | 10.17 | 9.84 | 10.22 | 9.50 | 9.40 | 9.27 |
Note: Most affluent hospitals are those in the lowest quintile of proportion dually enrolled (Medicare and Medicaid) individuals; safety‐net hospitals are those in the highest quintile. Source: Authors’ calculations using CMS 100% Inpatient and Outpatient Research Identifiable File Claims Data for Medicare Fee‐For‐Service beneficiaries aged 65 and older with an index admission for AMI, pneumonia, or CHF between December 1, 2012, and November 30, 2015. Notes: Dual quintiles assigned to hospitals with 25 or more index admissions. Column percentages are based on the total number of index admissions.
AMI, acute myocardial infarction; CHF, congestive heart failure; HCC, hierarchical condition categories; ZIP, zone improvement plan.
3.2. Relationship between social risk factors and readmission
We found much higher raw readmission rates for individuals with social risk factors: For example, for AMI, dually enrolled patients had a raw readmission rate of 18.9 percent (odds ratio [OR] 1.48, 95% confidence interval [CI] 1.45‐1.51, P < 0.0001), and those with disability 18.1 percent (OR 1.35, 95% CI 1.32‐1.38, P < 0.0001, Table 2). Individuals reporting 2‐3 or 4 or more ZIP codes during the study period, as well as those from highly disadvantaged neighborhoods or discharged from hospitals caring for more patients from highly disadvantaged neighborhoods, also had higher odds of readmission. Patterns were similar for pneumonia and CHF (Table 2) and when we calculated relative risk ratios using generalized linear models (Table S3).
Table 2.
Relationship between social risk factors and readmission
| AMI cohort | Pneumonia cohort | CHF cohort | ||||||||||
|---|---|---|---|---|---|---|---|---|---|---|---|---|
| Observed readmission rate (%) | Odds from model with each social risk factor alone | Odds from model with all social risk factors | Odds from model with social and medical risk factors | Observed readmission rate (%) | Odds from model with each social risk factor alone | Odds from model with all social risk factors | Odds from model with social and medical risk factors | Observed readmission rate (%) | Odds from model with each social risk factor alone | Odds from model with all social risk factors | Odds from model with social and medical risk factors | |
| Overall | 14.7 | ‐ | ‐ | ‐ | 15.2 | ‐ | ‐ | ‐ | 19.6 | ‐ | ‐ | ‐ |
| Medicaid | 18.9 | 1.48** | 1.34** | 1.09** | 17.4 | 1.26** | 1.20** | 1.14** | 22.8 | 1.30** | 1.22** | 1.16** |
| 1.45‐1.51 | 1.31‐1.36 | 1.07‐1.12 | 1.24‐1.27 | 1.19‐1.22 | 1.13‐1.16 | 1.29‐1.31 | 1.21‐1.24 | 1.15‐1.17 | ||||
| Disability | 18.1 | 1.35** | 1.38** | 1.10** | 18.3 | 1.32 | 1.18** | 1.14** | 23.0 | 1.28** | 1.14** | 1.10** |
| 1.32‐1.38 | 1.35‐1.41 | 1.07‐1.12 | 1.30‐1.33 | 1.16‐1.20 | 1.12‐1.16 | 1.27‐1.30 | 1.13‐1.16 | 1.09‐1.11 | ||||
| Housing stability | ||||||||||||
| One ZIP | 14.3 | Ref | Ref | Ref | 15.0 | Ref | Ref | Ref | 19.3 | Ref | Ref | Ref |
| 2‐3 ZIPs | 17.7 | 1.29** | 1.19** | 1.01 | 16.2 | 1.10** | 1.07** | 1.04** | 21.2 | 1.13** | 1.10** | 1.07** |
| 1.26‐1.32 | 1.16‐1.22 | 0.99‐1.04 | 1.08‐1.11 | 1.06‐1.08 | 1.03‐1.06 | 1.11‐1.14 | 1.08‐1.11 | 1.05‐1.08 | ||||
| 4 or more ZIPs | 22.4 | 1.68** | 1.47** | 1.08 | 22.1 | 1.59** | 1.39** | 1.28** | 28.2 | 1.61** | 1.39** | 1.29** |
| 1.47‐1.92 | 1.29‐1.67 | 0.94‐1.24 | 1.48‐1.71 | 1.29‐1.49 | 1.19‐1.38 | 1.51‐1.73 | 1.29‐1.49 | 1.20‐1.38 | ||||
| Patient's neighborhood disadvantage by ADI | ||||||||||||
| Q1‐Q4 | 14.4 | Ref | Ref | Ref | 15.0 | Ref | Ref | Ref | 19.3 | Ref | Ref | Ref |
| Q5 most | 16.3 | 1.15** | 1.06** | 1.02 | 16.4 | 1.11** | 1.04** | 1.02* | 21.1 | 1.12** | 1.03** | 1.02~ |
| 1.13‐1.18 | 1.04‐1.08 | 0.99‐1.04 | 1.10‐1.13 | 1.03‐1.06 | 1.01‐1.04 | 1.11‐1.13 | 1.01‐1.04 | 1.01‐1.04 | ||||
| Hospital population residing in highly disadvantaged neighborhoods by ADI | ||||||||||||
| Q1‐Q4 | 14.5 | Ref | Ref | 15.1 | Ref | Ref | Ref | 19.4 | Ref | Ref | Ref | |
| Q5 most | 15.8 | 1.11** | 1.07** | 1.04* | 15.9 | 1.07** | 1.02* | 1.03* | 21.0 | 1.10** | 1.05** | 1.05** |
| 1.09‐1.13 | 1.04‐1.10 | 1.01‐1.07 | 1.05‐1.08 | 1.00‐1.05 | 1.01‐1.05 | 1.09‐1.12 | 1.03‐1.07 | 1.03‐1.07 | ||||
Source: Authors’ calculations using CMS 100% Inpatient and Outpatient Research Identifiable File Claims Data for Medicare Fee‐For‐Service beneficiaries aged 65 and older with an index admission for AMI, pneumonia, or CHF between December 1, 2012, and November 30, 2015. Notes: The social and medical risk factors column includes the social risk factors plus the standard CMS risk‐adjustment model, which is based on medical comorbidities. Odds ratios represent the odds that readmission will occur in the group with the social risk factor divided by the odds that readmission will occur in the group without the social risk factor.
ADI, area deprivation index; AMI, acute myocardial infarction; CHF, congestive heart failure; ZIP, zone improvement plan.
P < 0.05.
P < 0.0001.
In a model that included all the social risk factors, these relationships were slightly attenuated, though they all retained significance. For example, the odds of readmission for dually enrolled individuals when also considering all other social risk factors was 1.34 (1.31‐1.36, P < 0.0001) for AMI, 1.20 (1.19‐1.22, P < 0.0001) for pneumonia, and 1.22 (1.21‐1.24, P < 0.0001, Table 2) for CHF.
Finally, after fully adjusting for clinical comorbidities per the current CMS risk‐adjustment model, these relationships were further attenuated, though many remained significant. For example, the fully adjusted odds of readmission for dually enrolled individuals was 1.09 (1.07‐1.12, P < 0.0001) for AMI, 1.14 (1.13‐1.16, P < 0.0001) for pneumonia, and 1.16 (1.15‐1.17, P < 0.0001, Table 2) for CHF. The presence of 4 or more ZIP codes and patient residence in a highly disadvantaged neighborhood remained associated with readmission for pneumonia and CHF after clinical risk adjustment, and hospital service of more individuals from highly disadvantaged neighborhoods remained associated with readmission for all three conditions. Full model results are presented in Tables S4‐S6.
3.3. Safety‐net performance with and without social risk adjustment
Under current program specifications, safety‐net hospitals had higher readmission rates for all three conditions even after adjustment for medical comorbidities, resulting in mean readmission ratios that were higher for all three conditions (for AMI, 1.020 vs 0.986 for the most affluent hospitals, difference 0.034; for pneumonia, 1.031 vs 0.984, difference 0.047; and for CHF, 1.037 vs 0.977, difference 0.060, Table 3).
Table 3.
Hospital performance by safety‐net status
| AMI | Pneumonia | CHF | |||||||
|---|---|---|---|---|---|---|---|---|---|
| Most affluent | Mid‐affluence | Safety‐net | Most affluent | Mid‐affluence | Safety‐net | Most affluent | Mid‐affluence | Safety‐net | |
| Hospitals | 417 | 1250 | 417 | 590 | 1769 | 590 | 575 | 1724 | 575 |
| Observed 30‐d readmission rate | 13.3% | 14.7% | 17.4% | 14.3% | 15.5% | 16.6% | 18.4% | 19.8% | 21.9% |
| Mean readmission ratio with only medical risk adjustment | 0.986 | 0.999 | 1.020 | 0.984 | 1.006 | 1.031 | 0.977 | 1.001 | 1.037 |
| Mean readmission ratio after adding social risk adjustment | 0.992 | 0.999 | 1.014 | 0.996 | 1.007 | 1.016 | 0.989 | 1.002 | 1.018 |
| Proportion with higher (worse) ratio after social risk adjustment | 96.2% | 63.7% | 13.0% | 99.3% | 61.2% | 3.6% | 97.0% | 64.4% | 4.9% |
| Proportion with lower (better) ratio after social risk adjustment | 3.8% | 36.3% | 87.1% | 0.68% | 38.8% | 96.4% | 3.0% | 35.6% | 95.1% |
Source: Authors’ calculations using CMS 100% Inpatient and Outpatient Research Identifiable File Claims Data for Medicare Fee‐For‐Service beneficiaries aged 65 and older with an index admission for AMI, pneumonia or CHF between December 1, 2012, and November 30, 2015. Notes: Results include hospitals eligible for penalties under the HRRP (IPPS acute care hospitals with 25 or more index admissions for each condition during the 36‐mo study period). Medical risk adjustment is the standard CMS comorbidity model. Social risk adjustment includes Medicaid dual‐eligibility status, original entitlement for disability status, number of residential ZIP codes, fifth‐quintile of ADI for census block group of patient residence, fifth‐quintile of ADI for hospital population.
AMI, acute myocardial infarction; CHF, congestive heart failure.
After adding social risk adjustment, differences narrowed significantly. Mean readmission ratios for safety‐net hospitals vs the most affluent hospitals dropped roughly in half (for AMI, to 1.014 vs 0.992, difference 0.021; pneumonia 1.016 vs 0.996, difference 0.020; CHF, 1.018 vs 0.989, difference 0.029, Table 3), while the ratios for the most affluent hospitals increased. For AMI, 96.2 percent of the most affluent hospitals had their readmission ratio increase after adjustment, compared with just 13.0 percent of safety‐net hospitals; conversely, only 3.8 percent of the most affluent hospitals’ readmission ratios became lower (better) after adjustment, compared with 87.1 percent of safety‐net hospitals. Patterns were similar for other conditions (Table 3).
Consequently, there were significant shifts in penalty status and penalty amount for both safety‐net hospitals and more affluent hospitals under social risk adjustment (Figure 1A). Over half of the safety‐net hospitals saw their penalty decline for each condition, while between 4 and 7.5 percent went from having a penalty to having no penalty. Among the most affluent hospitals, 33‐40.5 percent saw an increase in their penalty, and between 5 and 6 percent were newly penalized.
Figure 1.
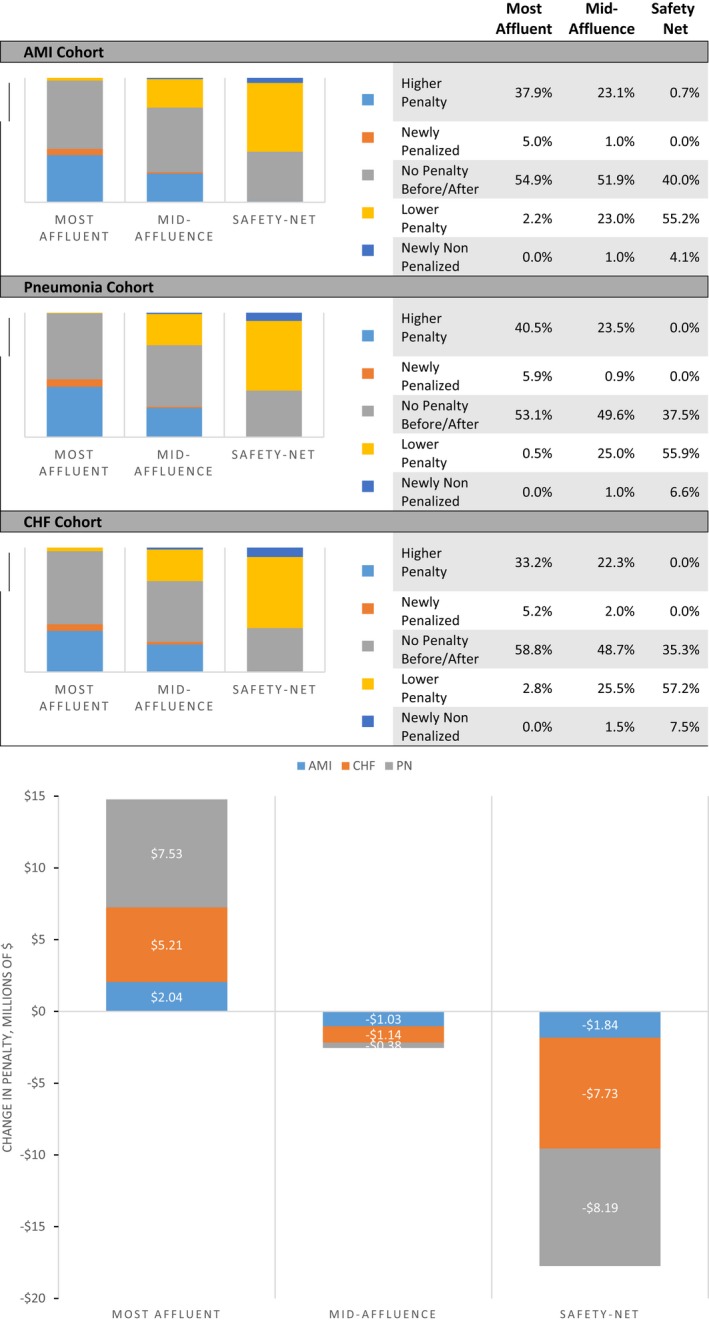
A, Proportion of hospitals with changes in penalties after social risk adjustment. B, Change in Dollar amount of penalties (in millions of dollars) [Color figure can be viewed at wileyonlinelibrary.com]
Source: (A) Authors’ calculations using CMS 100% Inpatient and Outpatient Research Identifiable File Claims Data for Medicare Fee‐For‐Service beneficiaries aged 65 and older with an index admission for AMI, pneumonia or CHF between December 1, 2012 and November 30, 2015. (B) Penalty estimates provided by DataGen using CMS base operating DRG payment data applied to the authors’ calculations using CMS 100% Inpatient and Outpatient Research Identifiable File Claims Medicare Fee‐For‐Service beneficiaries aged 65 and older with an index admission for AMI, pneumonia or CHF between December 1, 2012 and November 30, 2015.
Notes: (A) Results include hospitals eligible for penalties under the HRRP (IPPS acute care hospitals with 25 or more index admissions for each condition during the 36‐month study period). Social risk risk adjustment includes Medicaid dual‐eligibility status, original entitlement for disability status, number of residential ZIP codes, fifth‐quintile of ADI for census block group of patient residence, fifth‐quintile of ADI for hospital population. AMI=acute myocardial infarction; CHF=congestive heart failure. (B) Results include hospitals eligible for penalties under the HRRP (IPPS acute care hospitals with 25 or more index admissions for each condition during the 36‐month study period). Social risk adjustment includes Medicaid dual‐eligibility status, original entitlement for disability status, number of residential ZIP codes, fifth‐quintile of ADI for census block group of patient residence, fifth‐quintile of ADI for hospital population. AMI=acute myocardial infarction; CHF=congestive heart failure.
These changes translated into a major shift in total penalties assessed, with over $17 million less in penalties assessed to safety‐net hospitals (a 21.8 percent reduction) offset by a similar increase (22.0 percent) in penalties for the most affluent hospitals (Figure 1B).
4. DISCUSSION
We found that social risk and readmission are closely linked, and that dual status, disability, housing instability, and neighborhood disadvantage, all of which are outside hospitals’ control, had strong relationships with readmission even after adjusting for medical comorbidities in the standard CMS adjustment. Further, we found that accounting for these readily available claims‐based markers of such risk had a major financial impact on safety‐net hospitals, with over half seeing a decline in their penalty as a result of such adjustment.
Social risk and worse clinical outcomes have been definitively demonstrated to be linked.25, 26 However, the precise mechanisms linking social risk and readmission are unknown, and likely complex. There are a number of possibilities: Individuals with high levels of social risk also have higher levels of medical risk,28 and to the degree that medical risk is uncaptured in simplistic claims data, it may be underaccounted for in risk adjustment. Poverty and disability are associated with worse functional status and higher levels of frailty;29 these are not easily quantified in claims and may meaningfully contribute to outcomes such as 30‐day readmission.30, 31 Another possibility is that social risk is associated with higher readmission rates due to post‐discharge issues such as access to primary care, transportation to follow‐up appointments,32 health literacy,33 ability to adhere to self‐care regimens,34 and ability to afford prescriptions, all of which are more difficult in the presence of social risk. Finally, prior evidence suggests that social risk is associated with the receipt of poorer‐quality post‐acute care, which may impact readmission rates independent of hospital quality.3, 35, 36
There has been a great degree of controversy around whether CMS should or should not adjust readmission rates and other health outcomes for social risk when judging hospital performance. Proponents of adjustment argue that social risk, like medical risk, is outside the control of the hospital, and therefore should be accounted for similarly. In addition to any shift in the penalty dollar amount, adding social risk can improve the accuracy of quality measurement and provide face validity to the overall measurement effort, as such adjustment provides a signal to hospitals that their treatment of more challenging patients will be accounted for. Opponents of adjustment argue that adjusting for social risk accepts worse performance for these populations by the hospitals serving them; however, the way in which adjustments were made in our simulations—applying social factors at the level of the patient rather than at the level of the hospital—ensures that poor performance that is linked to the hospital rather than the patient characteristic is not adjusted away. In fact, even with adjustment, safety‐net hospitals had somewhat worse performance than wealthier hospitals; whether this represents true differences in the quality of care delivered by each hospital, or residual confounding by factors beyond hospitals’ control, is unknown. Regardless of on which side of the debate one sits, it is inarguable that this decision has real consequences: Current policies, not only in the HRRP but also other value‐based payment programs in Medicare, are disproportionately penalizing providers that serve the poor and disabled.28, 37, 38, 39, 40, 41, 42, 43, 44
Our findings are consistent with prior studies demonstrating a relationship between claims‐based measures of social risk and readmission rates,3, 4, 5, 6, 7, 8, 9, 10, 11 though to our knowledge this is the first to combine individual, community, and housing variables in such a manner. One prior study examined the relationship between adjusting for social risk and penalties under the HRRP, and despite similar quantitative findings, came to different conclusions, but that study only evaluated the dichotomous outcome of going from penalty to no penalty, and likely had more imprecise geographic social measures than the ones used here.14 A federal report examined the impact of adjustment for social risk factors in various ways, and similarly demonstrated significant changes, though using slightly different methods.28
There are limitations to our findings. Because we used administrative data and readily linked neighborhood data to assess social risk, we lack granular detail on other important risk factors, such as social support, health literacy, or individual health behaviors. Our measure of housing instability has not been validated, and analyses with this variable should be considered exploratory; we were also unable to detect housing instability within individual ZIP codes. Ongoing efforts to improve data availability for these and other social risk factors may allow more precise investigations of these relationships in the future.45 We did not have access to physician claims for our patients due to Medicare data restrictions, which could limit our ability to ascertain all comorbidities; however, our findings were similar to published CMS statistics. We estimated base operating DRG payments for our financial analyses, and those results were limited to three of the six patient cohorts that hospitals are currently penalized under the HRRP. Our analyses are limited to hospitals subject to the HRRP and may not generalize more broadly.
5. CONCLUSIONS
We found that social risk and readmission are closely linked and that accounting for readily available claims‐based markers of such risk had a major financial impact on safety‐net hospitals. Our findings suggest that direct adjustment for social risk factors has potential for leveling the playing field for hospitals that serve the most vulnerable patients, and reducing negative unintended consequences of the HRRP.
CONFLICTS OF INTEREST
Dr. Joynt Maddox does intermittent contract work for the United States Department of Health and Human Services, Office of the Assistant Secretary for Planning and Evaluation. Dr. Kind receives grant funding from the NIH/National Institute on Minority Health and Health Disparities, the NIH/National Institute on Aging, the Commonwealth Fund, the US Department of Veterans Affairs, and the US Centers for Medicare and Medicaid Services, and has performed work as a consultant for the US state of Maryland. Dr. Zaslavsky receives support under grants and contracts from the National Institutes on Aging and on Mental Health, and from the Centers for Medicare and Medicaid Services. Mr. Reidhead, Dr. Nerenz, Dr. Nagasako, and Dr. Hu report no conflicts.
Supporting information
ACKNOWLEDGMENTS
Joint Acknowledgment/Disclosure Statement: The authors acknowledge DataGen, a national health care policy and analytic firm for providing us with the HRRP penalty impact analysis reported in this study. We also wish to thank Herb B. Kuhn, Steven H. Lipstein, W. Claiborne Dunagan, Brian Waterman, and Theresa J. Roark for their contributions to this work.
Joynt Maddox KE, Reidhead M, Hu J, et al. Adjusting for social risk factors impacts performance and penalties in the hospital readmissions reduction program. Health Serv Res. 2019;54:327–336. 10.1111/1475-6773.13133
Funding information
Dr. Joynt Maddox is supported by K23HL109177‐03 from the National Heart, Lung, and Blood Institute. Dr. Kind and the production of the Area Deprivation Index are supported by the National Institute on Minority Health and Health Disparities of the National Institutes of Health under Award Number R01MD010243 (PI: Kind) and the National Institute on Aging of the National Institutes of Health under Award Number RF1AG057784 (PI: Kind; MPI: Bendlin). Dr. Zaslavsky received support for work on this research from the Henry Ford Health Care System. The funders played no role in the design or execution of the study, nor in the decision to submit it for publication.
REFERENCES
- 1. Joynt KE, Jha AK. Thirty‐day readmissions–truth and consequences. N Engl J Med. 2012;366(15):1366‐1369. [DOI] [PubMed] [Google Scholar]
- 2. Krumholz HM, Bernheim SM. Considering the role of socioeconomic status in hospital outcomes measures. Ann Intern Med. 2014;161(11):833‐834. [DOI] [PMC free article] [PubMed] [Google Scholar]
- 3. Joynt Maddox KE, Chen LM, Zuckerman R, Epstein AM. Association between race, neighborhood, and medicaid enrollment and outcomes in medicare home health care. J Am Geriatr Soc. 2018;66(2):239‐246. [DOI] [PubMed] [Google Scholar]
- 4. Tsai TC, Orav EJ, Joynt KE. Disparities in surgical 30‐day readmission rates for Medicare beneficiaries by race and site of care. Ann Surg. 2014;259(6):1086‐1090. [DOI] [PMC free article] [PubMed] [Google Scholar]
- 5. Hu J, Gonsahn MD, Nerenz DR. Socioeconomic status and readmissions: evidence from an urban teaching hospital. Health Aff (Millwood). 2014;33(5):778‐785. [DOI] [PubMed] [Google Scholar]
- 6. Jiang HJ, Wier LM. All‐Cause Hospital Readmissions among Non‐Elderly Medicaid Patients, 2007. Healthcare Cost and Utilization Project. 2010;HCUP Statistical Brief #89. http://www.hcup-us.ahrq.gov/reports/statbriefs/sb89.pdf. [PubMed]
- 7. Joynt KE, Jha AK. Who has higher readmission rates for heart failure, and why? Implications for efforts to improve care using financial incentives. Circ Cardiovasc Qual Outcomes. 2011;4(1):53‐59. [DOI] [PMC free article] [PubMed] [Google Scholar]
- 8. Rodriguez F, Joynt KE, Lopez L, Saldana F, Jha AK. Readmission rates for Hispanic Medicare beneficiaries with heart failure and acute myocardial infarction. Am Heart J. 2011;162(2):254‐261 e253. [DOI] [PubMed] [Google Scholar]
- 9. Arbaje AI, Wolff JL, Yu Q, Powe NR, Anderson GF, Boult C. Postdischarge environmental and socioeconomic factors and the likelihood of early hospital readmission among community‐dwelling Medicare beneficiaries. Gerontologist. 2008;48(4):495‐504. [DOI] [PubMed] [Google Scholar]
- 10. Hu J, Kind AJH, Nerenz D. Area deprivation index predicts readmission risk at an Urban Teaching Hospital. Am J Med Qual. 2018;33(5):493‐501. [DOI] [PMC free article] [PubMed] [Google Scholar]
- 11. Kind AJ, Jencks S, Brock J, et al. Neighborhood socioeconomic disadvantage and 30‐day rehospitalization: a retrospective cohort study. Ann Intern Med. 2014;161(11):765‐774. [DOI] [PMC free article] [PubMed] [Google Scholar]
- 12. Joynt KE, Jha AK. Characteristics of hospitals receiving penalties under the Hospital Readmissions Reduction Program. JAMA. 2013;309(4):342‐343. [DOI] [PubMed] [Google Scholar]
- 13. Sheingold SH, Zuckerman R, Shartzer A. Understanding medicare hospital readmission rates and differing penalties between safety‐net and other hospitals. Health Aff (Millwood). 2016;35(1):124‐131. [DOI] [PubMed] [Google Scholar]
- 14. Bernheim SM, Parzynski CS, Horwitz L, et al. Accounting for patients’ socioeconomic status does not change hospital readmission rates. Health Aff (Millwood). 2016;35(8):1461‐1470. [DOI] [PMC free article] [PubMed] [Google Scholar]
- 15. Grover A. Socioeconomic status and readmission rates. Health Aff (Millwood). 2016;35(11):2151. [DOI] [PubMed] [Google Scholar]
- 16. Kind AJH, Jencks SF, Brock J, Pindyck TN. Peer commentary: methodological limitations due to SES measures and geographic linkages. 2016. Accessed April 2, 2018.
- 17. 21st Century Cures Act. H.R. 34. 114th Congress (2015‐2016) ed2016.
- 18. U.S. Department of Health & Human Services, Centers for Medicare & Medicaid Services . Merit‐based Incentive Payment System (MIPS) Overview ‐ Quality Payment Program. 2017; https://qpp.cms.gov/mips/overview. Accessed September 27, 2017.
- 19. Centers for Medicare & Medicaid Services . Medicare Shared Savings Program: Statutes/Regulations/Guidance. 2016; https://www.cms.gov/Medicare/Medicare-Fee-for-Service-Payment/sharedsavingsprogram/Statutes-Regulations-Guidance.html. Accessed March 21, 2016.
- 20. Centers for Medicare and Medicaid Services . ESRD QIP PY 2017 Final Technical Measure Specifications. 2014; https://www.cms.gov/Medicare/Quality-Initiatives-Patient-Assessment-Instruments/ESRDQIP/Downloads/ESRDQIPPY2017finaltechnicalmeasurespecifications-.pdf. Accessed October 15, 2015.
- 21. Centers for Medicare and Medicaid Services . 42 CFR 483 Medicare Program; Prospective Payment System and Consolidated Billing for Skilled Nursing Facilities (SNFs) for FY 2016, SNF Value‐Based Purchasing Program, SNF Quality Reporting Program, and Staffing Data Collection. Baltimore, MD: Centers for Medicare and Medicaid Services; 2015. [PubMed] [Google Scholar]
- 22. Centers for Medicare and Medicaid Services . Home health value‐based purchasing model. 2016; https://innovation.cms.gov/initiatives/home-health-value-based-purchasing-model. Accessed October 23, 2016.
- 23. Kind AJH, Buckingham W. Making neighborhood disadvantage metrics accessible: the neighborhood Atlas. N Engl J Med. 2018;378(26):2456‐2458. [DOI] [PMC free article] [PubMed] [Google Scholar]
- 24. Centers for Medicare & Medicaid Services . 2015 Condition‐Specific Measure Updates and Specifications Report Hospital‐Level 30‐Day Risk‐Standardized Readmission Measures: AMI, CHF, PN Version 8.0. Yale New Haven Health Services Corporation/Center for Outcomes Research & Evaluation (YNHHSC/CORE) 2015.
- 25. Committee on Accounting for SES in Medicare Payment Programs . Accounting for Social Risk Factors in Medicare Payment: Criteria, Factors, and Methods. Washington, DC: National Academies of Sciences, Engineering, and Medicine; 2016. [Google Scholar]
- 26. Committee on Accounting for SES in Medicare Payment Programs . Accounting for Social Risk Factors in Medicare Payment: Identifying Social Risk Factors. Washington, DC: National Academies of Sciences, Engineering, and Medicine; 2016. [Google Scholar]
- 27. Centers for Medicare and Medicaid Services . FY 2013 IPPS Final Rule: Hospital Readmissions Reduction Program. Baltimore, MD: Centers for Medicare and Medicaid Services; 2012. [Google Scholar]
- 28. U.S. Department of Health & Human Services , Office of the Assistant Secretary for Planning and Evaluation . Report to Congress: Social Risk Factors and Performance Under Medicare's Value‐Based Purchasing Programs. Washington, DC: U.S. Department of Health and Human Services; 2016. [Google Scholar]
- 29. Joynt KE, Figueroa JF, Beaulieu N, Wild RC, Orav EJ, Jha AK. Segmenting high‐cost Medicare patients into potentially actionable cohorts. Healthc (Amst). 2017;5(1‐2):62‐67. [DOI] [PubMed] [Google Scholar]
- 30. Bock JO, Konig HH, Brenner H, et al. Associations of frailty with health care costs–results of the ESTHER cohort study. BMC Health Serv Res. 2016;16:128. [DOI] [PMC free article] [PubMed] [Google Scholar]
- 31. Kahlon S, Pederson J, Majumdar SR, et al. Association between frailty and 30‐day outcomes after discharge from hospital. CMAJ. 2015;187(11):799‐804. [DOI] [PMC free article] [PubMed] [Google Scholar]
- 32. Cakir B, Kaltsounis S, D'Jernes K, Kopf S, Steiner J. Hospital readmissions from patients’ perspectives. South Med J. 2017;110(5):353‐358. [DOI] [PubMed] [Google Scholar]
- 33. Berkman ND, Sheridan SL, Donahue KE, Halpern DJ, Crotty K. Low health literacy and health outcomes: an updated systematic review. Ann Intern Med. 2011;155(2):97‐107. [DOI] [PubMed] [Google Scholar]
- 34. Greysen SR, Harrison JD, Kripalani S, et al. Understanding patient‐centred readmission factors: a multi‐site, mixed‐methods study. BMJ Qual Saf. 2017;26(1):33‐41. [DOI] [PMC free article] [PubMed] [Google Scholar]
- 35. Rahman M, Gozalo P, Tyler D, Grabowski DC, Trivedi A, Mor V. Dual eligibility, selection of skilled nursing facility, and length of medicare paid postacute stay. Med Care Res Rev. 2014;71(4):384‐401. [DOI] [PMC free article] [PubMed] [Google Scholar]
- 36. Rahman M, Grabowski DC, Gozalo PL, Thomas KS, Mor V. Are dual eligibles admitted to poorer quality skilled nursing facilities? Health Serv Res. 2014;49(3):798‐817. [DOI] [PMC free article] [PubMed] [Google Scholar]
- 37. Chen LM, Epstein AM, Orav EJ, Filice CE, Samson LW, Joynt Maddox KE. Association of practice‐level social and medical risk with performance in the medicare physician value‐based payment modifier program. JAMA. 2017;318(5):453‐461. [DOI] [PMC free article] [PubMed] [Google Scholar]
- 38. Joynt KE, De Lew N, Sheingold SH, Conway PH, Goodrich K, Epstein AM. Should medicare value‐based purchasing take social risk into account? N Engl J Med. 2017;376(6):510‐513. [DOI] [PubMed] [Google Scholar]
- 39. Joynt KE, Zuckerman R, Epstein AM. Social risk factors and performance under medicare's value‐based purchasing programs. Circ Cardiovasc Qual Outcomes. 2017;10(5). [DOI] [PubMed] [Google Scholar]
- 40. Gilman M, Adams EK, Hockenberry JM, Milstein AS, Wilson IB, Becker ER. Safety‐net hospitals more likely than other hospitals to fare poorly under Medicare's value‐based purchasing. Health Aff (Millwood). 2015;34(3):398‐405. [DOI] [PubMed] [Google Scholar]
- 41. Gilman M, Adams EK, Hockenberry JM, Wilson IB, Milstein AS, Becker ER. California safety‐net hospitals likely to be penalized by ACA value, readmission, and meaningful‐use programs. Health Aff (Millwood). 2014;33(8):1314‐1322. [DOI] [PubMed] [Google Scholar]
- 42. Gilman M, Hockenberry JM, Adams EK, Milstein AS, Wilson IB, Becker ER. The financial effect of value‐based purchasing and the hospital readmissions reduction program on safety‐net hospitals in 2014: a Cohort Study. Ann Intern Med. 2015;163(6):427‐436. [DOI] [PubMed] [Google Scholar]
- 43. Samson LW, Chen LM, Epstein AM, Maddox KEJ. Dually enrolled beneficiaries have higher episode costs on the medicare spending per beneficiary measure. Health Aff (Millwood). 2018;37(1):86‐94. [DOI] [PubMed] [Google Scholar]
- 44. Rajaram R, Chung JW, Kinnier CV, et al. Hospital characteristics associated with penalties in the centers for medicare & medicaid services hospital‐acquired condition reduction program. JAMA. 2015;314(4):375‐383. [DOI] [PubMed] [Google Scholar]
- 45. Cantor MN, Thorpe L. Integrating data on social determinants of health into electronic health records. Health Aff (Millwood). 2018;37(4):585‐590. [DOI] [PMC free article] [PubMed] [Google Scholar]
Associated Data
This section collects any data citations, data availability statements, or supplementary materials included in this article.
Supplementary Materials