Abstract
Wnt ligands regulate metabolic pathways, and dysregulation of Wnt signaling contributes to chronic inflammatory disease. A knowledge gap exists concerning the role of aberrant Wnt signaling in non-alcoholic steatohepatitis (NASH), which exhibits metabolic syndrome and inflammation. Using a mouse model of methionine-choline deficient diet (MCDD)-induced NASH, we investigated the Wnt signaling pathways in relation to hepatic glucose oxidation. Mice fed the MCD diet for 6 weeks developed prominent NASH marked by macrovesicular steatosis, inflammation and lipid peroxidation. qPCR analysis reveals differential hepatic expression of canonical and non-canonical Wnt ligands. While expression of Wnt3a was decreased in NASH vs chow diet control, expression of Wnt5a and Wnt11 were increased 3 fold and 15 fold, respectively. Consistent with activation of non-canonical Wnt signaling, expression of the alternative Wnt receptor ROR2 was increased 5 fold with no change in LRP6 expression. Activities of the metabolic enzymes glucokinase, phosphoglucoisomerase, glyceraldehyde-3-phosphate dehydrogenase, pyruvate kinase, and pyruvate dehydrogenase were all elevated by MCDD. NASH-driven glucose oxidation was accompanied by a 6-fold increase in lactate dehydrogenase (LDH)-B with no change in LDH-A. In addition, glucose-6-phosphate dehydrogenase, the regulatory and NADPH-producing enzyme of the pentose phosphate pathway, was elevated in NASH. These data support a role of accelerated glucose oxidation in the development of NASH, which may be driven by non-canonical Wnt signaling.
Keywords: Wnt signaling, glucose, metabolism, fatty liver, NASH
INTRODUCTION
The Wnt signal transduction pathway has traditionally been characterized in the context of embryonic development, cell fate decision, and stem cell renewal1. Postnatal roles of Wnt signaling have since been recognized from the findings that organ fibrosis, tumor formation, chronic inflammation, and tissue aging are associated with aberrant Wnt signaling2–5. Emerging evidence indicates that Wnt signaling may be involved in metabolic derangement in the context of disease initiation and progression6–8. Since chronic diseases account for ~45% of all deaths in developed countries8 and are difficult to treat, a better understanding of the role of Wnt signaling can help identify treatment targets for chronic disease.
Non-alcoholic fatty liver disease (NAFLD), the most common chronic liver disease and one of the top causes for liver transplantation, is among the many chronic metabolic diseases, which include obesity, diabetes, chronic kidney disease, and cardiovascular disease9. In addition, a diagnosis of NAFLD is associated with increased risks of other chronic diseases10. One common finding in NAFLD is increased lipid species such as triglycerides and free fatty acids in the liver and plasma, which reflects increased de novo lipid biosynthesis and a breakdown in lipid homeostasis. Frequent findings of insulin resistance in NAFLD9 suggest that altered glucose metabolism has a causative role in the development of fatty liver. Given the central role of liver in coordinating intermediary metabolism, NAFLD is not simply considered a deposition of excessive fats in the liver but rather a hepatic component of an entire body affliction displaying metabolic syndrome.
Nonalcoholic steatohepatitis (NASH) is a severe form of NAFLD with a major inflammatory component, and presents a significant risk factor for cirrhosis and hepatocellular carcinoma9. It has been estimated that ~11% NASH progress toward cirrhosis over 15 years and ~7% develop hepatocellular carcinoma over 6.5 years10. Although the pathways involved in disease progression are not completely understood, oxidative stress and hepatocyte injury are characteristic features of NASH. Since the progression of the human fatty liver disease can display several pathologic stages over a long period of time, multiple signaling pathways have been implicated in NAFLD and NASH, such as those mediated by mTOR, JAK/STAT3, Notch, and Hedgehog11–14. Recent studies have further revealed a possible involvement of the Wnt signaling pathway15–17. Using a mouse model of methionine-choline deficient diet (MCDD)-induced NASH, we investigated the Wnt signaling pathways in relation to hepatic glucose metabolism.
MATERIALS AND METHODS
Animals
Two-month old male C57BL/6 mice were fed either chow diet or methionine-choline deficient diet (MCDD; #518828 Dyets, Bethlehem, PA, USA). All procedures and protocols conformed to institutional guidelines for the care and use of animals in research.
RNA isolation and qRT-PCR
RNA extraction was performed using the Total RNA isolation kits from Biomedical Research Service (Buffalo, NY, USA). Quantitative reverse transcription-polymerase chain reaction (qRT-PCR) was used to analyze gene expression as described18. Bio-Rad SYBR green kit was used for PCR reactions. β2-microglobulin was used as the reference gene. Data were analyzed by the 2ΔΔCT method. Oligonucleotides were synthesized by Midland Oligo. Primer sequences are: CCCCAAAGGGATGAGAAGTT and GGTCTGGGCCATAGAACTGA for TNF-α, TCGTGCCCAAACAAATTACA and TAGGCTTAGGCGTTTCTGGA for CD45, GGGACCCCAGTACTCCTCTC and GGGCATGATCTCCACGTAGT for Wnt3a, CTGGCTCCTGTAGCCTCAAG and GAGTTGAAGCGGCTGTTGAC for Wnt5a, GGATCCCAGGCCAATAAACT and AGACACCCCATGGCACTTAC for Wnt11, TTCACTGGGGACATTGACTG and CTGGCACACTGGAACTGAGA for LRP6, GGGGAGATTGAAAACCGAAT and AAGACGAAGTGGCAGAAGGA for ROR2, ATAGCCCAGCCAATCAACTG and TGGAACTCTGTGAGGCACTG for RYK, CCCAGAAGGCTCAGAAGTTG and AGTTGGTTCCTCCCAGGTCT for glucokinase (GK), CCATACGGAAAGGTCTGCAT and TCAGTCTGGGCCAAGAAGTT for phosphoglucoisomerase (PGI), AACTTTGGCATTGTGGAAGG and GGATGCAGGGATGATGTTCT for glyceraldehyde-3-phosphate dehydrogenase (GAPDH), TCGAAAGTGGAAAGCTTCGT and CCTGTCACCACAATCACCAG for pyruvate kinase (PK), GTTACACATCCTGGGCCATT and ACCCGCCTAAGGTTCTTCAT for lactate dehydrogenase-A (LDH-A), AGGAGTCTCCCTCCAGGAAC and TTCATAGGCACTGTCCACCA for LDH-B, TTACCGCTACCATGGACACA and CTTCTCGAGTGCGGTAGCTT for E1α of pyruvate dehydrogenase (PDH), ACCTTCATTGTGGGCTATGC and TGGCTTTAAAGAAGGGCTCA for glucose-6-phosphate dehydrogenase (G6PDH), and AGAATGGGAAGCCGAACATA and CCGTTCTTCAGCATTTGGAT for β2-microglobulin.
Liver protein homogenates
Liver tissue samples were minced and homogenized in an ice-cold lysis solution (phosphate-buffered saline supplemented with 0.1% Triton X-100) as described previously19. Homogenates were clarified by a 5-min spin in a refrigerated microfuge. Supernatants were used for all enzyme assays. Protein concentrations were determined using the Protein Assay Kit/DC from Biomedical Research Service (Buffalo, NY, USA). Samples were frozen in small aliquots at −80°C.
Enzyme activity assays
Enzyme activities were measured using liver protein lysates (2 mg/ml each). Enzyme assay kits were obtained from Biomedical Research (Buffalo, NY, USA). Assays for GK, PGI, GAPDH, PK, PDH, and G6PDH are each based on coupled substrate-specific and diaphorase reactions, converting the chromogenic substrate p-iodonitrotetrazolium violet to formazan, which exhibits an absorption maximum at 492 nm. The assay for PK is based on measurement of luciferase activity in the presence of luciferin, which is driven by PK reaction-derived ATP.
Liver triglyceride assay
Liver triglyceride levels were determined using the Triglyceride Colorimetric Assay Kit from Cayman Chemical (Ann Arbor, MI, USA). Liver protein homogenates (2 mg/ml) prepared as described above were used for the assay following the manufacturer’s instruction.
Lipid peroxidation assay
The lipid peroxidation product malondialdehyde (MDA) was measured using a kit from Biomedical Research Service (Buffalo, NY, USA) as described previously19, 20. In brief, 0.1 ml of 10% trichloroacetic acid-treated tissue homogenates were incubated with freshly prepared 6.5 mg/ml thiobarbituric acid at 95°C for 30 min. Reaction products were extracted with n-butanol and measured at 532 nm. MDA concentrations were calculated using a molar extinction coefficient of 1.56 × 105 cm−1M−1.
Western blotting
Proteins were fractionated by 12% SDS–PAGE and electrotransferred to Immobilon-P membrane, which was probed with a LDH-B antibody (Santa Cruz #sc-100775) at 4°C overnight. Washed membrane was probed with a horse radish peroxidase-conjugated secondary antibody. Signals were developed using the SuperSignal chemiluminescent substrate from Pierce Biotechnology (Waltham, MA, USA) and digitally imaged. Protein bands were quantified by densitometry.
Statistical analysis
Comparisons between two and multiple experimental groups were made with Student’s T-test and one way ANOVA, respectively. A value of p<0.05 is considered significant. Data are expressed as means ± standard deviation.
RESULTS
NASH induced by MCDD
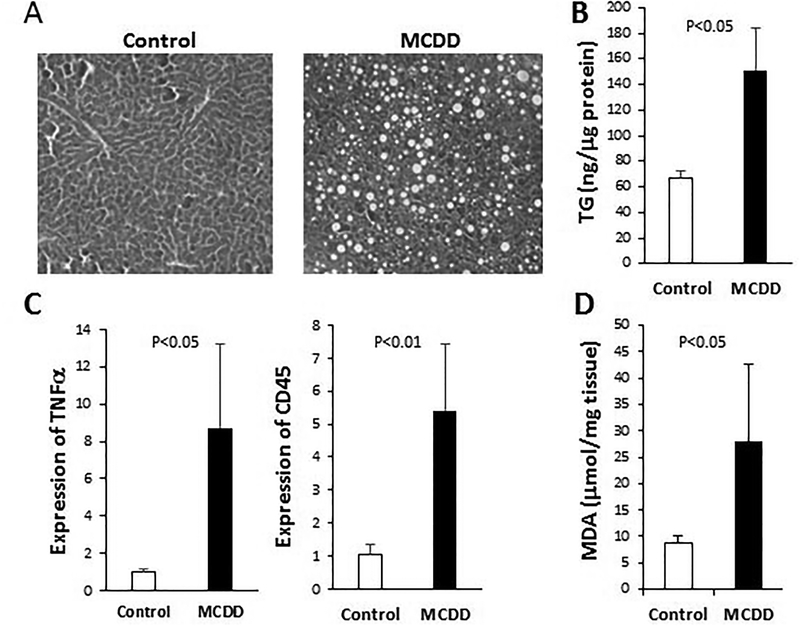
We adopted the MCDD, which is among the most widely used animal model of NASH21, 22, to investigate Wnt signaling and glucose metabolism in NASH pathogenesis. Feeding mice MCDD for 6 weeks led to hepatic macrovesicular steatosis (H&E staining in Fig. 1A) caused by increased triglycerides (Fig. 1B) as documented21, 22. Hepatic inflammation and oxidative stress are two major hallmarks of NASH9. We used qPCR to quantify expression of the inflammatory cytokine TNFα and the leukocyte common antigen CD45, both of which are found to be significantly increased by MCDD (Fig. 1C). Oxidative stress was quantified by measuring the lipid peroxidation product malondialdehyde (MDA), which is significantly elevated by MCDD (Fig. 1D). These data thus confirm the disease phenotype of NASH induced by MCDD.
Figure 1. MCDD-induced NASH.
Mice were fed chow diet (Control) or MCD diet (MCDD) for 6 weeks. (A) H&E staining of liver sections. (B) Hepatic triglycerides (ng/μg proteins) were measured using liver homogenates. (C) qPCR analysis of expression of TNFα and CD45 genes. (D) The lipid peroxidation product MDA was measured (μmol/mg tissue) following TCA extraction of liver tissue. Statistical significance is indicated where applicable.
Wnt signaling in development of NASH
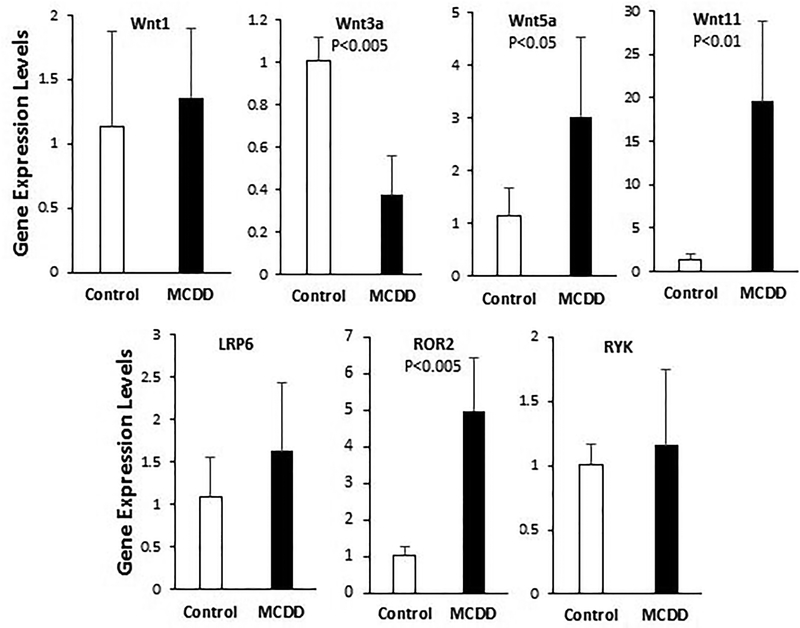
To determine whether Wnt signaling may be involved in MCDD-induced NASH, we analyzed hepatic expression of several major Wnt ligand genes, including Wnt1 and Wnt3a, which are ligands of the canonical Wnt pathway, and Wnt5a and Wnt11, which are ligands of the non-canonical Wnt pathway. qPCR anaysis (Fig. 2) shows that the canonical and non-canonical Wnt ligand genes are differentially regulated in the mouse model of NASH. While expression of Wnt1 is unchanged, that of Wnt3a is significantly reduced in NASH. In contrast, expression of Wnt5a and Wnt11 are increased 3 fold and 20 fold, respectively. We also examined serveral coreceptors involved in canonical and non-canonical Wnt signaling. Expression of LRP6, a coreceptor mediating canonical Wnt signaling, is not altered (Fig. 2). ROR2 and RYK are two coreceptors for non-canonical Wnt signaling. While expression of RYK is unchanged, that of ROR2 is increased 5 fold by MCDD (Fig. 2). These results demonstrate that MCDD-induced NASH exhibits transcriptional induction of Wnt5a, Wnt11, and ROR2, which culminates in activation of non-canonical Wnt signaling.
Figure 2. qPCR analysis of expression of Wnt ligand and coreceptor genes.
Total RNA were isolated from 6-week liver tissues and processed for qPCR analysis. Statistical significance is indicated where applicable.
Induction of genes involved in oxidative glucose metabolism
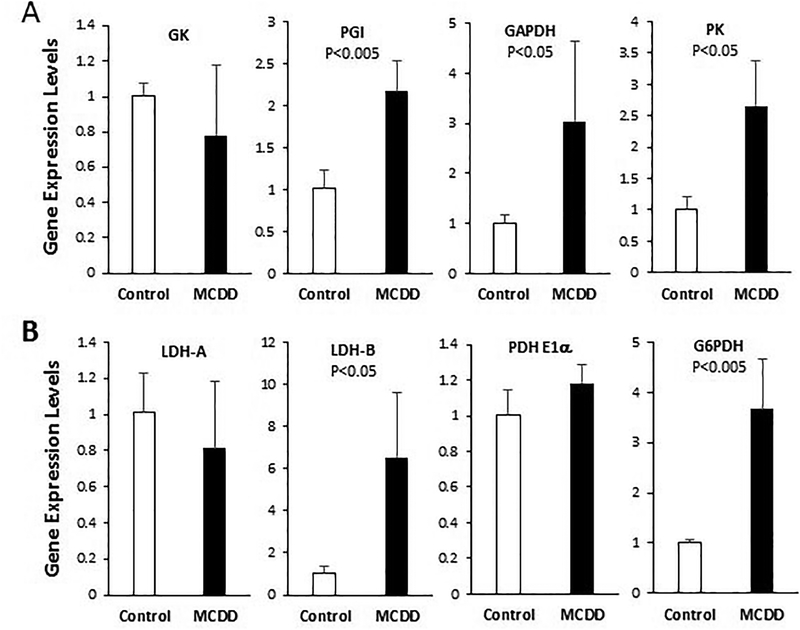
Since there is some evidence that the Wnt signaling pathway regulates nutrient-sensitive metabolism in the liver6, we next investigated a possible role of Wnt signaling in glucose metabolism. Development of steatosis is largely attributalbe to de novo lipogenesis23, which is fueled by oxidative glucose metabolism supplying acetyl-CoA and NADPH for reductive biosynthesis of fatty acids. Using qPCR we analyzed hepatic expression of several genes encoding enzymes involved in the investment phase or energy producion phase of glycolysis. The gene expression analysis reveals that transcription of PGI, GAPDH, and PK are significantly elevated in NASH (Fig. 3A). However, expression of GK is not affected by the disease.
Figure 3. qPCR analysis of expression of genes involved in oxidative glucose metabolism.
Total RNA were isolated from 6-week liver tissues and processed for qPCR analysis. (A) Analysis of genes involved in the investment or energy production phase of glycolysis. (B) Analysis of genes involved in anaerobic and aerobic metabolism of pyruvate and NADPH production. Statistical significance is indicated where applicable.
Glycolysis metabolizes glucose to pyruvate, and the enzymes involved in pyruvate metabolism include LDH, which anaerobically converts pyruvate to lactate in the cytosol, and PDH, which aerobically converts pyruvate to acetyl-CoA in the mitochondria. LDH-A is the dominant isoform in the liver and fast-twitch muscle fiber, whereas LDH-B is the dominant isoform in the heart and slow-twitch muscle fiber. The two LDH subunits are regulated differently during development and in response to hypoxia and exercise24–26. qPCR analysis shows that LDH-B, the minor isoform in the liver, is prominently induced in NASH with little change in LDH-A expression (Fig. 3B). Expression of the E1α subunit of PDH is also unchanged (Fig. 3B). Another enzyme involved in oxidative glucose metabolism is G6PDH, which couples oxidation of glucose-6-phosphate to NADPH production. Figure 3B shows that expression of G6PDH is induced 3 fold by MCDD.
Upregulation of enzyme activities responsible for glucose oxidation
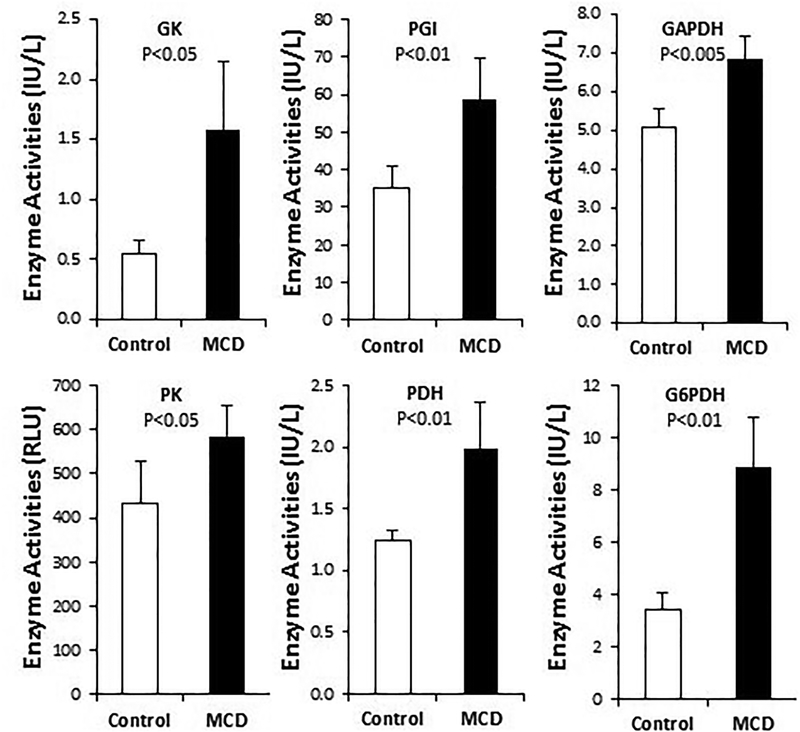
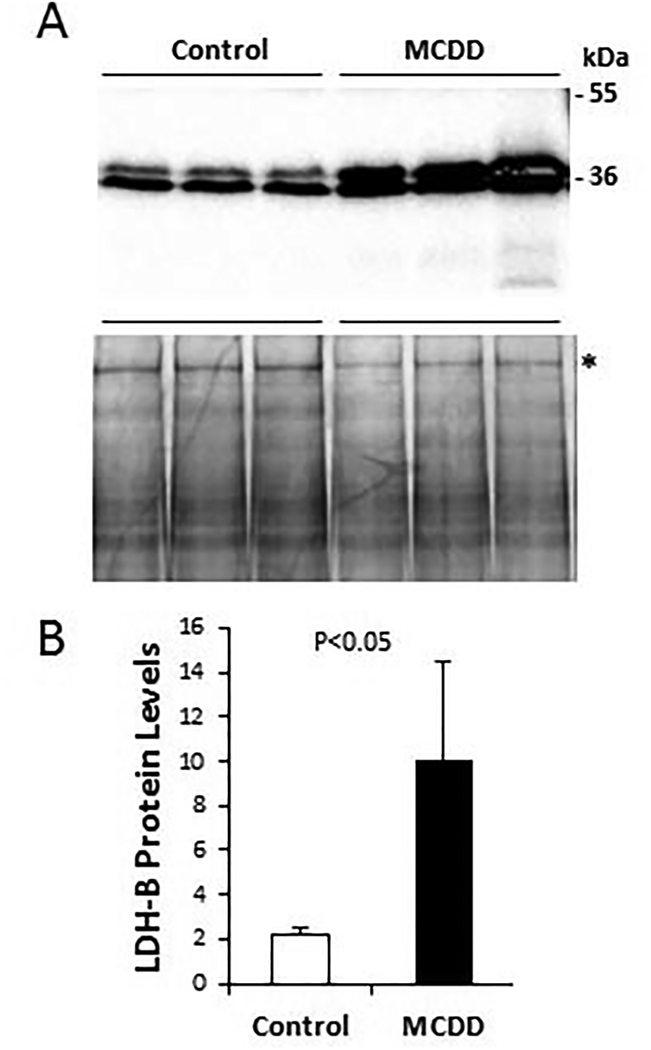
Since many enzymes involved in intermediary metabolism are also subject to post-translational regulation, we went on to measure enzyme activity or abundance using liver protein homogenates prepared from the control and NASH liver samples. Enzyme activity assays reveal that the activities of PGI, GAPDH, PK, and G6PDH are all significantly induced by MCDD (Fig. 4), as expected from the qPCR analysis shown in Figure 3. Although neither the GK gene nor the PDH E1α gene is induced at the transcriptional level (Fig. 3), activities of GK and PDH are both significantly increased by MCDD (Fig. 4), suggesting post-translational mechanisms of enzyme regulation are responsible for the observed increases of GK and PDH enzyme activities. Induction of LDH-B at the protein level was further verified by Western blotting (Fig. 5), which shows a similar induction of LDH-B as demonstrated with qPCR above. Thus, based on the data derived from RNA quantification and protein assays, we conclude that oxidative glucose metabolism is accelerated during the development of NASH, which is likely mediated by activation of non-canonical Wnt signaling.
Figure 4. Biochemical assays of enzyme activities responsible for oxidative glucose metabolism.
Liver protein homogenates were prepared from 6-week liver tissues, and enzyme activity assays were performed. Statistical significance is indicated where applicable.
Figure 5. Western blot quantification of hepatic LDH-B isozyme.
Liver protein homogenates were prepared from 6-week liver tissues and fractionated by 12% SDS-PAGE (50 μg protein per lane). A-top panel: protein bands detected by LDH-B antibody. Two relevant molecular weight markers are illustrated. A-bottom panel: total proteins were stained by Coomassie Blue. (B) The 200-kDa band marked by an asterisk is used as reference protein band for LDH-B quantification by densitometry. Statistical significance is indicated.
DISCUSSION
Hepatic lipotoxicity associated with NASH is known to be caused by an increased burden of fatty acids, oxidative stress and lipid peroxidation in hepatocytes, which are potent inducers of inflammation27. The current study demonstrates elevated non-canonical Wnt signaling in the context of accelerated glucose oxidation in MCDD-induced NASH. Our data are consistent with previous documentation of non-canonical Wnt signaling contributing to local and systemic inflammation28, 29, a hallmark of NASH. Along this line, we note that celecoxib was found to ameliorate NASH in type 2 diabetic rats via suppression of non-canonical Wnt signaling16, highlighting the critical role of the non-canonical Wnt signaling pathway in the chronic liver disease.
Wnt signals are thought to be transduced through a complex interplay among Wnt ligands, Wnt antagonists, frizzled receptors, and coreceptors30. Wnt1, 3a and 7 activate the canonical pathway, whereas Wnt5a, 5b, and 11 activate non-canonical signaling31. Our data showing decreased expression of Wnt3a and increased expression of Wnt5a and Wnt11 along with upregulation of ROR2 are evidence for attenuated canonical Wnt signaling and elevated non-canonical Wnt signaling during the development of NASH. Although Wnt3a and Wnt5a are both known to act as ligands for ROR2 in the activation of canonical or non-canonical Wnt signaling32, the reciprocal expression of Wnt3a and Wnt5a observed in the NASH model would argue for a ternary complex formed by Wnt5a/Wnt11, frizzled receptor, and ROR2 as shown previously33. Given that the phenotypes of Wnt5a knockout mice are similar to those of mice lacking ROR234, Wnt5a instead of Wnt11 may play a dominant role in the onset of steatohepatitis. Notably, LRP6 mutant mice, which manifest impaired canonical Wnt signaling, exhibit liver inflammation in the absence of fatty liver on chow diet, and the disease phenotype can be rescued by Wnt3a15. These findings along with our data support the notion that an increased activity of non-canonical Wnts plays a causal role in NASH, and suggest that hepatic inflammation may be an independent process that can be uncoupled from environmental factors such as diet.
Oxidative glucose metabolism promotes de novo lipogenesis by generating acetyl-CoA and NADPH, which are mediated by PDH and G6PDH, respectively. Indeed, both PDH and G6PDH are induced by MCDD. Glucose oxidation is thus central to the development of steatosis. Glycolysis metabolizes glucose to pyruvate, which can be anaerobically converted to lactate or aerobically converted to acetyl-CoA. Although the PDH reaction represents the rate-limiting step in glucose oxidation, lactate, which is abundantly present in the systemic circulation, can contribute to more acetyl-CoA than glucose under some metabolic condition35. In this scenario, lactate must be reabsorbed by tissue using monocarboxylate transporters and converted back to pyruvate before it can be oxidized by PDH for production of acetyl-CoA. Interestingly, we observe that LDH-B, the minor LDH isoform in the liver, is upregulated in the fatty liver with no change in LDH-A expression. Since LDH-B is well suited for conversion of lactate back to pyruvate, the coordinated upregulation of LDH-B and PDH is expected to facilitate the production of acetyl-CoA from lactate, and ultimately hepatic lipogenesis. This finding appears to explain the absence of lactic acidosis in MCDD-induced NASH despite accelerated glycolysis as evidenced by induction of glycolytic enzymes.
The operation of the Cori cycle between tissues of net lactate release and hepatic gluconeogenesis is a vital function of liver in maintaining blood glucose homeostasis36. Along this line, we observe that the NASH mice exhibit fasting hypoglycemia (blood glucose ~70 mg/dL vs. ~100 mg/dL in control mice). Our data suggest that hepatic lactate in NASH is primarily diverted toward production of acetyl-CoA for lipogenesis rather than production of glucose. This metabolic remodeling in the fatty liver stands in contrast to the well-known Warburg effect in tumor cell expansion, which relies on anaerobic glycolysis largely mediated by LDH-A even when oxygen is abundant37. Given that increased glucose uptake and metabolism often correlate with poor prognosis of many cancer cells37, 38, the current work indicates that the hepatic metabolic derangement, which is likely mediated by excessive non-canonical Wnt signaling, may contribute to the development of NASH.
CONCLUSION
The work supports a role of accelerated glucose oxidation in the development of NASH, which may be driven by non-canonical Wnt signaling. Characterization of Wnt signaling and metabolic remodeling during NASH development may provide insight for NASH intervention.
ACKNOWLEDGMENTS
This work was supported by the Tommy and Peter Fund, Inc, Buffalo, NY and Biomedical Research Service Center, University at Buffalo.
ABBREVIATIONS
- G6PDH
glucose-6-phosphate dehydrogenase
- GAPDH
glyceraldehyde-3-phosphate dehydrogenase
- GK
glucokinase
- LDH
lactate dehydrogenase
- LRP6
low-density lipoprotein receptor-related protein 6
- MCDD
methionine-choline deficient diet
- MDA
malondialdehyde
- NADPH
nicotinamide adenine dinucleotide phosphate
- NAFLD
non-alcoholic fatty liver disease
- NASH
non-alcoholic steatohepatitis
- qPCR
quantitative polymerase chain reaction
- PDH
pyruvate dehydrogenase
- PGI
phosphoglucoisomerase
- PK
pyruvate kinase
- ROR2
receptor tyrosine kinase like orphan receptor 2
Footnotes
CONFLICT OF INTEREST STATEMENT
There is no conflict of interest.
REFERENCES
- 1.Petersen CP and Reddien PW 2009, Cell, 139, 1056. [DOI] [PubMed] [Google Scholar]
- 2.Brack AS, Conboy MJ, Roy S, Lee M, Kuo CJ, Keller C and Rando TA 2007, Science, 317, 807. [DOI] [PubMed] [Google Scholar]
- 3.He W, Dai C, Li Y, Zeng G, Monga SP and Liu Y 2009, J. Am. Soc. Nephrol, 20, 765. [DOI] [PMC free article] [PubMed] [Google Scholar]
- 4.Reya T and Clevers H 2005, Nature, 434, 843. [DOI] [PubMed] [Google Scholar]
- 5.MacDonald BT, Tamai K and He X 2009, Dev. Cell, 17, 9. [DOI] [PMC free article] [PubMed] [Google Scholar]
- 6.Liu H, Fergusson MM, Wu JJ, Rovira II, Liu J, Gavrilova O, Lu T, Bao J, Han D, Sack MN and Finkel T 2011, Sci. Signal, 4, 1. [DOI] [PMC free article] [PubMed] [Google Scholar]
- 7.Lin H, Angeli M, Chung KJ, Ejimadu C, Rosa AR and Lee T 2016, American J. of Physiology Cell Physiology 311, C710. [DOI] [PMC free article] [PubMed] [Google Scholar]
- 8.Ackers I and Malgor R 2018, Diabetes & Vascular Disease Research 15, 3. [DOI] [PMC free article] [PubMed] [Google Scholar]
- 9.Liu W, Baker RD, Bhatia T, Zhu L and Baker SS 2016, Cellular and Molecular Life Sciences, 73, 1969. [DOI] [PMC free article] [PubMed] [Google Scholar]
- 10.Torres DM, Williams CD and Harrison SA 2012, J. of American Gastroenterological Association 10, 837. [DOI] [PubMed] [Google Scholar]
- 11.Kubrusly MS, Correa-Giannella ML, Bellodi-Privato M, de Sa SV, de Oliveira CP, Soares IC, Wakamatsu A, Alves VA, Giannella-Neto D, Bacchella T, Machado MC and D’Albuquerque LA 2010, Histol. Histopathol 25,1123. [DOI] [PubMed] [Google Scholar]
- 12.Min HK, Mirshahi F, Verdianelli A, Pacana T, Patel V, Park CG, Choi A, Lee JH, Park CB, Ren S and Sanyal AJ 2015, Am. J. Physiol. Gastrointest. Liver Physiol 308, G794. [DOI] [PMC free article] [PubMed] [Google Scholar]
- 13.Valenti L, Mendoza RM, Rametta R, Maggioni M, Kitajewski C, Shawber CJ and Pajvani UB 2013, Diabetes, 62, 4052. [DOI] [PMC free article] [PubMed] [Google Scholar]
- 14.Verdelho MM and Diehl AM 2018, Crit. Rev. Biochem. Mol. Biol 53, 264. [DOI] [PMC free article] [PubMed] [Google Scholar]
- 15.Wang S, Song K, Srivastava R, Dong C, Go GW, Li N, Iwakiri Y and Mani A 2015, FASEB J 29, 3436. [DOI] [PMC free article] [PubMed] [Google Scholar]
- 16.Tian F, Zhang YJ, Li Y and Xie Y 2014, PloS One, 9:e83819. [DOI] [PMC free article] [PubMed] [Google Scholar]
- 17.Behari J, Yeh TH, Krauland L, Otruba W, Cieply B, Hauth B, Apte U, Wu T, Evans R and Monga SP 2010, The American J. of Pathology 176, 744. [DOI] [PMC free article] [PubMed] [Google Scholar]
- 18.Lin H, Shabbir A, Molnar M, Yang J, Marion S, Canty JM Jr and Lee T 2008, J. Cell. Physiol 216, 458. [DOI] [PubMed] [Google Scholar]
- 19.Missihoun C, Zisa D, Shabbir A, Lin H and Lee T 2008, Mol. Cell. Biochem 321, 45. [DOI] [PMC free article] [PubMed] [Google Scholar]
- 20.Esterbauer H and Zollner H 1989, Free Radical Biology & Medicine, 7, 197. [DOI] [PubMed] [Google Scholar]
- 21.Machado MV, Michelotti GA, Xie G, Almeida PT, Boursier J, Bohnic B, Guy CD and Diehl AM 2015, PloS One, 10, e0127991. [DOI] [PMC free article] [PubMed] [Google Scholar]
- 22.Pelz S, Stock P, Bruckner S and Christ B 2012, Exp. Cell Res 318, 276. [DOI] [PubMed] [Google Scholar]
- 23.Donnelly KL, Smith CI, Schwarzenberg SJ, Jessurun J, Boldt MD and Parks EJ 2005, J. Clin. Invest 115, 1343. [DOI] [PMC free article] [PubMed] [Google Scholar]
- 24.Daneshrad Z, Verdys M, Birot O, Troff F, Bigard AX and Rossi A 2003, Exp. Physiol 88, 405. [DOI] [PubMed] [Google Scholar]
- 25.Rossignol F, Solares M, Balanza E, Coudert J and Clottes E 2003, J. Cell. Biochem 89, 67. [DOI] [PubMed] [Google Scholar]
- 26.Washington TA, Reecy JM, Thompson RW, Lowe LL, McClung JM and Carson JA 2004, J. Appl. Physiol 97, 1424. [DOI] [PubMed] [Google Scholar]
- 27.Neuschwander-Tetri BA 2010, Hepatology, 52, 774. [DOI] [PubMed] [Google Scholar]
- 28.Zuriaga MA, Fuster JJ, Farb MG, MacLauchlan S, Breton-Romero R, Karki S, Hess DT, Apovian CM, Hamburg NM, Gokce N and Walsh K 2017, Scientific Reports, 7, 17326. [DOI] [PMC free article] [PubMed] [Google Scholar]
- 29.Pashirzad M, Shafiee M, Rahmani F, Behnam-Rassouli R, Hoseinkhani F, Ryzhikov M, Moradi BM, Parizadeh MR, Avan A and Hassanian SM 2017, J. Cell. Physiol 232, 1611. [DOI] [PubMed] [Google Scholar]
- 30.Katoh M and Katoh M 2007, Clin. Cancer Res 13, 4042. [DOI] [PubMed] [Google Scholar]
- 31.Weeraratna AT 2005, Cancer Metastasis Rev 24, 237. [DOI] [PubMed] [Google Scholar]
- 32.Rasmussen NR, Wright TM, Brooks SA, Hacker KE, Debebe Z, Sendor AB, Walker MP, Major MB, Green J, Wahl GM and Rathmell WK 2013, J. Biol. Chem 288, 26301. [DOI] [PMC free article] [PubMed] [Google Scholar]
- 33.Nishita M, Itsukushima S, Nomachi A, Endo M, Wang Z, Inaba D, Qiao S, Takada S, Kikuchi A and Minami Y 2010, Mol. Cell. Biol 30, 3610. [DOI] [PMC free article] [PubMed] [Google Scholar]
- 34.Oishi I, Suzuki H, Onishi N, Takada R, Kani S, Ohkawara B, Koshida I, Suzuki K, Yamada G, Schwabe GC, Mundlos S, Shibuya H, Takada S and Minami Y 2003, Genes Cells, 8, 645. [DOI] [PubMed] [Google Scholar]
- 35.Chatham JC, Gao ZP and Forder JR 1999, The American J. of Physiology 277, E342. [DOI] [PubMed] [Google Scholar]
- 36.Brooks GA 2007, Sports Med 37, 341. [DOI] [PubMed] [Google Scholar]
- 37.Otto AM 2016, Cancer Metab 4:5. [DOI] [PMC free article] [PubMed] [Google Scholar]
- 38.Jones RG and Thompson CB 2009, Genes & Development, 23, 537. [DOI] [PMC free article] [PubMed] [Google Scholar]


