

Abstract
Quantifying normal variation and the genetic underpinnings of anatomical structures is one of the main goals of modern morphological studies. However, the extent of genetic contributions to normal variation in craniofacial morphology in humans is still unclear. The current study addresses this gap by investigating the genetic underpinnings of normal craniofacial morphology The sample under investigation consists of 75 linear and angular measurements spanning the entire craniofacial complex, recorded from lateral cephalographs of 1,379 participants in the Fels Longitudinal Study. Heritabilities for each trait were estimated using SOLAR, a maximum-likelihood variance components approach utilizing all pedigree information for parameter estimation. Trait means and mean effects of the covariates age, sex, age2, sex × age, and sex × age2 were simultaneously estimated in the analytic models. All traits of the craniofacial complex were significantly heritable. Heritability estimates ranged from 0.10 to 0.60, with the majority being moderate. It is important to note that we found similar ranges of heritability occurring across the different functional/developmental components of the craniofacial complex, the splanchnocranium, the basicranium, and the neurocranium. This suggests that traits from different regions of the craniofacial complex are of comparable utility for the purposes of population history and phylogeny reconstruction. At the same time, this genetic influence on craniofacial morphology signals a caution to researchers of nongenetic studies to consider the implications of this finding when selecting samples for study given their project design and goals.
Keywords: heritability, craniofacial morphology, population history, phylogeny reconstruction
A primary consideration in modern morphological investigations is the identification, and/or quantification, of the myriad forces influencing normal variation. For the craniofacial complex, this has largely taken the form of functional studies, particularly of the structures associated with mastication (Hylander, 1981; Daegling and Hylander, 2000; Dechow and Hylander, 2000; Ravosa et al., 2000). Investigation of the genetic influences on craniofacial variation is largely restricted to analysis of early development in animal models or the etiology of disorders in humans (Wilkie et al., 1995; Cohen, 2000; Zeiger et al., 2002; Kimonis et al., 2007; Vieira, 2008; Vieira et al., 2008a,b). We present here a comprehensive analysis of genetic influence on craniofacial variation in participants from the Fels Longitudinal Study, a multigeneration family-based study.
Quantitative analysis of external cranial form began in the 19th century with the work of anatomists such as Blumenbach, Retzius, Broca, and Lombroso. Standardized cephalometric evaluation of the internal structures of the skull was introduced by Broadbent (1931) with the application of the Bolton method standardizing radiographic technique. By 1876, Sir Francis Galton began evaluating heritable aspects of craniofacial form by examining sets of twins (Galton, 1876a,b,1885). Since then numerous studies have examined genetic influence on craniofacial traits, generally showing moderate to high levels of heritability (Wylie, 1944; Lundström, 1954; Nakata et al., 1974; Byard et al., 1984a,b, 1985a,b; Poosha et al., 1984; Sharma et al., 1984; Lundström and McWilliam, 1987, 1988; Hunter, 1990; Kitahara et al., 1996; Duren et al., 2003; Sherwood et al., 2003).
Often such studies of craniofacial variation are limited to regional anatomy or external measures including soft tissue. For example, Byard et al. (1985a,b) examined 30 cephalometric measures within nuclear families from India. They determined that facial height measurements were under greater genetic control than were facial breadth and ear dimensions. Also working in India, Arya et al. (2002) compared heritabilities of craniofacial measures with those from standard anthropometrics of trunk, limb, and skin-folds. Their results indicated that craniofacial traits exhibit higher heritabilities than postcranial or soft tissue traits, and that socioeconomic factors did not influence those heritability estimates in a consistent manner.
Cranial radiography affords the opportunity to examine internal structures within the craniofacial complex, including deep basicranial traits. The heritability of radiographic craniofacial traits has been examined by a number of investigators. For example, Lundström and McWilliam (1987) tested the hypothesis that horizontal measurements are under stronger genetic control than vertical measures in a sample of mono- and dizygotic twins. While heritabilities were highest for four vertical variables, there were no significant differences in the heritabilities of horizontal and vertical measures overall. Nakata et al. (1974) demonstrated a heritable component in 31 of 33 cephalometric measurements using a twin-based sample.
The current study furthers our understanding of the genetics of the craniofacial complex by quantifying the extent to which normal phenotypic variation in craniofacial morphology can be attributed to underlying genetic effects. This study examines a comprehensive set of craniofacial phenotypes derived from each of the developmental/functional components—the basicranium, splanchnocranium, and neurocranium. For this, we leverage the power available in the radiographic database of the multigenerational, family-based Fels Longitudinal study to estimate the heritability of craniofacial traits.
MATERIALS AND METHODS
Study Sample
The sample for the present study consists of lateral cephalographs of 1,379 participants (655 male and 724 female) of the Fels Longitudinal Study (FLS), the longest running study of human growth and development in the world (Roche, 1992). Participants were not selected for any phenotypic, craniofacial, or health-related trait, and thus represent normal variation in such traits. They generally come from Southwest Ohio and neighboring regions, are predominantly of European ancestry, and were born between 1890 and 1974. Detailed age and sex distribution for the sample is shown in Fig. 1. All protocols were approved by the Wright State University Institutional Review Board.
Fig. 1.
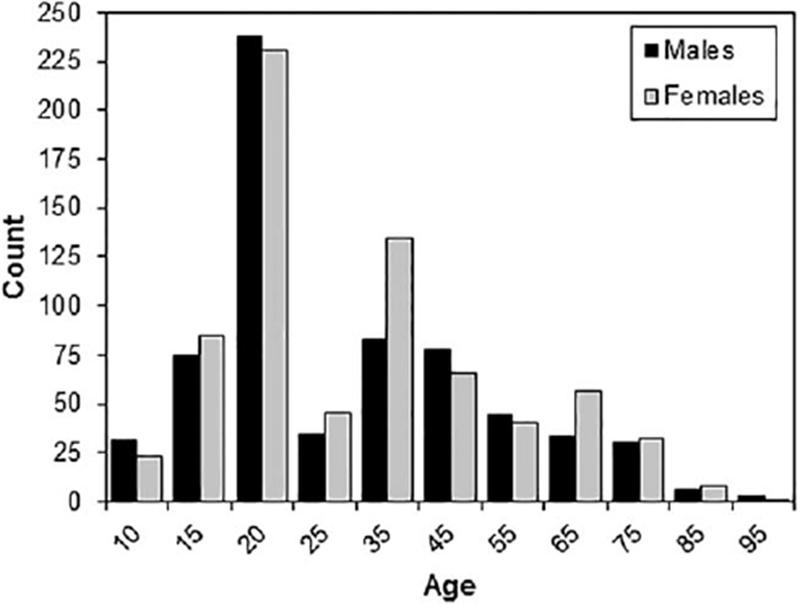
Age distribution of the sample.
Because of the serial nature of data in the FLS, most participants have multiple radiographs available for study. For the purposes of this article, we have chosen to utilize cephalographs taken closest to the participant’s 18th birthday with a minimum age of 8 years. In cases where only a single cephalograph was available, that cephalograph was used in our analyses if it met the minimum age requirement. This procedure maximizes the sample size improving statistical power for quantitative genetic analyses, but does include a period when the craniofacial complex undergoes significant growth. By age 8 years, however, approximately 80% to 95% of adult size has been achieved for many of the linear metrics investigated (Buschang et al., 1983; Lieberman et al., 2000b). Likewise, angular measures undergo less change, relative to linear metrics, past age 8 years (Nahhas et al., 2014).
Phenotypic Analyses
Phenotyping was performed using a semi-automated system (Nemoceph; CDImaging), optimized for a fast and reliable collection of human cephalometric data (Sherwood et al., 2011). Radiographs were scanned using an Epson Expression 10000XL equipped with a transparency adapter. A 10 cm ruler was included for size calibration. Before scanning, all radiographs were reviewed for correct positioning and absence of conditions potentially influencing measurement accuracy (e.g., head rotation, radiograph damage, etc.). Selected radiographs were scanned directly into Nemoceph, which allows the user to adjust parameters such as brightness and contrast, and apply various filters for improved identification of cephalometric points on both hard tissue and soft tissue structures. Tracing in Nemoceph begins with identifying predefined cephalometric landmarks (48 in this study, Table 1, Fig. 2) on each cephalograph. Following that initial step, the program provides a rough outline of internal and external aspects of the skull, central incisors and first molars, which are then manually adjusted by the user to create an exact tracing. Finally, once the tracing is complete, the user can select to collect standard craniofacial measures, such as a Rickett’s and Steiner’s analysis (see Merow and Broadbent, 1990), or create a unique set of measurements. For this study, we created a comprehensive dataset that includes standard metrics common in clinical evaluation, as well as numerous measures particularly relevant for comparative anatomy of human craniofacial variation.
TABLE 1.
Cephalometric points and planes identified on each lateral cephalograph
| Trait | Abbreviation | Description |
|---|---|---|
| Anterior nasal spine | ANS | Tip of the anterior nasal spine |
| Articulare | Ar | The intersection of the image of the posterior border of the ramus with the external surface of the basicranium |
| Basion | Ba | The anterior margin of the foramen magnum |
| Canine tip | A3, B3 | Tip of canine (upper and lower, respectively) |
| Center of condyle | Dc | Intersection point between the condyle axis (Xi-Cd) and the Ba-N plane. |
| Center of face | CF* | Posterior most point of the pterygomaxillary fissure |
| Center of mandible | Xi* | Point halfway from the height and depth of the mandibular ramus |
| Cephalometric gonion | Goc* | Intersection of tangent to the posterior and inferior borders of the mandible |
| Cranial centris | CC | The intersection of the facial axis and Ba-N plane |
| Distal molar | A6, B6 | Distal margin of first molar (upper and lower, respectively) |
| Facial plane | FP | Line connecting nasion and pogonion |
| Frankfort horizontal | FH* | Plane defined by right and left porion and left orbitale |
| Gnathion | Gn | The lowest, most anterior point on the mandibular symphysis |
| Gonion | Go* | The external angle of the mandible |
| Incisor tip | A1, B1 | Tip of central incisor (upper and lower, respectively) |
| Lower lip | LL | Vermillion border of lower lip |
| Mental protuberance | Pm | Point of inflection of the curvature at the profile of the chin (aka suprapogonion) |
| Menton | Me | The most inferior point on the mandibular symphysis |
| Nasal tip | NT | Most anterior point of the nose (soft tissue) |
| Nasale medium columella | NM | The fleshy lower margin of the nasal septum (soft tissue) |
| Nasion | N | The intersection of the nasal and frontal bones |
| Orbitale | Or* | Inferiormost point of the orbit |
| Palatal plane | ANS-PNS | Line connecting ANS and PNS |
| Pogonion | Pog | The most anterior point of the mandibular symphysis |
| Point A | Pt. A | Point in the median sagittal plane where the lower front edge of the anterior nasal spine meets the front wall of the maxillary alveolar process (aka subspinale) |
| Point B | Pt. B | Deepest midline point on the mandible between infradentale and pogonion (aka supramentale) |
| Point D | D | The center of the cross section of the mandibular symphysis |
| Porion | Po* | Superior margin of external auditory canal |
| Posterior condyle | PCd* | The point of the condyle tangent to a perpendicular line extending from the S-N plane |
| Posterior nasal spine | PNS | The posterior point of the hard palate |
| Pterygomaxillary fissure inferior | PTM* | Teardrop shaped area between maxilla and pterygoid process of the sphenoid |
| Sella | S | The pituitary fossa of the sphenoid bone |
| Soft tissue pogonion | Pog(st) | The most anterior point of the chin (soft tissue) |
| Sphenoethmoidal suture | Se | Point identifying the sphenoethmoidal suture |
| Stomion superior | Sts | Lowest point of the vermillion border of upper lip (soft tissue) |
| X### | Points defined along the endocranial surface of the neurocranium relative to the S-N plane (e.g., X100 = the point at which a line drawn at 100° from the S-N plane intersects the endocranium) |
All points represent midline structures
Fig. 2.

Cephalometric landmarks recorded in this study.
A total of 75 linear and angular measurements were taken based on craniometric points identified on the cephalographs (Table 2). These points and measurements were selected so as to capture variation within and between craniofacial components (neurocranium, basicranium, and splanchnocranium). While the majority of linear measures are contained within their respective components, some linear and several angular measures span components. All linear measures were corrected for radiographic enlargement based on known modifications of the FLS radiographic protocol between 1931 and 1982 (Roche, 1992; Sherwood et al., 2011).
TABLE 2.
Quantitative measures collected from lateral cephalographs
| Trait name | Definition |
|---|---|
| Basicranial traits | |
| Ba-N | Linear distance between Ba and N |
| Ba-PNS | Linear distance between Ba and PNS |
| Ba-S | Linear distance between Ba and S |
| Cranial deflection | Angular measure between Ba-N plane and the Frankfort horizontal |
| N-S-Ba | Angular measure from N to S to Ba |
| Porion location | Linear distance from Po to CF |
| Posterior condyle | Linear distance between Sella and PCd |
| S-N | Linear distance between S and N |
| S-PNS | Linear distance between S and PNS |
| S-Se | Linear distance between S and Se |
| Maxillary traits | |
| ANB | Angular measure from Pt. A to N to Pt. B |
| Ba-Pt. A | Linear distance between Ba and Pt. A |
| Maxillary depth | Angular measure from Frankfort horizontal to N-Pt. A plane |
| Maxillary height | Angular measure from N to CF to Pt. A |
| N-PNS | Linear distance between N and PNS |
| N-Pt. A | Linear distance between N and Pt. A |
| Palatal plane | Angular measure between Frankfort horizontal and Palatal Plane |
| PNS-Pt. A | Linear distance between PNS and Pt. A |
| UI to N-A | Linear distance from A1 to N-A plane |
| Upper incisor protrusion | Linear distance between A1 and Pt. A – Pog plane |
| Upper incisor inclination | Angle between the axis of the upper central incisor to the Pt. A-Pog plane |
| Mandibular traits | |
| Ar-Go | Linear distance between Ar and Go |
| Ar-Pt. B | Linear distance between Ar and Point B |
| Ba-Ar | Linear distance between Ba and Ar |
| Corpus length | Linear distance between Xi and Pm |
| Cranial length | Linear distance between CC and N |
| Go-Me | Linear distance between Go and Me |
| Ar-Me | Linear distance between Ar and Me |
| Posterior facial height | Linear distance from Go to CF |
| Lower incisor extrusion | Linear distance from B1 to Occlusal plane |
| Lower incisor protrusion | Linear distance from B1 to Pt. A-Pog plane |
| Lower incisor inclination | Angle between the axis of the lower central incisor to the Pt. A-Pog plane |
| Mandibular plane angle | Angular measure from Goc to Me to Pog |
| Mandibular arch | Angular measure from DC to Xi to Pm |
| Gonial angle | Angular measure from Ar to Go to Me |
| Go-Gn-SN | Angular measure between Go-Gn plane and S-N plane |
| Splanchnocranial traits | |
| Facial axis | Angular measure between BA-N plane and line from foramen rotundum to Gn |
| Facial depth | Angular measure between Frankfort horizontal and Facial plane |
| Facial taper | Angular measure between mandibular plane (Go-Me) and N-Pog plane |
| Canine relation | Linear distance from canine tips (A3-B3) in the occlusal plane |
| Molar relation | Linear distance between A6 and B6 in occlusal plane |
| Convexity | Linear distance from Pt. A to the N-Pog plane |
| LI-N-B | Linear distance from B1 to N-Pt. B plane |
| Lower facial height | Angular measure from ANS to Xi to Pm |
| Interincisal angle | Angular measure between axis of upper and lower central incisors |
| N-S-PNS | Angular measure from N to S to PNS |
| Occlusal plane inclination | Angular measure between Occlusal plane and S-N plane |
| Occ-R | Perpendicular distance from the Occlusal Plane to Xi |
| Overbite | Vertical linear distance between B1 and A1 |
| Overjet | Horizontal linear distance between B1 and A1 |
| Pog-to-N-B | Linear measure from Pog to N-Pt. B plane |
| Pog-to-S-N | Linear distance between Pog to S projected onto S-N plane |
| Ramus position | Angular measure from CF to Xi plane to Frankfort Horizontal |
| SNB | Angular measure from S to N to Pt. B |
| SND | Angular measure from S to N to D |
| S-N-Pt. A | Angular measure from S to N to Pt. A |
| S-Pt. A | Linear distance between S and Pt. A |
| UM position | Linear distance between A6 and PTM projected onto Frankfort horizontal |
| Neurocranial traits | |
| S-X60 | Linear distance between S and X60 |
| S-X70 | Linear distance between S and X70 |
| S-X80 | Linear distance between S and X80 |
| S-X90 | Linear distance between S and X90 |
| S-X100 | Linear distance between S and X100 |
| S-X110 | Linear distance between S and X110 |
| S-X120 | Linear distance between S and X120 |
| S-X130 | Linear distance between S and X130 |
| S-X140 | Linear distance between S and X140 |
| S-X150 | Linear distance between S and X150 |
| S-X160 | Linear distance between S and X160 |
| S-X170 | Linear distance between S and X170 |
| S-X180 | Linear distance between S and X180 |
| Soft tissue traits | |
| LE-Occ | Linear distance between STS and the occlusal plane |
| Lip protrusion | Linear distance between LL and the NT to Pog(st) plane |
| Lower lip protrusion | Angular measure from LL to NT-Pog(st) plane |
| UL protrusion | Linear distance from STS to Pog(st)-NT plane |
Due to the relative paucity of reliable craniometric points on much of the cranial vault, and the inherent difficulty in identifying them on lateral cephalographs, a set of semilandmarks was designed to capture variation in neurocranial shape. From the reference line from sella to nasion (S-N), semilandmarks were placed every 10 degrees up to 180 degrees along the endocranial surface. Linear measures were taken from sella to each point on the endocranial surface, omitting the first few lines that do not intersect the endocranial surface. In addition, the reliability of the first six lines was negatively affected by intracranial structures such as the crista galli or the frontal crest, so they were excluded from the final dataset. The final dataset included 13 cranial vault measures (S-X60 to S-X180).
Radiographs were measured by two assessors. Interobserver reliability was examined using a total of 331 radiographs measured by both assessors (Sherwood et al., 2011; Supporting Information Table 1). Interobserver reliability was very high, with an average intraclass correlation of 0.91 for angular measures and 0.95 for linear measures. Average interobserver differences were 1.8 degrees for angular measures, and 1.12 mm for linear metrics.
Statistical Genetic Analyses
Estimation of narrow-sense heritability (h2) for each measurement was done using the Sequential Oligogenic Linkage Analysis Routines (SOLAR) package (Almasy and Blangero, 1998). SOLAR uses a maximum likelihood-based variance decomposition method incorporating all familial information in parameter estimation. The statistical significance of reported heritabilities was tested using a likelihood ratio test for nested models.
Before estimating heritabilities, we applied an inverse Gaussian transformation to the phenotypic values to correct for departures from multivariate normality that might bias estimates. We also screened a number of potentially significant covariates that may be contributing to the phenotypic variance. Given that the sample includes prepubertal children, and that cranial traits are known to show modest amounts of sexual dimorphism, it was expected that age and sex effects may contribute to trait variance. Therefore, the covariates included in the analyses were age, age2, sex, age × sex, and age2 × sex. Only those covariates significant at the P < 0.10 level were retained in the final model for each cranial measurement; the percent of phenotypic variance described by the covariates is given as c2. Heritability estimates noted as represent residual heritabilities, or that portion of the phenotypic variance explained by additive genetic effects after all significant covariate effects have been removed. Scaling these heritability estimates to represent that portion of the total phenotypic variance explained by additive genetic effects is calculated as and noted here as . Both and are presented in tables, but discussions are restricted to as that is more commonly presented in the literature. The portion of the total phenotypic variance attributable to environmental (i.e., nongenetic) effects is noted as e2 and given as .
The 1,379 individuals included in this study come from 176 nuclear and extended families. The Fels Longitudinal Study is multigenerational, so in addition to parent-offspring and sibling pairs commonly utilized in family studies, there are 17 other relative pair classes in larger family pedigrees. The degrees of relatedness in those pedigrees range from first-degree (e.g., parent-offspring, full siblings) up to ninth-degree relatives (e.g., fourth cousins) (Table 3).
TABLE 3.
Relative pairings represented among 1,379 individuals with lateral cranial radiographs
| Relationship | Degree of relationship | N |
|---|---|---|
| Self | 1st Degree | 1,379 |
| Parent-offspring | 1,380 | |
| Full siblings | 834 | |
| Grandparent–grandchild | 2nd Degree | 680 |
| Avuncular | 992 | |
| Half siblings | 45 | |
| Great grandparent–great grandchild | 3rd Degree | 36 |
| Grand avuncular | 194 | |
| Half avuncular | 59 | |
| 1st cousins | 760 | |
| Great grand avuncular | 4th Degree | 1 |
| 1st cousins, once removed | 433 | |
| Half 1st cousins | 33 | |
| 1st Cousins, twice removed | 5th Degree | 26 |
| 2nd Cousins | 338 | |
| 2nd Cousins, once removed | 6th Degree | 103 |
| 3rd Cousins | 7th Degree | 66 |
| 2nd Cousins, twice removed | 9 | |
| 3rd Cousins, once removed | 8th Degree | 30 |
| 4th Cousins | 9th Degree | 9 |
| Total | 6,028 |
RESULTS
Statistical genetic analyses identified statistically significant (P < 0.05) heritability in all 75 traits examined. Heritability estimates ranged from 0.10 for molar relation to 0.60 for the nasion-sella-basion angle. The results are presented for traits in each of the five craniofacial regions we identified (basicranium, maxilla and mandible, neurocranium, face, soft tissue), as well as traits spanning multiple components. Heritabilities of angular measures are also presented separately.
Variance Explained by Covariates
After screening for covariates in each model, we found very few traits lacking significant covariate effects. Age and sex, if not their interactions, were significant in nearly all models. The proportion of variance explained by significant covariates ranged from 0% to 40.7%. The measurements with the highest proportion of variance explained by covariates are generally traits known to be sexually dimorphic, particularly in the mandible (e.g., the length of the mandible as measured from articulare to menton), or traits that greatly increase in size during ontogeny (e.g., anterior cranial base length as measured from sella to nasion), therefore reflecting age- and sex-related variation in our sample. Traits without covariate effects included angular measures of the face, the facial axis and the facial taper, as well as overjet and overbite.
Basicranial Traits
Heritability estimates in basicranial traits were moderate (Table 4). The lowest heritabilities are exhibited by porion location () and two linear distances, from basion to sella () and from basion to posterior nasal spine (). The distance spanning the length of the cranial base (basion to nasion) exhibits moderate heritability (), similar to a measure of anterior cranial base (sella to sphenoethmoidal junction, ). The highest heritabilities in this craniofacial component are present in the distance from posterior condylion to the sella-nasion line and from sella to posterior nasal spine (both ), with the highest heritability observed in the distance from sella to nasion ().
TABLE 4.
Heritability estimates (±SE) and covariate effects for basicranial traits
| Covariates |
|||||||||||
|---|---|---|---|---|---|---|---|---|---|---|---|
| Trait | Age | Sex | Age × Sex | Age2 | Age2 × Sex | c2 | P* | N | |||
| Porion location | 0.29 ± 0.054 | 0.26 | • | • | • | • | • | 0.10 | 0.64 | 1.53 × 10⁻¹⁰ | 1,347 |
| Basion to sella | 0.32 ± 0.050 | 0.24 | • | • | • | • | • | 0.25 | 0.51 | 5.27 × 10⁻¹⁴ | 1,373 |
| Basion to PNS | 0.35 ± 0.047 | 0.31 | • | • | • | • | 0.10 | 0.59 | 3.78 × 10⁻²⁰ | 1,358 | |
| Basion to nasion | 0.41 ± 0.048 | 0.29 | • | • | • | • | • | 0.28 | 0.43 | 1.71 × 10⁻²² | 1,368 |
| Sella to sphenoethmoidal junction | 0.44 ± 0.050 | 0.39 | • | • | 0.12 | 0.49 | 1.65 × 10⁻²³ | 1,381 | |||
| Posterior condylion to S-N | 0.47 ± 0.049 | 0.45 | • | • | 0.03 | 0.52 | 4.03 × 10⁻²⁸ | 1,376 | |||
| Sella to PNS | 0.47 ± 0.048 | 0.34 | • | • | • | • | • | 0.28 | 0.38 | 9.01 − 10−29 | 1,365 |
| Sella to nasion | 0.55 ± 0.045 | 0.40 | • | • | • | • | • | 0.27 | 0.33 | 2.85 × 10−37 | 1,376 |
Significant covariates are indicated with a •.
= Heritability estimate for trait after accounting for effect of covariates; i.e., residual heritability; ; heritability estimate expressed as the proportion of the total variance; ; proportion of variance explained by environmental (nongenetic) effects; c2 = proportion variation of a trait explained by significant covariates.
h0: h2 = 0.
Maxillary and Mandibular Traits
Similarly to basicranial traits, in maxillary and mandibular traits are also moderate (Table 5). Among maxillary traits, distances from upper incisors to nasion-point A line and between posterior nasal spine and point A are the lowest in this group (0.27 and 0.28, respectively). Distances from basion to point A (), nasion to posterior nasal spine (), and nasion to point A () exhibit comparable moderate values, as does upper incisor protrusion (). Mandibular traits exhibit a nearly identical range of values (Table 5). The lowest value is associated with lower incisor extrusion (), in contrast to lower incisor protrusion (). The majority of traits related to mandibular size exhibit a range of moderate heritabilities (0.29–0.44), including distances from articulare to gonion (), basion to articulare (), articulare to menton (), articulare to point B (), mandibular corpus length (), and cranial length (). The highest values in this component are observed for the distance between gonion and menton (), and posterior facial height ().
TABLE 5.
Heritability estimates (±SE) and covariate effects for maxillary and mandibular traits
| Covariates |
|||||||||||
|---|---|---|---|---|---|---|---|---|---|---|---|
| Trait | Age | Sex | Age × sex | Age2 | Age2 × sex | c2 | P* | N | |||
| Maxillary traits | |||||||||||
| Upper incisor to N-Pt. A | 0.27 ± 0.055 | 0.27 | 0.00 | 0.73 | 8.25 × 10⁻⁹ | 1,212 | |||||
| Posterior nasal spine to point A | 0.28 ± 0.052 | 0.21 | • | • | • | • | • | 0.25 | 0.54 | 7.76 × 10⁻¹¹ | 1,361 |
| Basion to point A | 0.39 ± 0.051 | 0.30 | • | • | • | • | • | 0.21 | 0.49 | 9.29 × 10⁻²² | 1,369 |
| Upper incisor protrusion (A1-APog) | 0.41 ± 0.055 | 0.40 | • | • | 0.02 | 0.58 | 1.83 × 10⁻¹⁸ | 1,209 | |||
| Nasion to PNS | 0.44 ± 0.049 | 0.30 | • | • | • | • | • | 0.31 | 0.39 | 1.22 × 10⁻²⁴ | 1,360 |
| Nasion to Pt. A | 0.44 ± 0.050 | 0.30 | • | • | • | • | • | 0.33 | 0.37 | 2.10 × 10⁻²⁴ | 1,373 |
| Mandibular traits | |||||||||||
| Lower incisor extrusion | 0.26 ± 0.054 | 0.25 | • | • | 0.03 | 0.72 | 6.33 × 10⁻⁹ | 1,272 | |||
| Articulare to gonion | 0.29 ± 0.046 | 0.19 | • | • | • | • | • | 0.33 | 0.48 | 1.21 × 10⁻¹³ | 1,362 |
| Basion to articulare | 0.30 ± 0.052 | 0.30 | • | • | • | 0.01 | 0.69 | 4.36 × 10⁻¹² | 1,369 | ||
| Articulare to menton | 0.33 ± 0.048 | 0.20 | • | • | • | • | • | 0.41 | 0.39 | 3.51 × 10⁻¹⁶ | 1,361 |
| Articulare to Pt. B | 0.33 ± 0.049 | 0.21 | • | • | • | • | • | 0.35 | 0.44 | 4.38 × 10⁻¹⁶ | 1,375 |
| Corpus length | 0.34 ± 0.051 | 0.26 | • | • | • | • | • | 0.25 | 0.49 | 3.22 × 10⁻¹⁶ | 1,380 |
| Cranial length | 0.38 ± 0.047 | 0.30 | • | • | • | • | • | 0.22 | 0.48 | 2.34 × 10⁻²⁰ | 1,376 |
| Lower incisor protrusion | 0.39 ± 0.053 | 0.39 | • | • | • | 0.01 | 0.60 | 8.97 × 10⁻¹⁸ | 1,262 | ||
| Gonion to menton | 0.40 ± 0.053 | 0.33 | • | • | • | • | • | 0.18 | 0.49 | 3.26 × 10⁻¹⁹ | 1,362 |
| Posterior facial height | 0.44 ± 0.048 | 0.31 | • | • | • | • | • | 0.29 | 0.40 | 4.89 × 10⁻²⁶ | 1,362 |
Significant covariates are indicated with a •
= Heritability estimate for trait after accounting for effect of covariates; i.e., residual heritability; ; heritability estimate expressed as the proportion of the total variance; ; proportion of variance explained by environmental (nongenetic) effects; c2 = proportion variation of a trait explained by significant covariates.
h0: h2 = 0.
Facial Traits
Heritabilities of facial traits range from the lowest observed to almost the highest observed heritability values in the entire sample (Table 6). On the low end of the range are traits describing positional relationships between teeth, such as molar and canine relations (0.10 and 0.20, respectively), overjet (), overbite (), upper molar position () and the distance from the occlusal plane to the ramus (). Remaining traits, including the distance from sella to point A (), facial convexity (or the distance from pogonion to nasion-point A line, ), and distances from lower incisor to nasion-basion line (), and from pogonion to sella-nasion line (), and to nasion-basion line () exhibit moderate to fairly strong heritabilities.
TABLE 6.
Heritability estimates (±SE) and covariate effects for facial traits
| Covariates |
|||||||||||
|---|---|---|---|---|---|---|---|---|---|---|---|
| Trait | Age | Sex | Age × sex | Age2 | Age2 × sex | c2 | P* | N | |||
| Molar relation | 0.10 ± 0.055 | 0.10 | • | 0.006 | 0.89 | 2.24 × 10⁻² | 1,003 | ||||
| Canine relation | 0.20 ± 0.049 | 0.18 | • | • | • | • | • | 0.11 | 0.71 | 1.50 × 10⁻⁶ | 1,381 |
| Overjet | 0.25 ± 0.053 | 0.25 | 0.00 | 0.75 | 7.94 × 10⁻⁹ | 1,216 | |||||
| Overbite | 0.27 ± 0.059 | 0.27 | 0.00 | 0.73 | 2.81 × 10⁻⁸ | 1,216 | |||||
| Occlusal plane to ramus | 0.33 ± 0.051 | 0.31 | • | • | • | 0.06 | 0.63 | 8.68 × 10⁻¹⁵ | 1,381 | ||
| Upper molar position | 0.33 ± 0.057 | 0.28 | • | • | • | 0.16 | 0.56 | 7.55 × 10⁻¹² | 1,039 | ||
| Sella to point A | 0.38 ± 0.052 | 0.25 | • | • | • | • | • | 0.34 | 0.41 | 6.84 × 10⁻¹⁸ | 1,377 |
| Convexity | 0.47 ± 0.053 | 0.46 | • | • | • | • | 0.02 | 0.52 | 9.29 × 10⁻²⁶ | 1,365 | |
| Lower incisor to N-B | 0.48 ± 0.054 | 0.47 | • | • | 0.02 | 0.51 | 5.91 × 10⁻²⁴ | 1,267 | |||
| Pogonion to S-N | 0.50 ± 0.054 | 0.45 | • | • | • | • | 0.10 | 0.45 | 2.50 × 10⁻²⁵ | 1,368 | |
| Pogonion to N-B | 0.59 ± 0.049 | 0.55 | • | • | 0.06 | 0.39 | 1.27 × 10−38 | 1,368 | |||
Significant covariates are indicated with a •
= Heritability estimate for trait after accounting for effect of covariates; i.e., residual heritability; ; heritability estimate expressed as the proportion of the total variance; ; proportion of variance explained by environmental (nongenetic) effects; c2 = proportion variation of a trait explained by significant covariates.
h0: h2 = 0.
Neurocranial Traits
Neurocranial traits in this study include a series of distances between sella and 13 points along the endocranial margin of the cranial vault (Table 7). Each of these traits exhibits fairly strong values (0.47–0.57). The lowest heritabilities in this component are observed among a number of anatomically more posterior distances, including S-X150 (), S-X160 (), S-X170 (), S-X130 and S-X140 (both ), although the highest value is observed in the most posterior linear distance from sella, S-X180 (). This is followed by S-X60, S-X80 and S-X110 (all ), then S-X70 and S-X100 (both ), and S-X90 and S-X120 (both ).
TABLE 7.
Heritability estimates (±SE) and covariate effects for neurocranial traits
| Covariates |
|||||||||||
|---|---|---|---|---|---|---|---|---|---|---|---|
| Trait | Age | Sex | Age × sex | Age2 | Age2 × sex | c2 | P* | N | |||
| S to X60 | 0.56 ± 0.045 | 0.44 | • | • | • | 0.21 | 0.35 | 4.02 × 10−42 | 1,351 | ||
| S to X70 | 0.55 ± 0.044 | 0.45 | • | • | 0.18 | 0.37 | 1.07 × 10−41 | 1,351 | |||
| S to X80 | 0.56 ± 0.044 | 0.47 | • | • | 0.15 | 0.38 | 2.25 × 10−42 | 1,351 | |||
| S to X90 | 0.54 ± 0.045 | 0.47 | • | • | 0.13 | 0.40 | 1.46 × 10−38 | 1,351 | |||
| S to X100 | 0.55 ± 0.045 | 0.47 | • | • | 0.14 | 0.39 | 8.24 × 10−41 | 1,351 | |||
| S to X110 | 0.56 ± 0.044 | 0.48 | • | • | 0.15 | 0.37 | 9.95 × 10−43 | 1,351 | |||
| S to X120 | 0.54 ± 0.044 | 0.45 | • | • | • | 0.16 | 0.39 | 6.86 × 10−41 | 1,351 | ||
| S to X130 | 0.53 ± 0.044 | 0.45 | • | • | • | 0.15 | 0.40 | 3.05 × 10−41 | 1,351 | ||
| S to X140 | 0.53 ± 0.045 | 0.47 | • | • | • | 0.12 | 0.41 | 8.78 × 10−40 | 1,351 | ||
| S to X150 | 0.47 ± 0.046 | 0.43 | • | • | • | 0.09 | 0.48 | 4.07 × 10⁻³³ | 1,351 | ||
| S to X160 | 0.48 ± 0.047 | 0.43 | • | • | 0.11 | 0.46 | 3.84 × 10⁻³¹ | 1,351 | |||
| S to X170 | 0.49 ± 0.049 | 0.42 | • | • | • | 0.15 | 0.43 | 1.31 × 10⁻²⁹ | 1,351 | ||
| S to X180 | 0.57 ± 0.050 | 0.47 | • | • | • | 0.19 | 0.34 | 2.62 × 10⁻³² | 1,351 | ||
Significant covariates are indicated with a •
= heritability estimate for trait after accounting for effect of covariates; i.e., residual heritability; ; heritability estimate expressed as the proportion of the total variance; ; proportion of variance explained by environmental (nongenetic) effects; c2 = proportion variation of a trait explained by significant covariates.
h0: h2 = 0.
Soft Tissue Traits
Soft tissue was observable on only a subset of radiographs and often required the use of one of the filters (e.g., inverse, or false color) available in Nemoceph. In total, soft tissue was observable for 519 individuals (38% of the total sample). From these, three linear and two angular soft tissue traits related to lip protrusion were included in the analyses, and were found to exhibit a relatively narrow range of moderate heritabilities (Table 8). Upper lip and lower lip protrusion exhibit slightly lower heritability (0.30 and 0.34, respectively) than the distance from lip embrasure to occlusal plane (). The two angular soft tissue traits, namely the lip protrusion angle and the upper lip to E-plane angle, exhibit the lowest and highest heritabilities (0.30 and 0.47, respectively), among soft tissue traits.
TABLE 8.
Heritability estimates (±SE) and covariate effects for soft tissue traits
| Covariates |
|||||||||||
|---|---|---|---|---|---|---|---|---|---|---|---|
| Trait | Age | Sex | Age × sex | Age2 | Age2 × sex | c2 | P* | N | |||
| Upper lip protrusion | 0.30 ± 0.120 | 0.20 | • | • | • | 0.34 | 0.46 | 3.34 × 10⁻³ | 519 | ||
| Lip protrusion (angle) | 0.30 ± 0.111 | 0.22 | • | • | • | 0.28 | 0.50 | 1.67 × 10⁻³ | 519 | ||
| Lower lip protrusion | 0.34 ± 0.109 | 0.23 | • | • | • | 0.32 | 0.45 | 4.22 × 10⁻⁴ | 519 | ||
| Lip embrasure to occlusal plane | 0.37 ± 0.107 | 0.29 | • | 0.22 | 0.49 | 1.38 × 10⁻⁴ | 519 | ||||
| Upper lip to E-plane (angle) | 0.47 ± 0.106 | 0.34 | • | • | • | 0.27 | 0.39 | 2.50 × 10⁻⁶ | 519 | ||
Significant covariates are indicated with a •.
= heritability estimate for trait after accounting for effect of covariates; i.e., residual heritability; ; heritability estimate expressed as the proportion of the total variance; ; proportion of variance explained by environmental (nongenetic) effects; c2 = proportion variation of a trait explained by significant covariates.
h0: h2 = 0.
Angular Traits
Angular traits have played an important role for years in both comparative anatomical, as well as clinical studies. Angular traits provide a simple and easy approach to assess geometric relationships between structures and, when measured from lateral cephalographs, will be unaffected by radiographic enlargement. Relative to linear traits, angular traits undergo relatively less change during postnatal growth (Nahhas et al., 2014). This is also reflected in absent or minimal covariate effects, which average about 3% for angular traits.
Heritabilities of 25 angular traits span a range of moderate heritabilities (Table 9). These angular traits belong to different craniofacial components identified above (basicranial, maxillary, mandibular, neurocranial, and facial). Neither high nor low heritabilities appear to be confined to a particular craniofacial component. The traits on the low end of moderate heritabilities include two maxillary traits, palatal plane () and maxillary depth (), as well as cranial deflection and ramus position (both ), which are basicranial and facial traits, respectively. Moderate heritabilities are observed for a number of facial traits, including lower incisor inclination (), facial depth angle and occlusal plane inclination (both ), interincisal and nasion-sella-posterior nasal spine angles (both ), sella-nasion-point B angle (), and sella-nasion-point D and sella-nasion-point A angles (, respectively). This range also includes two maxillary traits, namely point A-nasion-point B angle () and upper incisor inclination (), and two mandibular traits, mandibular plane angle and mandibular arc (both ). Relatively high heritabilities are exhibited by a number of facial angles, including facial axis, lower facial height, and facial taper (), as well as two mandibular (gonion-gnathion-sella angle, , and gonial angle, ) and one maxillary angular measure (maxillary height, ). The highest observed heritability in this entire sample of traits is recorded for an angle that spans facial and basicranial components, the nasion-sella-basion angle ().
TABLE 9.
Heritability estimates (±SE) and covariate effects for angular traits
| Covariates |
|||||||||||
|---|---|---|---|---|---|---|---|---|---|---|---|
| Trait | Age | Sex | Age × sex | Age2 | Age2 × sex | c2 | P* | N | |||
| Palatal plane | 0.26 ± 0.051 | 0.26 | • | 0.02 | 0.72 | 4.49 × 10⁻¹⁰ | 1,329 | ||||
| Cranial deflection | 0.27 ± 0.050 | 0.27 | • | • | • | 0.01 | 0.72 | 2.23 × 10⁻¹⁰ | 1,339 | ||
| Maxillary depth | 0.27 ± 0.048 | 0.26 | • | • | • | 0.02 | 0.72 | 1.90 × 10⁻¹¹ | 1,338 | ||
| Ramus position | 0.27 ± 0.051 | 0.26 | • | • | • | 0.05 | 0.69 | 1.43 × 10⁻¹⁰ | 1,346 | ||
| Lower incisor inclination | 0.31 ± 0.055 | 0.30 | • | • | • | 0.02 | 0.68 | 9.69 × 10⁻¹¹ | 1,261 | ||
| Facial depth angle | 0.33 ± 0.051 | 0.31 | • | • | • | 0.05 | 0.64 | 2.54 × 10⁻¹⁴ | 1,333 | ||
| Occlusal plane inclination | 0.33 ± 0.051 | 0.30 | • | • | • | 0.09 | 0.61 | 4.61 × 10⁻¹⁵ | 1,379 | ||
| Pt. A to nasion to Pt. B | 0.36 ± 0.052 | 0.35 | • | • | • | • | 0.02 | 0.63 | 1.81 × 10⁻¹⁷ | 1,371 | |
| Upper incisor inclination | 0.40 ± 0.055 | 0.40 | • | • | • | • | • | 0.01 | 0.59 | 5.75 × 10⁻¹⁷ | 1,208 |
| Interincisal angle | 0.42 ± 0.055 | 0.41 | • | • | • | • | • | 0.02 | 0.57 | 1.13 × 10⁻¹⁷ | 1,215 |
| Nasion to sella to posterior nasal spine | 0.42 ± 0.051 | 0.37 | • | • | 0.12 | 0.51 | 4.53 × 10⁻²¹ | 1,359 | |||
| Sella to nasion to Pt. B | 0.45 ± 0.052 | 0.43 | • | • | • | 0.04 | 0.53 | 1.64 × 10⁻²² | 1,374 | ||
| Mandibular plane angle | 0.45 ± 0.054 | 0.45 | • | • | 0.01 | 0.54 | 1.12 × 10⁻²² | 1,329 | |||
| Mandibular arc | 0.45 ± 0.049 | 0.44 | • | • | 0.03 | 0.53 | 8.32 × 10⁻²⁶ | 1,379 | |||
| Sella to nasion to Pt. D | 0.46 ± 0.051 | 0.43 | • | • | • | • | 0.06 | 0.51 | 8.44 × 10⁻²⁵ | 1,375 | |
| Sella to nasion to Pt. A | 0.47 ± 0.051 | 0.47 | • | 0.01 | 0.52 | 2.37 × 10⁻²⁶ | 1,372 | ||||
| Gonion-gnathion to sella-nasion | 0.52 ± 0.053 | 0.51 | • | 0.01 | 0.48 | 1.98 × 10⁻²⁸ | 1,353 | ||||
| Facial axis | 0.52 ± 0.054 | 0.52 | 0.00 | 0.48 | 9.43 × 10⁻²⁸ | 1,356 | |||||
| Maxillary height | 0.55 ± 0.050 | 0.53 | • | • | • | • | • | 0.04 | 0.43 | 1.55 × 10⁻³³ | 1,372 |
| Lower facial height | 0.56 ± 0.054 | 0.55 | • | • | • | • | 0.03 | 0.42 | 3.76 × 10⁻³² | 1,375 | |
| Gonial angle | 0.57 ± 0.055 | 0.57 | • | • | 0.01 | 0.42 | 4.74 × 10⁻³¹ | 1,361 | |||
| Facial taper | 0.57 ± 0.053 | 0.57 | 0.00 | 0.43 | 1.70 × 10⁻³³ | 1,347 | |||||
| Nasion to sella to basion | 0.60 ± 0.049 | 0.58 | • | • | 0.04 | 0.38 | 1.23 × 10−40 | 1,367 | |||
Significant covariates are indicated with a •.
= Heritability estimate for trait after accounting for effect of covariates; i.e., residual heritability; ; heritability estimate expressed as the proportion of the total variance; ; Proportion of variance explained by environmental (nongenetic) effects; c2 = proportion variation of a trait explained by significant covariates.
h0: h2 = 0.
DISCUSSION
The current study is the most comprehensive presentation of the heritability of traits spanning all functional/developmental components within the human craniofacial complex. As a part of our research program examining influences on morphological variation within the human craniofacial complex, these heritability estimates provide a means to quantify the extent of genetic influences on phenotypic variation. Implications of our findings span anatomical disciplines from interpretations of comparative anatomical or archaeologic populations, to consideration of traits for phylogenetic analyses, to informing future genome-wide approaches seeking to identify quantitative trait loci influencing variation in craniofacial traits.
The work presented complements previous work examining quantitative genetic analyses of craniofacial traits in non-human mammals. The majority of these studies have focused on mice (Cheverud et al., 1997; Leamy et al., 1999; Klingenberg and Leamy, 2001; Klingenberg et al., 2001; Workman et al., 2002) or two families of primates: Callitrichidae, represented by the saddle-back tamarin (Saguinus fuscicollis) (Cheverud, 1995), and Cercopithecidae, represented by the rhesus macaque (Macaca mulatta) (Cheverud and Buikstra, 1981a,b,; Cheverud, 1982; McGrath et al., 1984) and the baboon (Papio hamadryas ssp.) (Hlusko et al., 2002; Hlusko and Mahaney, 2003; Sherwood et al., 2008b).
In general, these animal-based studies also report a number of significant heritability estimates of low to moderate magnitude for craniofacial traits. The best known studies of nonhuman primates were conducted by Cheverud beginning with a study of macaque facial metrics (Cheverud, 1982). The sample available for this study was drawn from 297 positively identified individuals, resulting in 51 mother-offspring sets with a total of 134 mother-offspring pairs. Heritability estimates calculated using these mother-offspring pairs were moderate (average heritability estimate ~0.33). A similar study of craniofacial traits in tamarins (Cheverud, 1995) found heritabilities averaging 0.37, with a range of 0.04 to 0.94. While the number of related individuals (134 animals) was slightly less than in the macaque study, extended genealogies were available, so the heritabilities were calculated using a maximum-likelihood approach with pedigree data. With this methodology, the number of significant heritabilities increased to 67%. In a study of dental metrics using the pedigreed baboon colony at SNPRC, Hlusko et al. (Hlusko et al., 2002; Hlusko and Mahaney, 2003) report heritabilities ranging from 0.38 nerational, extended pedigrees. Some families include to 0.85 for dental metrics of baboons (Papio), with all three or more generations, hundreds of people and rela-heritabilities significant.
The studies discussed above utilized closely related individuals sharing a common environment, which may confound the ability to discern genetic influences from the influences of a shared immediate environment (Byard et al., 1984a). The Fels Longitudinal Study data, on the other hand, provide a unique combination of cephalometric and genetic information from multigenerational extended pedigrees. Some families include three or more generations, hundreds of people and relationships up to 9th degree. This allows for the inclusion of related individuals that do not necessarily share the same immediate environment, thus minimizing “household” effects. Large sample size and extended pedigrees provide greater power to detect significant heritabilities even when their overall effect on the phenotype is low, compared with studies that focused on craniofacial variation in parent-offspring or sibling pairs in either humans (Nakata et al., 1974; Byard et al., 1984a,b) or non-human primates (Cheverud and Buikstra, 1981a; Cheverud, 1982, 1996). Having a greater sample size and a larger number of traits under investigation lends further support to our earlier findings of consistently significant heritabilities in the human cranium (Sherwood et al., 2008a).
Covariate and Environmental Effects
As noted, we focused presentation of results on estimates of residual heritability as this is most commonly discussed in the literature. Tables 4 to 9 also present the percent the phenotypic variance explained by genetic factors before adjustment of covariate effects (i.e., total heritability), the percent of the phenotypic variance explained by the significant covariates, and the percent of the phenotypic variance explained by environmental (nongenetic) factors. In general, the range of heritability values, residual or total, is similar across craniofacial components but it is worthwhile to discuss factors that may impact heritability estimates.
Because the Fels Longitudinal Study was originally designed as a study of childhood growth, much of the radiograph database is composed of images taken during childhood, with some records extending into adulthood. To maximize the sample for analysis, we have included a range of ages across the lifespan as well as both sexes. As noted, we adjust for the effects of age and sex, and their interactions when estimating residual heritability and, for most variables, there was a significant covariate effect. Measures experiencing substantial growth during the age range represented have covariate effects exceeding 20%, with several exceeding 30%. Angular measures typically show a covariate effect of 5% or less. Within neurocranial measures, covariate effects are consistent and cluster around 15% (range 11%–21%). All neurocranial measures are based on distances from sella to the endocranial surface of the vault. Changes in these dimensions are likely heavily related to overall brain growth and, as a result, will largely parallel each other, resulting in the similarity of covariate effects across these measures.
Environmental, or nongenetic, effects on trait variance derive from a number of sources. Included in this category would be any statistical noise introduced by measurement error. When working with a radiograph collection spanning 50 years there is a number of potential sources of measurement error, starting with fluctuations in image quality. Accuracy of identification of individual craniometric points from radiographs will vary with image quality. Endocranial points such as basion or sella are more likely to be obscured in poorly exposed images than surface points, such as menton or nasion, because of the overlap of bone and soft tissue. Additionally, all linear measures are corrected for radiographic enlargement and, in order for accurate corrections, all points are treated as if they lie along the midplane of the skull. We have included some points common to orthodontic analyses, such as gonion, that are not on the midplane, but are still adjusted as such. Furthermore, points such as gonion, located on the mandibular ramus, or articulare, the visual intersection between the mandibular ramus and occiput, may be more influenced by slight rotations in the head during radiography than other points. These factors may all contribute to increasing environmental effects when present.
Phyletic Valence of Craniofacial Traits
Craniometric data are used extensively in reconstructing population histories and phylogeny of modern humans and fossil hominins (Collard and Wood, 2000; Wood and Lieberman, 2001; Strait and Grine, 2004; Harvati and Weaver, 2006b; Manica et al., 2007; Weaver et al., 2007; von Cramon-Taubadel and Lycett, 2008; Betti et al., 2009; von Cramon-Taubadel, 2009, 2011; von Cramon-Taubadel and Weaver, 2009; Harvati et al., 2010; von Cramon-Taubadel and Smith, 2012). It has been argued that among-population differences in craniofacial morphology in Homo sapiens generally match genetic distances based on neutral molecular data (Roseman, 2004; Roseman and Weaver, 2007; von Cramon-Taubadel and Weaver, 2009; Strauss and Hubbe, 2010). Given that craniofacial remains are well represented in the archaeological and paleoanthropological records, and often form the basis for systematic placement, the prospect of accurate reconstruction of hominin phylogeny based on craniometric data is very exciting. There is still debate, however, regarding which aspects of craniofacial morphology are most informative phylogenetically, and, thus, could be used preferentially in reconstructing evolutionary relationships within and among taxa.
Phylogenetic reconstructions will be most accurate when utilizing traits under greater genetic control, and, therefore, less susceptible to environmental influence. Several hypotheses have been put forward suggesting that traits from different craniofacial components, or derived from specific osteogenic precursors, are preferable in phylogenetic analyses. The idea that traits derived from endochondral precursors are under a stronger genetic control than those derived from intramembranous precursors has often been discussed (Lieberman et al., 1996, 2000a,b,; Wood and Lieberman, 2001). Herring (1993: 164) stated this most clearly when discussing the lack of functional studies of the basicranium, saying: “Because primary cartilage growth was for so long believed to be immutably determined by genetic factors, functional effects on the cranial base itself were not looked for.”
If the above were correct, heritability values for traits contained within the basicranium should routinely be of a greater magnitude than those for traits from other developmental components. In the current analysis of a modern human population, the pattern of heritabilities among different craniofacial regions does not support this contention, as basicranial measurements exhibit a range of heritabilities comparable to those from other craniofacial components. In fact, heritability estimates for neurocranial measurements are consistent across measures resulting in the highest average heritability within a component (average ). This is particularly interesting given that the neurocranium is often considered one of the more malleable cranial components, as seen in extreme applications of environmental influence such as head binding. Our results, therefore, do not support the hypothesis that the basicranium, and by extension endochondrally derived traits, are more highly or consistently heritable than other parts of the skull.
Our finding of the highest average heritability within the neurocranium provides a potential mechanism for the observed higher congruence between neurocranial measurements and genetic data based on matched morphological and molecular datasets. Several studies reported that relationships among populations reconstructed from the morphology of the cranial vault are a close match to the relationships reconstructed using molecular datasets (Harvati and Weaver, 2006a,b; von Cramon-Taubadel, 2011). Others, however, found that the temporal bone, or more generally the basicranium, and the upper face performed just as well or better in comparisons using matched datasets than did the cranial vault (Roseman, 2004; Harvati and Weaver, 2006a,b; von Cramon-Taubadel, 2009; Smith, 2009). This discrepancy could at least in part be due to the use of different samples and measurement protocols, as our data are derived from linear or angular cephalometric traits measured from lateral cephalograms of living subjects, whereas other studies used 3D landmark data from skeletonized cranial material subjected to sophisticated geometric morphometric analyses. Quantification of shape through such techniques can provide insight into the integration of complex morphology and we have begun to explore the application of these methods in quantitative genetic analysis of the craniofacial complex (Sherwood and McNulty, 2011). Future work will continue to explore these approaches.
Among hominoids, however, facial shape appears to be the aspect of craniofacial anatomy most successful in reconstructing molecular relationships (von Cramon-Taubadel and Smith, 2012). The observation that different traits may provide more accurate results in analyses conducted at the intra-specific level compared with higher taxonomic levels, such as Hominoidea, highlights the importance of conducting phylogenetic analyses using traits with the most reliable performance at the appropriate taxonomic level.
Our findings of moderately strong heritabilities in basicranial traits should not diminish their value in phylogenetic analyses. The anatomical complexity of certain basicranial regions, such as the temporal bone, allows for identification of numerous traits, metric and nonmetric, that have a proven utility in phylogenetic analyses (Harvati and Weaver, 2006a,b; Sherwood et al., 2002; Smith, 2009; von Cramon-Taubadel, 2009). Most of these traits are unobservable in a lateral cephalographs and, hence, are not included in the present analysis. The findings presented do support a general statement that traits from endochondrally derived bone are not necessarily the result of a greater degree of genetic influence than traits from intramembranously derived bone. We, therefore, emphasize the importance of evaluating traits used in phylogenetic analyses on a case-by-case basis.
Implications for Using Anatomical/Archaeological Collections
We have previously discussed the potential effects of examining traits with significant heritability in comparative museum collections. Museum collections of wild-caught social animals, such as primates, will frequently include closely related individuals although those relationships are infrequently documented. Analyses of variance in samples composed of closely related individuals will be biased towards an underestimate of actual population-level variation (Sherwood et al., 2008a; Sherwood and Duren, 2013) and an overestimate of population-level covariation.
In light of the current analysis demonstrating significant heritabilities across the components of the craniofacial complex, we would like to reiterate the importance of considering the history of acquisitions in anatomical collections and their suitability for the questions posed by individual research projects. For example, if research outcomes should be widely applicable to whole geographic populations, analyzing samples of skulls likely consisting of extended family members (e.g., from small local cemeteries or burial sites) may bias the outcomes by minimizing within-group variation and accentuating among-group differences. On the other hand, using such samples may be preferable if the outcomes should be applicable primarily to the same local populations. The extent of this bias would be more pronounced in traits that are highly heritable and/or those for which covariates (i.e., environmental proxies) explain a small proportion of phenotypic variance.
CONCLUSION
The current study provides a comprehensive overview of the heritabilities and a quantification of environmental factors influencing variation in a set of cephalometric traits spanning all functional/developmental components of the human craniofacial complex. There were no systematic differences in the magnitude of heritability estimates from the different craniofacial components in our sample, indicating similar levels of genetic influence on trait variation throughout the cranium, with the neurocranial traits exhibiting higher heritabilities, on average, than basicranial or facial traits. These findings provide a mechanism for the observed congruence between morphological and molecular datasets in humans and apes. Future work on humans and nonhuman primates will continue to disentangle the genetic and environmental influences on craniofacial trait variation, and contribute to our understanding of the evolutionary pathways and patterns underlying craniofacial variation in humans and our closest living relatives.
Supplementary Material
ACKNOWLEDGEMENTS
The authors are indebted to the participants of the Fels Longitudinal Study. In addition, the authors are grateful to those members of the research team of the Fels Longitudinal Study who established and maintained the craniofacial program, most notably Arthur Lewis, Stanley Garn, and Alex Roche. The authors express their sincere gratitude to Kimberly Lever, Rebecca Junker, and Joe Wagner for phenotyping and database assistance. The authors are also grateful to Michael C. Mahaney for his input and advice. The authors also thank Kieran McNulty, Leslea Hlusko, and the editor for comments and suggestions that have greatly improved this manuscript.
Grant sponsor: National Institutes of Health; Grant number: DE016692 and HD012252.
Footnotes
Additional Supporting Information may be found in the online version of this article.
LITERATURE CITED
- Almasy L, Blangero J. 1998. Multipoint quantitative-trait linkage analysis in general pedigrees. Am J Hum Genet 62:1198–1211. [DOI] [PMC free article] [PubMed] [Google Scholar]
- Arya R, Duggirala R, Comuzzie AG, Puppala S, Modem S, Busi BR, Crawford MH. 2002. Heritability of anthropometric phenotypes in caste populations of Visakhapatnam, India. Hum Biol 74:325–344. [DOI] [PubMed] [Google Scholar]
- Betti L, Balloux F, Amos W, Hanihara T, Manica A. 2009. Distance from Africa, not climate, explains within-population phenotypic diversity in humans. Proc R Soc B 276:809–814. [DOI] [PMC free article] [PubMed] [Google Scholar]
- Broadbent BH. 1931. A new X-ray technique and its application to orthodontia. Angle Orthod 1:45–66. [Google Scholar]
- Buschang PH, Baume RM, Nass GG. 1983. A craniofacial growth maturity gradient for males and females between 4 and 16 years of age. Am J Phys Anthropol 61:373–381. [DOI] [PubMed] [Google Scholar]
- Byard PJ, Lewis AB, Ohtsuki F, Siervogel RM, Roche AF. 1984a. Sibling correlations for cranial measurements from serial radiographs. J Craniofac Genet Dev Biol 4:265–269. [PubMed] [Google Scholar]
- Byard PJ, Poosha DV, Satyanarayana M, Rao DC. 1985a. Family resemblance for components of craniofacial size and shape. J Craniofac Genet Dev Biol 5:229–238. [PubMed] [Google Scholar]
- Byard PJ, Poosha DVR, Satyanarayana M, Rao DC, Russell JM. 1985b. Path analysis of family resemblance for cranio-facial traits in Andhra Pradesh nuclear families and twins. Ann Hum Biol 12: 305–314. [DOI] [PubMed] [Google Scholar]
- Byard PJ, Sharma K, Russell JM, Rao DC. 1984b. A family study of anthropometric traits in a Punjabi community: II. An investigation of familial transmission. Am J Phys Anthropol 64:97–104. [DOI] [PubMed] [Google Scholar]
- Cheverud JM. 1982. Phenotypic, genetic, and environmental morphological integration in the cranium. Evolution 36:499–516. [DOI] [PubMed] [Google Scholar]
- Cheverud JM. 1995. Morphological Integration in the Saddle-Back Tamarin (Saguinus fuscicollis) Cranium. Am Nat 145:63–89. [Google Scholar]
- Cheverud JM. 1996. Quantitative genetic analysis of cranial morphology in the cotton-top (Saguinus oedipus) and saddle-back (S. fuscicollis) tamarins. J Evol Biol 9:5–42. [Google Scholar]
- Cheverud JM, Buikstra JE. 1981a. Quantitative genetics of skeletal nonmetric traits in the rhesus macaques on Cayo Santiago. I. Single trait heritabilities. Am J Phys Anthropol 54:43–49. [DOI] [PubMed] [Google Scholar]
- Cheverud JM, Buikstra JE. 1981b. Quantitative genetics of skeletal nonmetric traits in the rhesus macaques on Cayo Santiago. II. Phenotypic, genetic, and environmental correlations between traits. Am J Phys Anthropol 54:51–58. [DOI] [PubMed] [Google Scholar]
- Cheverud JM, Buikstra JE. 1982. Quantitative genetics of skeletal nonmetric traits in the rhesus macaques of Cayo Santiago. III. Relative heritability of skeletal nonmetric and metric traits. Am J Phys Anthropol 59:151–155. [DOI] [PubMed] [Google Scholar]
- Cheverud JM, Routman EJ, Irschick DJ. 1997. Pleiotropic effects of individual gene loci on mandibular morphology. Evolution 51: 2006–2016. [DOI] [PubMed] [Google Scholar]
- Cohen MM. 2000. Craniofacial disorders caused by mutations in homeobox genes MSX1 and MSX2. J Craniofac Genet Dev Biol 20:19–25. [PubMed] [Google Scholar]
- Collard M, Wood B. 2000. How reliable are human phylogenetic hypotheses? Proc Natl Acad Sci USA 97:5003–5006. [DOI] [PMC free article] [PubMed] [Google Scholar]
- Daegling DJ, Hylander WL. 2000. Experimental observation, theoretical models, and biomechanical inference in the study of mandibular form. Am J Phys Anthropol 112:541–551. [DOI] [PubMed] [Google Scholar]
- Dechow PC, Hylander WL. 2000. Elastic properties and masticatory bone stress in the macaque mandible. Am J Phys Anthropol 112: 553–574. [DOI] [PubMed] [Google Scholar]
- Duren DL, Czerwinski SA, Sherwood RJ, Roche AF, Siervogel RM, Towne B. 2003. Quantitative genetics of the craniofacial complex in humans. Am J Phys Anthropol 120:91–92. [Google Scholar]
- Galton F 1876a. The history of twins, as a criterion of the relative powers of nature and nurture. J Anthropol Instit Great Britain Ireland 5:391–406. [Google Scholar]
- Galton F 1876b. A theory of heredity. J Anthropol Instit Great Britain Ireland 5:329–348. [Google Scholar]
- Galton F 1885. Types and their inheritance. Science 6:268–275. [DOI] [PubMed] [Google Scholar]
- Harvati K, Hublin J-J, Gunz P. 2010. Evolution of middle-late Pleistocene human cranio-facial form: a 3-D approach. J Hum Evol 59: 445–464. [DOI] [PubMed] [Google Scholar]
- Harvati K, Weaver TD. 2006a. Human cranial anatomy and the differential preservation of population history and climate signatures. Anat Rec A Discov Mol Cell Evol Biol 288A:1225–1233. [DOI] [PubMed] [Google Scholar]
- Harvati K, Weaver TD. 2006b. Reliability of cranial morphology in reconstructing Neanderthal phylogeny In: Hublin J-J, Harvati K, Harrison T, editors. Neanderthals revisited: new approaches and perspectives. Netherlands: Springer; p 239–254. [Google Scholar]
- Herring SW. 1993. Epigenetic and functional influences on skull growth In: The Skull. Volume 1: Development, Hanken Jand Hall BK, editors. Chicago: The University of Chicago Press, p. 153–206. [Google Scholar]
- Hlusko LJ, Mahaney MC. 2003. Genetic contributions to expression of the baboon cingular remnant. Arch Oral Biol 48:663–672. [DOI] [PubMed] [Google Scholar]
- Hlusko LJ, Weiss KM, Mahaney MC. 2002. Statistical genetic comparison of two techniques for assessing molar crown size in pedigreed baboons. Am J Phys Anthropol 117:182–189. [DOI] [PubMed] [Google Scholar]
- Hunter W 1990. Heredity in the craniofacial complex In: Enlow DH, Poston WR II, editors. Facial growth. Philadelphia: Saunders; p 249–266. [Google Scholar]
- Hylander WL. 1981. Patterns of stress and strain in the macaque mandible In: Carlson DS, editor. Craniofacial biology. Monograph # 10 Ann Arbor, MI: University of Michigan; p 1–37. [Google Scholar]
- Kimonis V, Gold JA, Hoffman TL, Panchal J, Boyadjiev SA. 2007. Genetics of craniosynostosis. Semin Pediatr Neurol 14:150–161. [DOI] [PubMed] [Google Scholar]
- Kitahara T, Ichinose M, Nakasima A. 1996. Quantitative evaluation of correlation of skull morphology in families in an attempt to predict growth change. Eur J Orthod 18:181–191. [DOI] [PubMed] [Google Scholar]
- Klingenberg CP, Leamy LJ. 2001. Quantitative genetics of geometric shape in the mouse mandible. Evolution 55:2342–2352. [DOI] [PubMed] [Google Scholar]
- Klingenberg CP, Leamy LJ, Routman EJ, Cheverud JM. 2001. Genetic architecture of mandible shape in mice: effects of quantitative trait loci analyzed by geometric morphometrics. Genetics 157:785–802. [DOI] [PMC free article] [PubMed] [Google Scholar]
- Leamy LJ, Routman EJ, Cheverud JM. 1999. Quantitative trait loci for early- and late-developing skull characters in mice: a test of the genetic independence model of morphological integration. Am Nat 153:201–214. [DOI] [PubMed] [Google Scholar]
- Lieberman DE, Pearson OM, Mowbray KM. 2000a. Basicranial influence on overall cranial shape. J Hum Evol 38:291–315. [DOI] [PubMed] [Google Scholar]
- Lieberman DE, Ross CF, Ravosa MJ. 2000b. The primate cranial base: ontogeny, function, and integration. Am J Phys Anthropol Suppl 31:117–169. [DOI] [PubMed] [Google Scholar]
- Lieberman DE, Wood BA, Pilbeam DR. 1996. Homoplasy and early Homo: an analysis of the evolutionary relationships of H. kahilis sensu stricto and H. rudolfensis. J Hum Evol 30:97–120. [Google Scholar]
- Lundström A 1954. The importance of genetic and nongenetic factors in the facial skeleton studied in 100 pairs of twins. Eur Orthod Soc Rep Congr 30:92–107. [Google Scholar]
- Lundström A, McWilliam J. 1988. Comparison of some cephalometric distances and corresponding facial proportions with regard to heritability. Eur J Orthod 10:27–29. [DOI] [PubMed] [Google Scholar]
- Lundström A, McWilliam JS. 1987. A comparison of vertical and horizontal cephalometric variables with regard to heritability. Eur J Orthod 9:104–108. [DOI] [PubMed] [Google Scholar]
- Manica A, Amos W, Balloux F, Hanihara T. 2007. The effect of ancient population bottlenecks on human phenotypic variation. Nature 448:346–348. [DOI] [PMC free article] [PubMed] [Google Scholar]
- McGrath JW, Cheverud JM, Buikstra JE. 1984. Genetic correlations between sides and heritability of asymmetry for nonmetric traits in rhesus macaques on Cayo Santiago. Am J Phys Anthropol 64: 401–411. [DOI] [PubMed] [Google Scholar]
- Merow WW, Broadbent BH Jr. 1990. Cephalometries In: Enlow DH, editor. Facial growth. Philadelphia, PA: W.B. Saunders Co. p 346–395. [Google Scholar]
- Nahhas RW, Valiathan M Sherwood RJ. 2014. Variation in timing, duration, intensity, and direction of adolescent growth in the mandible, maxilla, and cranial base: the Fels longitudinal study. Anat Rec 297:1195–1207. [DOI] [PMC free article] [PubMed] [Google Scholar]
- Nakata M, Yu P-L, Davis B, Nance WE. 1974. Genetic determinants of cranio-facial morphology: a twin study. Ann Hum Genet 37: 431–443. [DOI] [PubMed] [Google Scholar]
- Poosha DV, Byard PJ, Satyanarayana M, Rice JP, Rao DC. 1984. Family resemblance for cranio-facial measurements in Velanti Brahmins from Andhra Pradesh, India. Am J Phys Anthropol 65: 15–22. [DOI] [PubMed] [Google Scholar]
- Ravosa MJ, Noble VE, Hylander WL, Johnson KR, Kowalski EM. 2000. Masticatory stress, orbital orientation and the evolution of the primate postorbital bar. J Hum Evol 38:667–693. [DOI] [PubMed] [Google Scholar]
- Roche AF. 1992. Growth, maturation and body composition The Fels Longitudinal Study 1929-1991. Cambridge University Press, Cambridge. [Google Scholar]
- Roseman CC. 2004. Detecting interregionally diversifying natural selection on modern human cranial form by using matched molecular and morphometric data. Proc Natl Acad Sci USA 101:12824–12829. [DOI] [PMC free article] [PubMed] [Google Scholar]
- Roseman CC, Weaver TD. 2007. Molecules versus morphology? Not for the human cranium. Bioessays 29:1185–1188. [DOI] [PubMed] [Google Scholar]
- Sharma K, Byard PJ, Russell JM, Rao DC. 1984. A family study of anthropometric traits in a Punjabi community: I. Introduction and familial correlations. Am J Phys Anthropol 63:389–395. [DOI] [PubMed] [Google Scholar]
- Sherwood RJ, Duren DL. 2013. The genetics of morphology In: Begun DR, editor. A companion to paleoanthropology. Malden, MA: Wiley-Blackwell; p 306–320. [Google Scholar]
- Sherwood RJ, Duren DL, Czerwinski SA, Blangero J, Towne B. 2003. Quantitative genetics of modern human craniofacial variation: implications for the interpretation of the hominin fossil record. Am J Phys Anthropol 120(S36):190. [Google Scholar]
- Sherwood RJ, Duren DL, Demerath EW, Czerwinski SA, Siervogel RM, Towne B. 2008a. Quantitative genetics of modern human cranial variation. J Hum Evol 54:909–914. [DOI] [PMC free article] [PubMed] [Google Scholar]
- Sherwood RJ, Duren DL, Havill LM, Rogers J, Cox LA, Towne B, Mahaney MC. 2008b. A genomewide linkage scan for quantitative trait loci influencing the craniofacial complex in baboons (Papio hamadryas spp.). Genetics 180:619–628. [DOI] [PMC free article] [PubMed] [Google Scholar]
- Sherwood RJ, Duren DL, Mahaney MC, Blangero J, Dyer TD, Cole SA, Czerwinski SA, Chumlea WMC, Siervogel RM, Choh AC, Nahhas RW, Lee M Towne B. 2011. A genome-wide linkage scan for quantitative trait loci influencing the craniofacial complex in humans (Homo sapiens sapiens). Anat Rec 294:664–675. [DOI] [PMC free article] [PubMed] [Google Scholar]
- Sherwood RJ, McNulty KP. 2011. Dissecting the genetic architecture of craniofacial shape In: Lestrel PE, editor. Biological shape analysis: proceedings of the 1st International Symposium. Singapore: World Scientific; p 145–171. [Google Scholar]
- Sherwood RJ, Ward SC, Hill A. 2002. The taxonomic status of the Chemeron temporal (KNM-BC 1). J Hum Evol 42:153–184. [DOI] [PubMed] [Google Scholar]
- Smith HF. 2009. Which cranial regions reflect molecular distances reliably in humans? Evidence from three-dimensional morphology. Am J Hum Biol 21:36–47. [DOI] [PubMed] [Google Scholar]
- Strait DS, Grine FE. 2004. Inferring hominoid and early hominid phylogeny using craniodental characters: the role of fossil taxa. J Hum Evol 47:399–452. [DOI] [PubMed] [Google Scholar]
- Strauss A, Hubbe M. 2010. Craniometric similarities within and between human populations in comparison with neutral genetic data. Hum Biol 82:315–330. [DOI] [PubMed] [Google Scholar]
- Vieira AR. 2008. Unraveling human cleft lip and palate research. J Dent Res 87:119–125. [DOI] [PubMed] [Google Scholar]
- Vieira AR, McHenry TG, Daack-Hirsch S, Murray JC, Marazita ML. 2008a. Candidate gene/loci studies in cleft lip/palate and dental anomalies finds novel susceptibility genes for clefts. Genet Med 10:668–674. [DOI] [PMC free article] [PubMed] [Google Scholar]
- Vieira AR, McHenry TG, Daack-Hirsch S, Murray JC, Marazita ML. 2008b. A genome wide linkage scan for cleft lip and palate and dental anomalies. Am J Med Genet A 146:1406–1413. [DOI] [PMC free article] [PubMed] [Google Scholar]
- von Cramon-Taubadel N 2009. Congruence of individual cranial bone morphology and neutral molecular affinity patterns in modern humans. Am J Phys Anthropol 140:205–215. [DOI] [PubMed] [Google Scholar]
- von Cramon-Taubadel N 2011. The relative efficacy of functional and developmental cranial modules for reconstructing global human population history. Am J Phys Anthropol 146:83–93. [DOI] [PubMed] [Google Scholar]
- von Cramon-Taubadel N, Lycett SJ. 2008. Brief Communication: human cranial variation fits iterative founder effect model with African origin. Am J Phys Anthropol 136:108–113. [DOI] [PubMed] [Google Scholar]
- von Cramon-Taubadel N, Smith HF. 2012. The relative congruence of cranial and genetic estimates of hominoid taxon relationships: implications for the reconstruction of hominin phylogeny. J Hum Evol 62:640–653. [DOI] [PubMed] [Google Scholar]
- von Cramon-Taubadel N, Weaver TD. 2009. Insights from a quantitative genetic approach to human morphological evolution. Evol Anthropol 18:237–240. [Google Scholar]
- Weaver TD, Roseman CC, Stringer CB. 2007. Were neandertal and modern human cranial differences produced by natural selection or genetic drift? J Hum Evol 53:135–145. [DOI] [PubMed] [Google Scholar]
- Wilkie AO, Slaney SF, Oldridge M, Poole MD, Ashworth GJ, Hockley AD, Hayward RD, David DJ, Pulleyn LJ Rutland P. 1995. Apert syndrome results from localized mutations ofFGFR2 and is allelic with Crouzon syndrome.[comment]. Nat Genet 9:165–172. [DOI] [PubMed] [Google Scholar]
- Wood B, Lieberman DE. 2001. Craniodental variation in Paranthropus boisei: a developmental and functional perspective. Am J Phys Anthropol 116:13–25. [DOI] [PubMed] [Google Scholar]
- Workman MS, Leamy LJ, Routman EJ, Cheverud JM. 2002. Analysis of quantitative trait locus effects on the size and shape of mandibular molars in mice. Genetics 160:1573–1586. [DOI] [PMC free article] [PubMed] [Google Scholar]
- Wylie WL. 1944. A quantitative method for comparison of craniofacial patterns in different individuals: its application to a study of parents and offspring. Am J Anat 74:39–45. [Google Scholar]
- Zeiger JS, Beaty TH, Hetmanski JB, Wang H, Scott AF, Kasch L, Raymond G, Jabs EW, VanderKolk C. 2002. Genetic and environmental risk factors for sagittal craniosynostosis. J Craniofac Surg 13:602–606. [DOI] [PubMed] [Google Scholar]
Associated Data
This section collects any data citations, data availability statements, or supplementary materials included in this article.