Abstract
Objective:
Endothelial cells form vascular beds in all organs and are exposed to a range of mechanical forces that regulate cellular phenotype. We sought to determine the role of endothelial luminal surface stiffness in tissue-specific mechanotransduction of laminar shear stress in microvascular mouse cells and the role of arachidonic acid in mediating this response.
Methods:
Microvascular mouse endothelial cells were subjected to laminar shear stress at 4 dynes/cm2 for 12 hours in parallel plate flow chambers that enabled real- time optical microscopy and atomic force microscopy measurements of cell stiffness.
Results:
Lung endothelial cells aligned parallel to flow, while cardiac endothelial cells did not. This rapid alignment was accompanied by increased cell stiffness. The addition of arachidonic acid to cardiac endothelial cells increased alignment and stiffness in response to shear stress. Inhibition of arachidonic acid in lung endothelial cells and embryonic stem cell-derived endothelial cells prevented cellular alignment and decreased cell stiffness.
Conclusions:
Our findings suggest that increased endothelial luminal surface stiffness in microvascular cells may facilitate mechanotransduction and alignment in response to laminar shear stress. Furthermore, the arachidonic acid pathway may mediate this tissue-specific process. An improved understanding of this response will aid in the treatment of organ-specific vascular disease.
Keywords: atomic force microscopy, cellular heterogeneity, hemodynamics, mechanotransduction, vascular biology
1 |. INTRODUCTION
ECs from different organs are exposed to a wide range of extracellular biomechanical forces in vivo, such as shear stress, that regulate cellular phenotype.1–4 Furthermore, differential expression of integrins in tissue-specific ECs regulates vascular mechanotransduction.5,6 For example, the heart is a highly contractile organ with several endothelial compartments, including coronary arteries, endocardium, and capillaries. In contrast, ECs of the lung are exposed to a dual circulation of the pulmonary vasculature and the bronchial circulation.7 This cellular heterogeneity can lead to unique mechanical properties for each cell type. The differences between tissue-specific ECs have been reported in vivo; however, this study aimed to determine how shear stress modulates tissue-specific changes in cell stiffness and the effect this has on cell alignment.
The mechanical properties of ECs identify four separate compartments: glycocalyx, cell cortex, cytoplasm, and nucleus.8 ELS, which is comprised of the glycocalyx and cell cortex, is responsible for transmitting biomechanical forces and has been shown to remodel with application of shear forces.9 The role of endothelial glycocalyx as a mechanotransducer of fluid shear stress has been studied recently.10,11 Glycocalyx has been shown to facilitate EC response to flow and glycocalyx itself is modulated by shear stress.12 Recently, we have demonstrated that stiffness of the cell cortex transmits these nanoscale forces and varies as a result of cell alignment. This cortical stiffness is determined by the arrangement of actin microfilaments, which are anchored to the plasma membrane and tethered to the extracellular matrix, enabling them to transmit these forces.
In addition to cellular remodeling, mechanotransduction of shear stress forces converts biophysical signals to chemical signals. One model of flow induced-signal transduction indicates that arachidonic acid is produced by shear stress, causing stimulation of pro-hematopoietic target genes, resulting in the synthesis and release of prostaglandin E2.13 Indeed, the addition of arachidonic acid to ECs has been shown to alter cell phenotype and regulate proliferation, inflammation, and migration.14 To investigate the effects of arachidonic acid on tissue-specific mechanotransduction, hydrocortisone was used to inhibit arachidonic acid, as previously reported.15
Various studies have shown that shear stress modulates human EC gene expression,16,17 induces human EC elongation and alignment with the direction of flow,18 and alters the mechanical properties of human ECs.19 However, there has been relatively little information on the effects of prolonged laminar shear stress on tissue-specific microvascular mouse ECs.
In this study, we show that mouse adult cardiac ECs, adult lung ECs, and ESC-ECs exhibit tissue-specific changes in the ELS stiffness in response to laminar shear stresses in vitro, which regulate cellular alignment. Our findings also suggest that arachidonic acid plays an important role in regulating this response.
2 |. MATERIALS AND METHODS
2.1 |. Cell culture
ECs were isolated from different vascular beds and then transfected with the E4ORF1 of the Ad E4 gene complex to support long-term EC survival. The E4ORF1 of the Ad E4 gene complex was previously shown to support long-term EC survival in the absence of serum and cytokines without cellular transformation.20 Sustained phosphorylation of Akt is critical for the survival of functional primary ECs that carry AdE4ORF137 vectors. Primary microvascular mouse E4 ECs derived from heart and lung as well as ESC-ECs were obtained from Angiocrine Bioscience (San Diego, CA) and used between passages 8 and 10. The procedure for obtaining ESC-ECs was reported previously.21 These cells were double stained with both VE-cadherin and isolectin gs-ib4 from simplicifolia. This form of isolectin has been shown to be specific to microvascular ECs when compared to arterial and venous ECs. Cells were thawed and grown in 0.1% gelatin (EMD Millipore, Billerica, MA) coated polystyrene flasks (Corning Life Sciences, Tewksbury, MA). Cells were then expanded in a humidified Heracell 150i incubator (Thermo Scientific, Waltham, MA) with 5% CO2, 5% O2 in Iscove’s DMEM/Ham’s F12 (Corning) supplemented with 20% heat inactivated fetal bovine serum (Hyclone, Logan, Utah), endothelial mitogen (Alfa Aesar, Tewksbury, MA), heparin (Sigma-Aldrich, St. Louis, MO), HEPES buffer (Gibco, Grand Island, NY), MEM nonessential amino acids (Corning Life Sciences), and an antibiotic/antimycotic (Mediatech, Manassas, VA). About 5% O2 has been reported to provide more physiological conditions for mouse and human ECs from various tissues.21,22
2.2 |. Treatment with arachidonic acid and hydrocortisone
For select experiments, cardiac ECs were placed in media for 3 hours after cell attachment and then stimulated with 50 μmol/L arachidonic acid (Sigma-Aldrich). Lung ECs and ESC-ECs were placed in media for 3 hours after cell attachment and then inhibited with 200 nmol/L hydrocortisone (Sigma-Aldrich) for the duration of the experiment.
2.3 |. Flow cytometry
Monoclonal antibodies recognizing CD31 (PE-Cy7-conjugated) and CD144 (APC-conjugated) were used for flow cytometric analysis (data not shown). All antibodies were purchased from BD Biosciences. Analysis was performed using a BD FACSVerse flow cytometer (BD Biosciences, San Jose, CA).
2.4 |. Shear stress experiments
Mouse ECs derived from heart and lung, as well as ESC-ECs, were subjected to laminar stress of 4 dynes/cm2 for 12 hours, as approximated using numerical models in vivo. The magnitude of shear stress was calculated using a derivation of the Navier-Stokes equations, fluid flow rate, and chamber dimensions (Table 1), and by estimating the local velocity gradient along a cross-sectional area of a vessel.23 Higher shear stresses were attempted (8–20 dynes/cm2), but this resulted in cell detachment and subsequently cell death.
TABLE 1.
Parameters used in each parallel plate flow system
| Width | Length | Height | Flow Rate | τ = 6μQ/bh2 | |
|---|---|---|---|---|---|
| Custom Chamber | 25 mm | 75 mm | 0.13 mm | 2000uL/min | 4 dynes/cm2 |
| BioFlux 200 | 0.35 mm | 1.4 mm | 0.07 mm | 1.17uL/min | 4 dynes/cm2,a |
Values for dimensions and shear stress in BioFlux 200 provided by Fluxion.
ECs were subjected to fluid shear stress using two different parallel plate flow systems: a Bioflux 200 (Fluxion Biosciences, San Francisco, CA) and a custom parallel plate flow chamber.24 Confocal images from the Bioflux 200 were used to assess cell orientation. Immunofluorescence images and AFM measurements were taken of cells in the custom parallel plate flow chamber. Fluid shear stress for these systems was calculated as a function of volumetric flow rate Q, fluid, viscosity, μ, the width of the chamber, b, and the height of the channel, h, as previously described.24 The values used for each parallel plate flow system are listed in Table 1. The channels were designed with a high aspect ratio (width to height) to ensure a low Reynolds number at maximum flow rate and therefore laminar flow.
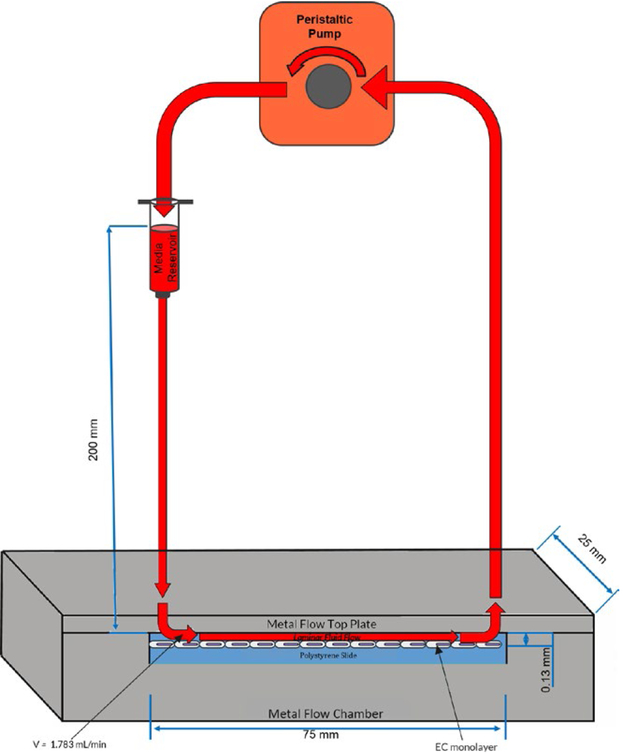
The inlet of the custom parallel plate flow chamber was connected to a 10 mL syringe reservoir filled with 5 mL of media. A peristaltic pump (CorSolutions, Ithaca, NY) was then attached to the chamber such that the inlet of the pump was connected to the outlet of the chamber (Figure 1). The parallel plate flow chamber and the Bioflux 200 systems were maintained at 5% CO2, 5% O2 and the channels were coated with 0.5% fibronectin (BD Biosciences, Bedford, MA). Cells were seeded at a density of 500 000 cells/ mL and cultured in endothelial growth medium supplemented with 20% FBS. The Bioflux 200 system was fixed onto a microscope stage maintained at 37° C, and cells were imaged by phase contrast microscopy with a 10 × objective lens at 3-minute intervals during application of shear stress (N = 3). Afterward, cells were stained for VE-cadherin (goat IgG mouse VE-cadherin primary, anti-goat NL637 secondary, R&D Systems, Minneapolis, MN) and actin (conjugated phalloidin fluorescein isothiocyanate, Sigma-Aldrich). ECs seeded on polystyrene slides were also subjected to similar fluid shear stresses using the custom parallel plate flow chamber (N = 3), which allowed direct contact with the cells for atomic force microscopy measurements (N = 3). Following shear application, cells were fixed with 4% paraformaldehyde (Sigma-Aldrich) for 10 minutes at room temperature, which modified cellular stiffness in a fashion that maintained the relative stiffness between samples (data not shown). As a control, ECs were also cultured under static conditions in all systems.
FIGURE 1.
Schematic of the overall setup for the custom parallel plate flow system. Components include a 2-piece metal parallel plate chamber containing a polystyrene slide seeded with a monolayer of ECs, a gravity fed syringe media reservoir, and a peristaltic pump. Arrows indicate the direction of fluid flow. Figure not drawn to scale
2.5 |. Actin and cell orientation
The actin orientation was evaluated for every pixel of 63 × magnification actin images (N = 5) using the imageJ plugin OrientationJ (Daniel Sage, Biomedical Image Group, Switzerland).25 The cell orientation was also measured for every pixel of 10 × magnification phase contrast images (N = 5) using OrientationJ. A histogram of orientations was built by taking into account the pixel coherency and energy.
2.6 |. Cell size and aspect ratio
Phase contrast images and immunofluorescence images of VE-cadherin were used to manually measure the area and aspect ratio of each cell type using imageJ (N = 10 cells). Cell outline masks were generated by hand using immunofluorescence images of VE-cadherin, and the presence of each cell was confirmed with DAPI nuclei counterstaining. Aspect ratio was calculated as the longest dimension of the cell (length) divided by the cell width.
2.7 |. Atomic force microscopy
A MFP-3D-Bio AFM (Asylum Research, Santa Barbara) was used for all AFM measurements. Changes were made to our previously described protocol,24 to optimize measurements of the ELS in mouse ECs. For all AFM measurements, each force curve indented a distance of 250 nm after contact at a rate of 4 μm/s. Separate force curves on a 32 × 32 grid spanning 90 × 90 μm over several cells were collected to a 200pN trigger point, and the Hertz model was applied to the first 100 nm of indentation through the Asylum Research software. Given that all three cell types were similar in height, a single AFM protocol was used. Curves were manually inspected for goodness of fit and contact point was adjusted as needed. Bad fits were discarded from the analysis. Stiffness measurements were taken with a TR400PB, silicon nitride tip, with a height of 3 μm and a semi-included angle of 35° (k = 0.02 N/m). The comparison of live and fixed ECs was performed on BD Falcon Petri dishes (BD Biosciences, San Jose, CA).
2.8 |. Statistical analysis
To determine significance in changes in cell stiffness when ECs were exposed to shear stress, a Dunn’s test and a Wilcoxon Rank Sum test were used to determine if stiffness changes between two populations (control and subjected to shear stress) for a given experiment. It is important to note that nonparametric statistical analysis methods are necessary as all populations for all experiments are not Gaussian (Pearson’s chi-squared test, α = .05, P < .05). R-squared (R2) values were calculated between cell stiffness, orientation, and actin structure for all three cell types. This helped determine what fraction of the changes in cell stiffness were due to changes in orientation and what fraction were due to actin structure. All other statistical analysis was performed using a paired t test (α = .05).
3 |. RESULTS
3.1 |. Maintenance of endothelial phenotype
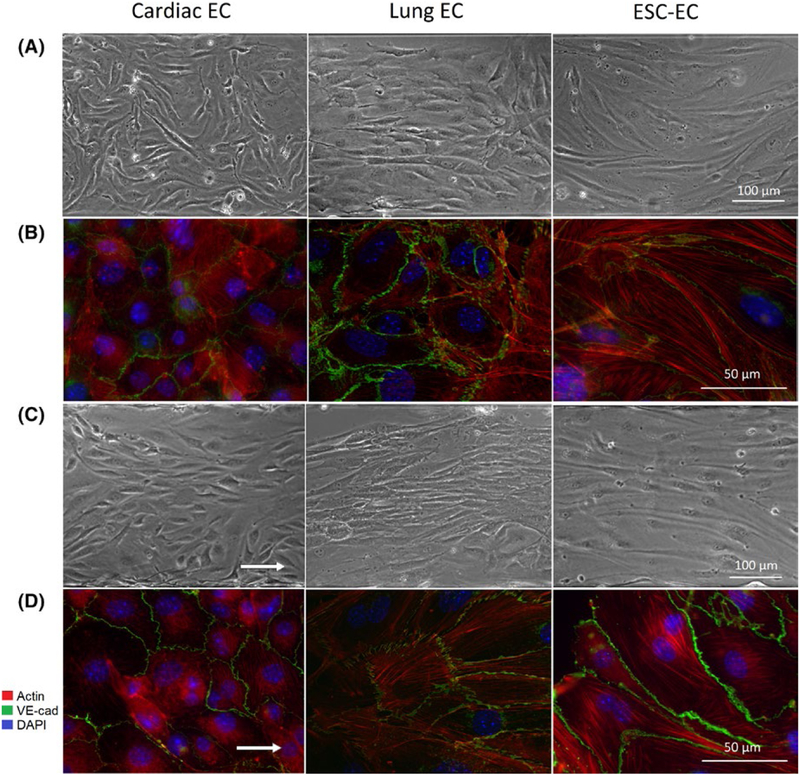
Upon isolation from their respective vascular bed, our primary microvascular mouse ECs were authenticated using immunostaining and flow cytometry. Cell populations remained 99% positive for mouse CD31 and VE-cadherin when expanded in vitro up to passage 12. When exposed to shear stress, tissue-specific ECs and ESC-ECs both remained at least 93% positive for CD31 (data not shown). Cardiac and lung ECs displayed a spindly morphology when cultured in static conditions. In contrast, ESC-ECs were much more elongated (Figure 2A). Interestingly, all ECs exhibited modest amounts of heterogeneity in morphology within each cell type.
FIGURE 2.
Role of laminar shear stress on cell morphology and actin structure. A, Representative phase contrast images at 10 × magnification of cardiac ECs, lung ECs, and ESC-ECs cultured in static conditions. B, Representative fluorescent images illustrating VE-cadherin (green), actin (red), and DAPI counterstain (blue) at 63 × magnification for ECs cultured in static conditions. C, Representative phase contrast images at 10 × magnification of cardiac, lung, and ESC-ECs exposed to shear stress. D, Representative fluorescent images of ECs exposed to shear stress, with VE-cadherin, actin, and DAPI counterstain at 63 × magnification. White arrows indicate the direction of flow
3.2 |. Effects of shear stress on EC orientation
Application of fluid shear stress in the Bioflux 200 had a noticeable impact on the overall morphology of each cell type. Sheared lung ECs and ESC-EC aligned in the direction of fluid flow, but sheared cardiac ECs did not change in orientation (Figure 2C).
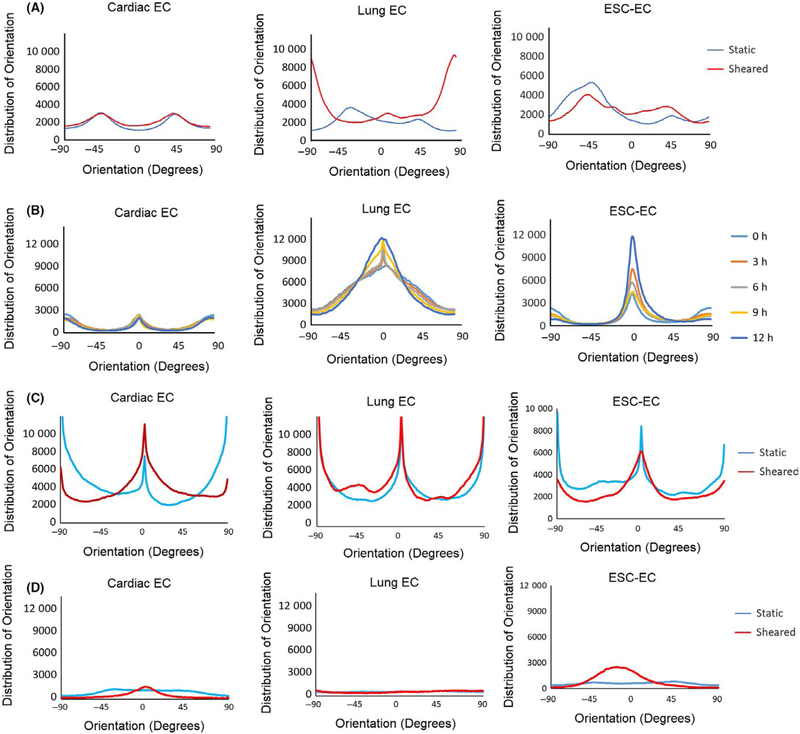
Time-lapse images of ECs exposed to shear stress illustrated moderate temporal heterogeneity between cell types. Cardiac ECs showed almost no change in orientation at each 3-hour time point during application of shear. Lung ECs and ESC-ECs gradually aligned in the direction of fluid flow over time, yet each cell type exhibited a unique orientation profile (Figure 4B). Lung ECs had a much broader distribution of orientations in the direction of fluid flow than ESC-ECs.
FIGURE 4.
Cell and actin alignment in reponses to laminar shear stress. Distribution of (A) actin orientation and (B) cell alignment at multiple time points in cardiac ECs, lung ECs, and ESC-ECs. Distribution of (C) actin orientation and (D) cell alignment in cardiac ECs treated with arachidonic acid, and lung ECs and ESC-ECs treated with hydrocortisone. 0 degrees denotes orientation parallel to fluid flow
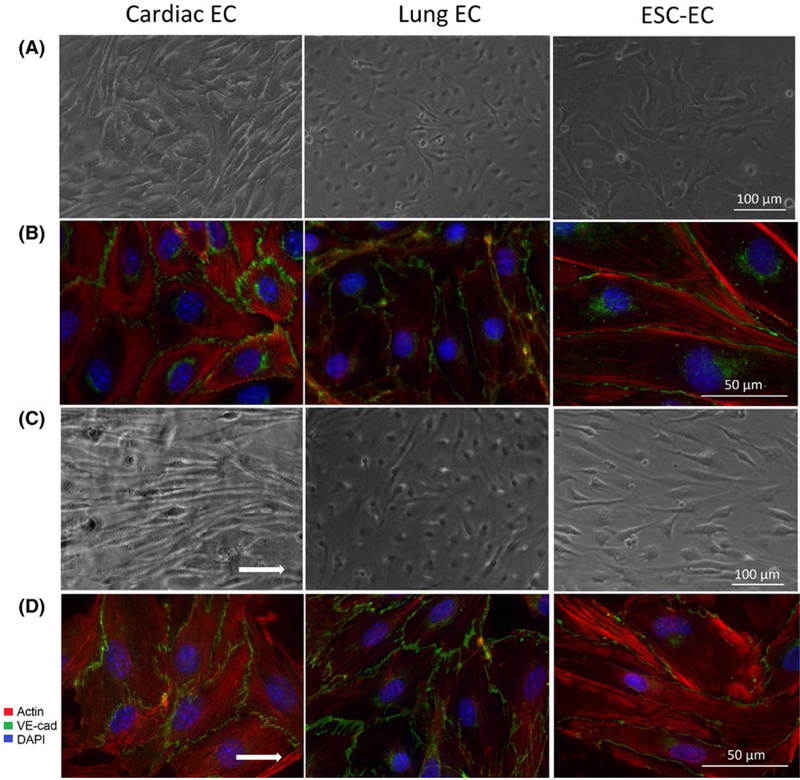
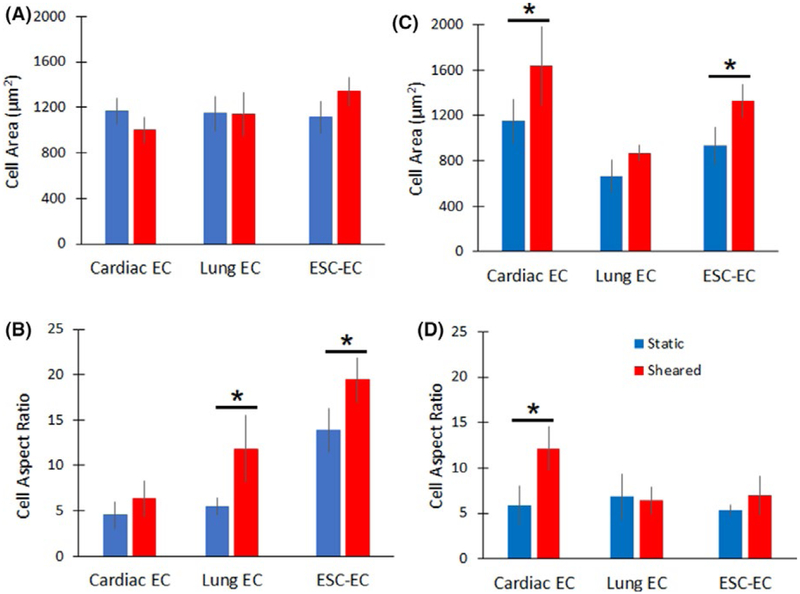
The addition of arachidonic acid to cardiac ECs during application of shear stress (Figureure 3C) resulted in increased cell alignment (Figure 4D). Conversely, treatment of lung ECs and ESC-ECs with hydrocortisone resulted in significantly decreased cell alignment in response to shear stress, a 30.7% and 43.1% increase in cell area.
FIGURE 3.
Role of arachidonic acid pathway in mediating cell response to laminar shear stress. Representative phase contrast images at 10 × magnification of ECs cultured in (A) static conditions and (C) with shear stress. Representative fluorescent images illustrating VE-cadherin (green), actin (red), and DAPI counterstain (blue) at 63 × magnification for ECs cultured in (B) static conditions and (D) with shear stress. Cardiac ECs were treated with arachidonic acid, whereas lung ECs and ESC-ECs were treated with hydrocortisone.
3.3 |. Effects of shear stress on actin structure
Exposure of mouse ECs to shear stress in the custom parallel plate flow chamber had a significant effect on the actin cytoskeleton of each cell type. Actin did not always align because of cell alignment (Figure 2B,D). Actin analysis shows an even distribution of actin in all directions for all three cell types when cultured in static conditions. Actin filaments in lung ECs were oriented perpendicular to the direction of fluid flow (90 degrees), while actin filaments in cardiac ECs and ESC-ECs did not respond to shear stress (Figure 4A). Furthermore, actin analysis showed a similar distribution of actin orientation for all three cell types treated with either arachidonic acid or hydrocortisone with and without application of fluid flow (Figure 4C).
3.4 |. Effects of shear stress on cell size and aspect ratio
Phase contrast microscopy confirmed that all three cell types were similar in size (Figure 5), ranging between 1000 and 1400 μm2. When exposed to shear stress, lung ECs showed no significant changes in cell size. However, cardiac ECs decreased in size by 14% and ESC ECs increased in size by 20% (Figure 5A). ECs cultured under static conditions had aspect ratios ranging from 1.8 to 13.8 (Figure 5B). When exposed to shear stress, lung ECs and ESC-ECs significantly increased in aspect ratio by 235% and 115%, respectively. In contrast, cardiac ECs showed no significant change in aspect ratio after exposure to shear stress. The addition of arachidonic acid to cardiac ECs during application of shear stress (Figure 3C,D) resulted in a 77.8% increase in cell area and a 105.1% increase in aspect ratio (Figure 5C,D). Conversely, treatment of lung ECs and ESC-ECs with hydrocortisone resulted in a 30.7% and 43.1% increase in cell area, and a 5.9% decrease and 30.2% increase in aspect ratio, respectively.
FIGURE 5.
Quantification of cell size and aspect ratio. (A) Cell size and (B) aspect ratio were measured in ECs exposed to laminar shear stress. (C) Cell size and (D) aspect ratio for cardiac ECs treated with arachidonic acid, and lung ECs and ESC-ECs treated with hydrocortisone, with and without application of shear stress. Error bars represent SD. * Indicates statistically significant difference (P < .05)
3.5 |. Effects of shear stress on EC mechanical properties
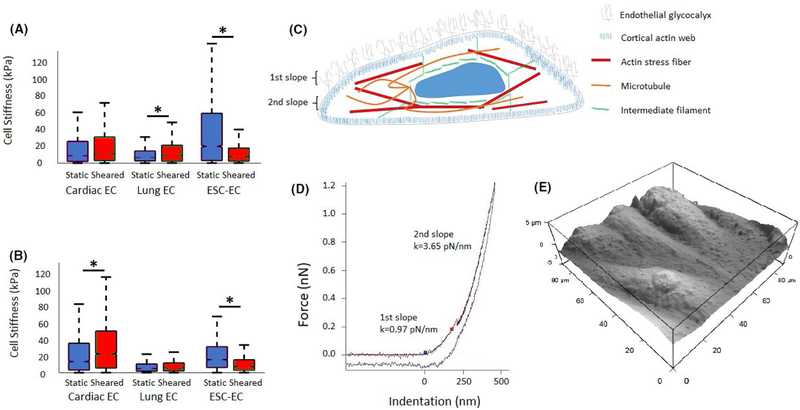
AFM measurements also revealed significant differences in median cell stiffness between tissue-specific and ESC-ECs (Figure 6A,B). Cell stiffness changes were analyzed for all three cell types in question (N = 3) using the statistical analysis methods described in the methods section. Generally, cardiac ECs showed no statistically significant changes in cell stiffness in response to application of shear stress (P > .05). Lung EC experiments yielded a statistically significant increase of 34.68% (P < .001) with application of shear stress. Conversely, ESC-ECs responded to shear stress application with a statistically significant decrease of 60.19% (P < .001).
FIGURE 6.
Laminar shear stress regulates endothelial cell stiffness. A, Boxplot of AFM cell stiffness measurements of cardiac ECs, lung ECs, and ESC-ECs with and without application of shear stress. B, Boxplot of AFM cell stiffness measurements of cardiac ECs treated with arachidonic acid, and lung ECs and ESC-ECs treated with hydrocortisone, with and without application of shear stress. Error bars represent SD.* Indicates statistically significant difference (P < .001). C, Schematic diagram indicating the glycocalyx and cytoskeletal layers detectable by atomic force microscopy. D, AFM force curve indicating the different stiffness values corresponding with the glycocalyx and cytoskeletal layers. E, Representative AFM image of mouse ECs exposed to shear stress
Application of shear stress to cardiac ECs treated with arachidonic acid yielded a statistically significant increase in cell stiffness of 67.61% (Figure 6B). Application of shear stress to lung ECs treated with hydrocortisone showed no statistically significant change in cell stiffness (P > .05). Application of shear stress to ESC-ECs treated with hydrocortisone significantly decreased cell stiffness by 51.59% (P < .001).
It is important to note that cardiac ECs treated with arachidonic acid (Figure 3A,B) showed an overall increase of median cell stiffness (Figure 6A,B) when compared to untreated ECs (14.0 vs 9.6 kPa). Meanwhile, treated lung ECs and ESC-ECs showed an overall decrease in cell stiffness when compared to untreated ECs (5.5 vs 7.3 kPa and 16.4 vs. 21.1 kPa, respectively).
A direct comparison of live and fixed cardiac ECs revealed an increase in stiffness with 4% paraformaldehyde fixation from 1.8 kPa to 4.8 kPa. Fixation of lung ECs also resulted in an increase in stiffness compared to live cells (0.9 kPa vs 4.0 kPa). In addition, AFM measurements of average cell height showed that cardiac ECs ranged between 4.0 and 4.8 μm, lung ECs between 3.8 and 5.5 μm, and ESC-ECs between 4.0 and 5.9 μm. There was no significant correlation between cell height, application of shear stress, and treatment with either arachidonic acid or hydrocortisone.
4 |. DISCUSSION
There has been relatively little information on the effects of prolonged laminar shear stress on microvascular mouse ECs. Groups have previously reported applying shear stress to mouse ECs ranging from 0.7 to 7.1 dynes/cm2 for 6 hours to study the regulation of VCAM-1.26,27 Our group initially exposed mouse ECs to laminar shear stresses ranging from 4 to 20 dynes/cm2 for 12 hours using a parallel plate flow chamber. Others have reported that many shear stress-responsive genes in human ECs return to basal levels after a 7-day exposure to flow and that this regulation by flow is cell type specific.28 When we exposed mouse ECs to shear stress for up to 48 hours, we observed no additional changes in cell phenotypes. Additionally, exposure of mouse ECs to shear stresses higher than 4 dynes/cm2 resulted in cell detachment within a few minutes and subsequently cell death. Human ECs are typically exposed to shear stresses greater than 4 dynes/cm2, but there is little evidence supporting that microvascular mouse ECs can survive those conditions in vitro. This may be a result of in vitro conditions that do not provide sufficiently strong cell adhesion through integrin receptor-ligand binding seen in vivo.29
We report that rapid tissue-specific mouse EC alignment in response to fluid shear stress is mediated by ELS stiffness. When exposed to shear stress, adult lung ECs were the only cell type that experienced an increase in stiffness and aligned in the direction of fluid flow. Changes in lung EC stiffness correlated strongly with changes in cell orientation (R2 = 0.92) and poorly with actin structure (R2 = 0.03). In contrast, adult cardiac ECs showed no change in cell stiffness or cell alignment in response to fluid flow. Human brain microvascular ECs have also previously been shown to resist elongation and alignment after 36 and 72-hour exposure to shear stress ranging from 0 to 16 dynes/cm2.30 Interestingly, cardiac ECs increased in stiffness in response to fluid flow in the presence of arachidonic acid. This change in stiffness correlated poorly with changes in cell orientation (R2 = 0.06) and strongly with changes in actin structure (R2 = 0.90). This suggests that remodeling of the EC may be a mechanotransductory response to fluid shear stress. In addition, ESC-ECs actually decreased in stiffness, possibly because these embryonic-derived cells have never experienced the same mechanical cues as adult ECs in vivo. It is unclear if this change in stiffness was due to changes in cell orientation or actin structure as it correlated poorly with both (R2 = 0.18 and R2 = 0.25, respectively). These differences in microenvironments, such as the presence of blood flow, may guide structural and chemical changes in the cell in response to shear stress in vitro. It is important to note that our reported mouse paraformaldehyde fixed EC stiffness ranged between 2 and 22 kPa. In contrast, other literature had previously reported live human ECs with significantly lower stiffness, in the range of 1–3 kPa.31
Many groups have stressed the importance of making AFM measurements of live cells; however, fixation can improve the reliability of AFM measurements. Although our cell stiffness measurements are increased by paraformaldehyde, the changes we report are relative values. Literature reports a nonlinear increase in cell stiffness shortly after fixation with increasing concentrations of glutaralde-hyde.32,33 Our findings indicate that fixation with 4% paraformaldehyde also increases the stiffness of cardiac and lung ECs. It is also important to note that the Hertz indentation model is only valid for very small deformations of purely elastic materials. Our three cell types were similar in height and sufficiently tall such that the 100 nm indentation is considered a very small deformation, thus allowing the Hertz indentation model to be valid (Figure 6E). Given that cells and their cytoskeleton are viscoelastic, with stiffness that depends on the time scale of measurements, the time scale of AFM indentation was kept constant using the same indentation velocity for all force curves.
The glycocalyx facilitates the EC response to flow and shear stress modulates the structure of glycocalyx itself.12 Removal of the glycocalyx prevents cell alignment under flow and in turn, flow can lead to redistribution of the glycocalyx. Furthermore, mechanical stiffness of the glycocalyx structure may reduce shear gradients to which the cell is exposed.12 Multiple models describe the loading of core EC proteins when subjected to fluid shear stress.34,35 These models propose that the bush-like structure of the glycocalyx communicates these forces and deformations to the underlying cortical skeleton, resulting in cytoskeletal actin reorganization (Figure 6C,D). In this study, shear stress appears to alter the mechanical properties of the ELS, which can alter how these forces are communicated to each cell type.
Actin is a major determinant of the mechanical properties of the cell cortex, which stabilizes the cell and helps transmit extracellular forces. Actin structures in lung ECs appear to remodel in response to fluid flow and cellular alignment. However, actin structures in cardiac ECs and ESC-ECs did not change significantly when exposed to shear stress. This actin alignment in lung ECs may result from the biomechanical differences between organ microenvironments and contribute to lung ECs’ ability to align with shear stress. Tissue stiffness varies with each organ and dictates development and homeostasis.36 In turn, this may require different cellular actin structures to transmit biomechanical forces in each vascular bed, resulting in differences in cell stiffness.
4.1 |. Arachidonic acid modulates endothelial luminal surface stiffness
One model of flow induced-signal transduction indicates that arachidonic acid is produced by wall shear stress stimulation of pro-hematopoietic target genes.13 The addition of arachidonic acid to ECs has previously been shown to alter cell phenotype14 and hydro-cortisone has been reported to inhibit arachidonic acid.15 We found that the addition of arachidonic acid significantly increased cellular stiffness and promoted cardiac EC alignment. Meanwhile, inhibition with hydrocortisone drastically reduced lung EC and ESC-EC cell stiffness and alignment after shear stress (Figure 4).
The addition of arachidonic acid to cardiac ECs resulted in a significant increase in cell stiffness in response to shear stress, as well as an overall increase in stiffness when compared to untreated cells. It also resulted in significant cell alignment in the direction of fluid flow. Inhibition of arachidonic acid with hydrocortisone reduced lung EC and ESC-EC cell stiffness compared to untreated cells and prevented cellular alignment in response to shear stress. This suggests that arachidonic acid helps regulate cell stiffness and subsequently its ability to mediate cellular alignment in response to fluid flow.
The addition of arachidonic acid or hydrocortisone does not appear to influence actin remodeling during fluid flow. Actin structures remained unchanged when treated cells were exposed to shear stress. However, the addition of hydrocortisone did appear to have a significant effect on the cell morphology of lung ECs and ESC-ECs. Lung ECs had a noticeably smaller size and aspect ratio. ESC-ECs appeared less elongated and more spindly. Numerous studies have shown that hydrocortisone reduces cell migration, cell growth, and the secretion of pro-inflammatory cytokines and stabilizes the glycocalyx.37,38 These effects may be responsible for our observed changes in cell morphology. It is too early to predict which specific cell compartment is responsible for the observed changes in endothelial luminal surface stiffness in different tissue vascular beds. Our study highlights the importance of tissue-specific changes to cell stiffness and alignment in response to shear stress hence improving our quantitative understanding of mechanotransduction.
5 |. PERSPECTIVE
In this study, increases in the luminal surface stiffness of adult microvascular ECs appear to enable cellular alignment in response to shear stress. Furthermore, the arachidonic acid pathway appears to mediate this tissue-specific response in cardiac ECs, lung ECs, and ESC-ECs. This suggests that tissue-specific changes in the mechanical properties of the glycocalyx and/or cell cortex enable mechanotransduction of fluid flow forces.
ACKNOWLEDGMENTS
This work has been supported, in part, by grants from the National Heart, Lung, and Blood Institute R01HL119872. We are grateful to Mr. Navid Paknejad for assistance with AFM and critical review of the manuscript.
Funding information
National Heart, Lung, and Blood Institute, Grant/Award Number: R01HL119872
Abbreviations:
- AFM
atomic force microscopy
- DAPI
4’,6’-diamidino-2-phenylindole, dihydrochloride
- EC
endothelial cell
- ELS
endothelial luminal surface
- ESC-EC
embryonic stem cell-derived endothelial cells
- FBS
fetal bovine serum
- MEM
minimum essential medium
REFERENCES
- 1.Gimbrone MA. The Gordon Wilson lecture. Understanding vascular endothelium: a pilgrim’s progress. Endothelial dysfunction, biomechanical forces and the pathobiology of atherosclerosis. Trans Am Clin Climatol Assoc. 2010;121:115–127. [PMC free article] [PubMed] [Google Scholar]
- 2.Turner RR, Beckstead JH, Warnke RA, Wood GS. Endothelial cell phenotypic diversity. In situ demonstration of immunologic and enzymatic heterogeneity that correlates with specific morphologic subtypes. Am J Clin Pathol. 1987;87:569–575. [DOI] [PubMed] [Google Scholar]
- 3.Page C, Rose M, Yacoub M, Pigott R. Antigenic heterogeneity of vascular endothelium. Am J Pathol. 1992;141:673–683. [PMC free article] [PubMed] [Google Scholar]
- 4.Wilson HK, Canfield SG, Shusta EV, Palecek SP. Concise review: tissue-specific microvascular endothelial cells derived from human pluripotent stem cells. Stem Cells. 2014;32:3037–3045. [DOI] [PMC free article] [PubMed] [Google Scholar]
- 5.Merna N, Fung KM, Wang JJ, et al. Differential beta3 integrin expression regulates the response of human lung and cardiac fibro-blasts to extracellular matrix and its components. Tissue Eng Part A. 2015;21:2195–2205. [DOI] [PMC free article] [PubMed] [Google Scholar]
- 6.Martinez-Lemus LA, Sun Z, Trache A, Trzciakowski JP, Meininger GA. Integrins and regulation of the microcirculation: from arterioles to molecular studies using atomic force microscopy. Microcirculation. 2005;12:99–112. [DOI] [PubMed] [Google Scholar]
- 7.Aird WC. Phenotypic heterogeneity of the endothelium: II. Representative vascular beds. Circ Res. 2007;100:174–190. [DOI] [PubMed] [Google Scholar]
- 8.Fels J, Jeggle P, Liashkovich I, Peters W, Oberleithner H. Nanomechanics of vascular endothelium. Cell Tissue Res. 2014;355: 727–737. [DOI] [PMC free article] [PubMed] [Google Scholar]
- 9.Dahl KN, Kalinowski A, Pekkan K. Mechanobiology and the micro-circulation: cellular, nuclear and fluid mechanics. Microcirculation. 2010;17:179–191. [DOI] [PMC free article] [PubMed] [Google Scholar]
- 10.Peters W, Drueppel V, Kusche-Vihrog K, Schubert C, Oberleithner H. Nanomechanics and sodium permeability of endothelial surface layer modulated by hawthorn extract WS 1442. PLoS ONE. 2012;7:e29972. [DOI] [PMC free article] [PubMed] [Google Scholar]
- 11.Thi MM, Tarbell JM, Weinbaum S, Spray DC. The role of the glycocalyx in reorganization of the actin cytoskeleton under fluid shear stress: a “bumper-car” model. Proc Natl Acad Sci USA. 2004; 101:16483–16488. [DOI] [PMC free article] [PubMed] [Google Scholar]
- 12.Yao Y, Rabodzey A, Dewey CF Jr. Glycocalyx modulates the motility and proliferative response of vascular endothelium to fluid shear stress. Am J Physiol Heart Circ Physiol. 2007;293:H1023–H1030. [DOI] [PubMed] [Google Scholar]
- 13.Traver D Going with the flow: how shear stress signals the emergence of adult hematopoiesis. J Exp Med. 2015;212:600. [DOI] [PMC free article] [PubMed] [Google Scholar]
- 14.Bogatcheva NV, Sergeeva MG, Dudek SM, Verin AD. Arachidonic acid cascade in endothelial pathobiology. Microvasc Res. 2005;69:107–127. [DOI] [PubMed] [Google Scholar]
- 15.Hong SL, Levine L. Inhibition of arachidonic acid release from cells as the biochemical action of anti-inflammatory corticosteroids. Proc Natl Acad Sci USA. 1976;73:1730–1734. [DOI] [PMC free article] [PubMed] [Google Scholar]
- 16.Chen BP, Li YS, Zhao Y, et al. DNA microarray analysis of gene expression in endothelial cells in response to 24-h shear stress. Physiol Genomics. 2001;7:55–63. [DOI] [PubMed] [Google Scholar]
- 17.García-Cardeña G, Comander J, Anderson KR, Blackman BR, Gimbrone MA. Biomechanical activation of vascular endothelium as a determinant of its functional phenotype. Proc Natl Acad Sci USA. 2001;98:4478–4485. [DOI] [PMC free article] [PubMed] [Google Scholar]
- 18.Dewey CF, Bussolari SR, Gimbrone MA, Davies PF. The dynamic response of vascular endothelial cells to fluid shear stress. J Biomech Eng. 1981;103:177–185. [DOI] [PubMed] [Google Scholar]
- 19.Sato M, Nagayama K, Kataoka N, Sasaki M, Hane K. Local mechanical properties measured by atomic force microscopy for cultured bovine endothelial cells exposed to shear stress. J Biomech. 2000;33:127–135. [DOI] [PubMed] [Google Scholar]
- 20.Seandel M, Butler JM, Kobayashi H, et al. Generation of a functional and durable vascular niche by the adenoviral E4ORF1 gene. Proc Natl Acad Sci USA. 2008;105:19288–19293. [DOI] [PMC free article] [PubMed] [Google Scholar]
- 21.Nolan DJ, Ginsberg M, Israely E, et al. Molecular signatures of tissue-specific microvascular endothelial cell heterogeneity in organ maintenance and regeneration. Dev Cell. 2013;26:204–219. [DOI] [PMC free article] [PubMed] [Google Scholar]
- 22.Antonova LV, Matveeva VG, Chernova MN, Velikanova EA, Ponasenko AV, Golovkin AS. Proliferative and secretory activity of human umbilical vein endothelial cells cultured under varying degrees of hypoxia. Tsitologiia. 2014;56:67–76. [PubMed] [Google Scholar]
- 23.Papaioannou TG, Stefanadis C. Vascular wall shear stress: basic principles and methods. Hellenic J Cardiol. 2005;46:9–15. [PubMed] [Google Scholar]
- 24.Wong AK, LLanos P, Boroda N, Rosenberg SR, Rabbany SY. A parallel-plate flow chamber for mechanical characterization of endothelial cells exposed to laminar shear stress. Cell Mol Bioeng. 2015;9:127–138. [DOI] [PMC free article] [PubMed] [Google Scholar]
- 25.Rezakhaniha R, Agianniotis A, Schrauwen JTC, et al. Experimental investigation of collagen waviness and orientation in the arterial adventitia using confocal laser scanning microscopy. Biomech Model Mechanobiol. 2012;11:461–473. [DOI] [PubMed] [Google Scholar]
- 26.Ando J, Tsuboi H, Korenaga R, et al. Shear stress inhibits adhesion of cultured mouse endothelial cells to lymphocytes by downregulating VCAM-1 expression. Am J Physiol. 1994;267:C679–C687. [DOI] [PubMed] [Google Scholar]
- 27.Korenaga R, Ando J, Kosaki K, Isshiki M, Takada Y, Kamiya A. Negative transcriptional regulation of the VCAM-1 gene by fluid shear stress in murine endothelial cells. Am J Physiol. 1997; 273:C1506–C1515. [DOI] [PubMed] [Google Scholar]
- 28.Dekker RJ, van Soest S, Fontijn RD, et al. Prolonged fluid shear stress induces a distinct set of endothelial cell genes, most specifically lung Kruppel-like factor (KLF2). Blood. 2002; 100:1689–1698. [DOI] [PubMed] [Google Scholar]
- 29.Selhuber-Unkel C, Erdmann T, Lopez-Garcia M, Kessler H, Schwarz US, Spatz JP. Cell adhesion strength is controlled by intermolecular spacing of adhesion receptors. Biophys J. 2010;98:543–551. [DOI] [PMC free article] [PubMed] [Google Scholar]
- 30.Reinitz A, DeStefano J, Ye M, Wong AD, Searson PC. Human brain microvascular endothelial cells resist elongation due to shear stress. Microvasc Res. 2015;99:8–18. [DOI] [PMC free article] [PubMed] [Google Scholar]
- 31.Jalali S, Tafazzoli-Shadpour M, Haghighipour N, Omidvar R, Safshekan F. Regulation of endothelial cell adherence and elastic modulus by substrate stiffness. Cell Commun Adhes. 2015;22:79–89. [DOI] [PubMed] [Google Scholar]
- 32.Hoh JH, Schoenenberger CA. Surface morphology and mechanical properties of MDCK monolayers by atomic force microscopy. J Cell Sci. 1994;107:1105–1114. [DOI] [PubMed] [Google Scholar]
- 33.Hutter JL, Chen J, Wan WK, Uniyal S, Leabu M, Chan BMC. Atomic force microscopy investigation of the dependence of cellular elastic moduli on glutaraldehyde fixation. J Microsc. 2005;219:61–68. [DOI] [PubMed] [Google Scholar]
- 34.Squire JM, Chew M, Nneji G, Neal C, Barry J, Michel C. Quasi-periodic substructure in the microvessel endothelial glycocalyx: a possible explanation for molecular filtering? J Struct Biol. 2001;136:239–255. [DOI] [PubMed] [Google Scholar]
- 35.Weinbaum S, Zhang X, Han Y, Vink H, Cowin SC. Mechanotransduction and flow across the endothelial glycocalyx. Proc Natl Acad Sci USA. 2003;100:7988–7995. [DOI] [PMC free article] [PubMed] [Google Scholar]
- 36.Handorf AM, Zhou Y, Halanski MA, Li W-J. Tissue stiffness dictates development, homeostasis, and disease progression. Organogenesis. 2015;11:1–15. [DOI] [PMC free article] [PubMed] [Google Scholar]
- 37.Furihata T, Kawamatsu S, Ito R, et al. Hydrocortisone enhances the barrier properties of HBMEC/cibeta, a brain microvascular endothelial cell line, through mesenchymal-to-endothelial transition-like effects. Fluids Barriers CNS. 2015;12:7. [DOI] [PMC free article] [PubMed] [Google Scholar]
- 38.Samples JR, Nayak SK, Gualtieri C, Binder PS. Effect of hydrocortisone on corneal endothelial cells in vitro. Exp Eye Res. 1985;41:487–495. [DOI] [PubMed] [Google Scholar]


