

ABSTRACT
Background
Accurate assessment of dietary intake is essential, but self-report of dietary intake is prone to measurement error and bias. Discovering metabolic consequences of diets with lower compared with higher protein intake could elucidate new, objective biomarkers of protein intake.
Objectives
The goal of this study was to identify serum metabolites associated with dietary protein intake.
Methods
Metabolites were measured with the use of untargeted, reverse-phase ultra-performance liquid chromatography–tandem mass spectrometry quantification in serum specimens collected at the 12-mo follow-up visit in the Modification of Diet in Renal Disease (MDRD) Study from 482 participants in study A (glomerular filtration rate: 25–55 mL · min−1 · 1.73 m−2) and 192 participants in study B (glomerular filtration rate: 13–24 mL · min−1 · 1.73 m−2). We used multivariable linear regression to test for differences in log-transformed metabolites (outcome) according to randomly assigned dietary protein intervention groups (exposure). Statistical significance was assessed at the Bonferroni-corrected threshold: 0.05/1193 = 4.2 × 10⁻⁵.
Results
In study A, 130 metabolites (83 known from 28 distinct pathways, including 7 amino acid pathways; 47 unknown) were significantly different between participants randomly assigned to the low-protein diet compared with the moderate-protein diet. In study B, 32 metabolites (22 known from 8 distinct pathways, including 4 amino acid pathways; 10 unknown) were significantly different between participants randomly assigned to the very-low-protein diet compared with the low-protein diet. A total of 11 known metabolites were significantly associated with protein intake in the same direction in both studies A and B: 3-methylhistidine, N-acetyl-3-methylhistidine, xanthurenate, isovalerylcarnitine, creatine, kynurenate, 1-(1-enyl-palmitoyl)-2-arachidonoyl-GPE (P-16:0/20:4), 1-(1-enyl-stearoyl)-2-arachidonoyl-GPE (P-18:0/20:4), 1-(1-enyl-palmitoyl)-2-arachidonoyl-GPC (P-16:0/20:4), sulfate, and γ-glutamylalanine.
Conclusions
Among patients with chronic kidney disease, an untargeted serum metabolomics platform identified multiple pathways and metabolites associated with dietary protein intake. Further research is necessary to characterize unknown compounds and to examine these metabolites in association with dietary protein intake among individuals without kidney disease.
This trial was registered at clinicaltrials.gov as NCT03202914.
Keywords: chronic kidney disease, diet modification, metabolic pathways, metabolites, protein
Introduction
Diet is central to chronic kidney disease (CKD) management and is likely a modifiable risk factor for CKD incidence and progression (1, 2). Clinical guidelines suggest avoiding a high intake of protein (>1.3 g · kg–1 · d–1) for patients at risk of CKD progression and reducing dietary intake of protein to 0.8 g · kg–1 · d–1 for patients with severely decreased glomerular filtration rate (GFR; <30 mL · min–1 · 1.73 m–2) (3, 4). However, the evidence supporting these recommendations is relatively weak. The strength of the recommendations are level 2, representing a suggestion, and the grades of the recommendations are B and C, representing low to moderate quality of evidence. In the Modification of Diet in Renal Disease (MDRD) Study, the largest randomized controlled trial on this topic, there was no significant difference in CKD progression by level of protein restriction (5). There is no general consensus on the optimal diet for reducing kidney disease risk, and protein restriction among CKD patients continues to be an active topic of investigation.
Accurate assessment of dietary intake is essential for research purposes, both for epidemiologic studies relating nutrition to disease outcomes as well as for determining adherence to dietary interventions in clinical trials. Self-report of dietary intake through the use of various instruments such as food records, 24-h dietary recalls, and food-frequency questionnaires is commonly used in research studies (6). Despite the strong foundation of dietary assessment that uses such instruments, measurement error and bias are widely recognized limitations of these subjective tools as well as of the food-composition databases used to determine the nutrient content of foods consumed (7–10). In contrast, biomarkers of dietary intake are not influenced by recall bias, social desirability bias, or other sources of systematic error. One such biomarker is urinary excretion of urea nitrogen, which is widely used as a biomarker of protein intake, although it suffers from imprecision and collection error (11, 12). Further research is necessary to identify novel biomarkers of dietary intake of protein that may be detectable in blood, which is relatively easier to obtain than urine (less burdensome for study participants) and not prone to error due to incomplete urine collection (13, 14).
Metabolomics is a rapidly evolving methodology that allows for the efficient detection of a wide range of small compounds in biological specimens (e.g., blood) (15). Global, untargeted metabolomic profiling provides the opportunity to obtain an unbiased, comprehensive characterization of complex biosystems. The human metabolome is thought to reflect not only that which is consumed but also the metabolism of consumed food and could be considered a proximal measure of diet (16, 17). Identifying metabolites associated with dietary protein intake may provide novel biomarkers for nutrition research and may also yield insights about intervention targets for patients with kidney disease. The objective of this study was to detect individual metabolites and to identify a composite of metabolites associated with dietary intake of protein among individuals with CKD in the MDRD study, which was a randomized clinical trial of dietary protein interventions.
Methods
Study population
The MDRD study was a multicenter randomized clinical trial conducted in 1989–1993 to determine the effect of dietary protein restriction on CKD progression (5, 18). Men and women aged 18–70 y with CKD and who had not received dialysis or a transplant were invited to participate. Individuals with moderately decreased GFR (25–55 mL · min–1 · 1.73 m–2) were eligible for study A (n = 585), and those with severely decreased GFR (13–24 mL · min–1 · 1.73 m–2) were eligible for study B (n = 255). There were 697 MDRD participants with a sufficient volume of serum specimens for metabolomic profiling at the 12-mo follow-up visit (baseline for this analysis). Of these, 19 were missing concomitant measured GFR and 4 were missing BMI, and the remaining analytic sample size was 674 (study A: n = 482; study B: n = 192; Supplemental Figure 1). Study procedures were followed in accordance with standards for ethical practice for research with human subjects. Approval was obtained from the Johns Hopkins Bloomberg School of Public Health Institutional Review Board to conduct this research.
Randomly assigned intervention groups
In a 2 × 2 factorial study design, individuals were randomly assigned to amounts of protein and phosphorus intake and levels of blood pressure control. For both studies A and B, level of blood pressure control varied by age (moderate mean arterial pressure: ≤107 mm Hg for individuals 18–60 y of age and ≤113 mm Hg for individuals ≥61 y of age; low mean arterial pressure: ≤92 mm Hg for individuals 18–60 y of age and ≤98 mm Hg for individuals ≥61 y of age). In study A, participants were randomly assigned to either 1) a usual-protein and -phosphorus diet (protein: 1.3 g · kg–1 · d–1; phosphorus: 16–20 mg · kg–1 · d–1) or 2) a low-protein and -phosphorus diet (protein: 0.58 g · kg–1 · d–1 with ≥0.35 g of protein high in amino acids; phosphorus: 5–10 mg · kg–1 · d–1). In study B, participants were randomly assigned to either 1) a low-protein and -phosphorus diet or 2) a very-low-protein and -phosphorus diet (protein: 0.28 g · kg–1 · d–1; phosphorus: 4–9 mg · kg–1 · d–1) supplemented by a keto acid and amino acid mixture (0.28 g · kg–1 · d–1) containing ornithine, lysine, and histidine salts of branched-chain keto acids (keto analogs of leucine, isoleucine, and valine) and the calcium salt of the hydroxy analog of methionine plus threonine, tyrosine, and tryptophan as l-amino acids (Ross Laboratories) (19). All participants received nutrition counseling on a monthly basis and were provided with low-protein foods and supplements (20).
Diet adherence measures
Twenty-four-hour urine specimens were collected every month for the measurement of urea nitrogen, an established biomarker of dietary protein intake. Urine specimens were shipped to the central biochemistry laboratory and stored at −70°C. Estimated protein intake (grams per kilogram per day) was calculated as 6.25 × [urinary urea nitrogen (g/d) + body weight (kg) × 0.031 (g nitrogen · kg–1 · d–1)] (21). Adherence to the protein interventions was defined as estimated protein intake of 0.98–1.62 g · kg–1 · d–1 for the usual-protein group, 0.40–0.75 g · kg–1 · d–1 for the low-protein group, and 0.22–0.42 g · kg–1 · d–1 for the very-low-protein group (22).
Metabolomic profiling
Serum specimens were collected from MDRD study participants at the 12-mo follow-up visit before measurement of GFR and were shipped to the central biochemistry laboratory to be stored at −70°C. Metabolites were measured by Metabolon, Inc. (Durham, North Carolina), with the use of reverse-phase, untargeted ultra-performance liquid chromatography–tandem mass spectrometry quantification (23). Peaks were quantified by calculating the AUC. Data were normalized to account for day-to-day instrumental variation. Compounds were identified by comparison to a library of purified standards or recurrent unknown entities, and matches were determined based on retention time, mass-to-charge ratio, and chromatographic data. For the 20 blind duplicates, the median correlation coefficient of metabolite concentration between duplicates was 0.91, and 72% of metabolites had a correlation coefficient >0.80. Metabolites were excluded if >99% of specimens had values below the lowest detectable level. For remaining metabolites (for which <99% of specimens had values below the lowest detectable level), values were imputed to the minimum detectable level for the respective metabolite. Due to the skewed distribution of metabolites on the natural scale, metabolites were log-transformed for analysis.
Statistical analysis
Baseline participant characteristics were reported according to study (A or B) and randomly assigned protein-intervention group with the use of descriptive statistics. Multivariable linear regression was used to test for differences in log-transformed metabolites (outcome) according to randomly assigned intervention groups for dietary protein (exposure) with adjustment for the following covariates: age, sex, race, log-transformed GFR measured by urinary clearance of 125I-iothalamate, renal diagnosis, randomly assigned intervention group for blood pressure control, and BMI. As a sensitivity analysis, the study population was restricted to those who were adherent to the dietary protein intervention groups (i.e., “on treatment” analysis), which was defined as described above through the use of the established biomarker of protein intake, 24-h urine excretion of urea nitrogen. Statistical significance was assessed at the Bonferroni-corrected threshold as a conservative approach to account for multiple testing and to reduce false positives: 0.05/1193 = 4.2 × 10⁻⁵ (24). All analyses were conducted separately for study A and study B. We calculated C statistics as a measure of the cumulative ability of the metabolites to predict dietary protein intervention in addition to covariates in a logistic regression model.
In order to reduce the dimensionality of the data and to identify a composite of metabolites representative of protein intake, partial-least-squares–discriminant analysis (PLS-DA) was used. PLS-DA is a supervised pattern recognition method that creates linear combinations of metabolites as principal components to predict group membership (i.e., randomized protein intervention). Each principal component is calculated from the coefficients for the metabolites and by maximizing the variance of the linear combination. Subsequent principal components (after creating the first) are orthogonal to the previous one. The proportion of the total variance explained by each principal component was calculated, and the total variance was defined as the sum of the variances of predicted values for each principal component. We identified the top 15 metabolites with the greatest influence on the first principal component, which was quantified as the weighted sum of squares of the partial-least-squares loadings for each component (i.e., variable importance in projection scores). Pearson correlation coefficients were calculated between the top 15 metabolites.
Results
Baseline characteristics
Participant characteristics were generally similar in studies A and B and the diet-intervention groups (Table 1). By design, participants in study A had a higher GFR than participants in study B and protein intake differed between the randomly assigned protein-intervention groups. There was a similar frequency of participants assigned to the blood pressure intervention across studies (A and B) and diet-intervention groups.
TABLE 1.
Baseline characteristics in MDRD study participants according to study (A, B) and randomly assigned protein-intervention group1
| Study A (n = 482) | Study B (n = 192) | |||
|---|---|---|---|---|
| Characteristic | Moderate protein (n = 246) | Low protein (n = 236) | Low protein (n = 102) | Very low protein (n = 90) |
| Blood pressure group, % (n) | ||||
| Moderate | 50 (124) | 46 (109) | 45 (46) | 49 (44) |
| Low | 50 (122) | 54 (127) | 55 (56) | 51 (46) |
| Age, y | 51 ± 12 | 52 ± 12 | 51 ± 12 | 51 ± 12 |
| Female, % (n) | 37 (92) | 37 (88) | 39 (40) | 38 (34) |
| White | 86 (212) | 86 (202) | 82 (84) | 89 (80) |
| BMI, kg/m2 | 27.9 ± 4.5 | 26.8 ± 4.0 | 25.6 ± 3.5 | 25.0 ± 4.0 |
| GFR, mL · min–1 · 1.73 m–2 | 34 ± 11 | 35 ± 11 | 15 ± 5 | 15 ± 5 |
| Renal diagnosis, % (n) | ||||
| PKD | 27 (67) | 23 (55) | 27 (28) | 23 (21) |
| Glomerular disease | 23 (57) | 22 (51) | 25 (26) | 22 (20) |
| Other diagnosis | 50 (122) | 55 (130) | 47 (48) | 54 (49) |
| Adherent,2 % (n) | 78 (183) | 63 (147) | 67 (66) | 41 (36) |
| Protein intake,3 g/d | 95.0 ± 25.3 | 58.4 ± 20.0 | 53.5 ± 14.6 | 34.2 ± 12.8 |
Values are means ± SDs for continuous variables and % (n) for categorical variables; n = 674. GFR, glomerular filtration rate; PKD, polycystic kidney disease.
Adherence to the protein interventions was defined as estimated protein intake of 0.98–1.62 g · kg–1 · d–1 for the usual-protein group, 0.40–0.75 g · kg–1 · d–1 for the low-protein group, and 0.22–0.42 g · kg–1 · d–1 for the very-low-protein group.
Mean protein intake (grams per day) was higher among men (study A, moderate protein: 101.0; study A, low protein: 62.7; study B, low protein: 56.0; study B, very low protein: 36.7) than women (study A, moderate protein: 85.0; study A, low protein: 51.5; study B, low protein: 49.8; study B, very low protein: 30.0).
Individual metabolites associated with dietary protein intake in study A
A total of 1193 metabolites (766 known and 427 unknown metabolites) were detected by metabolomic profiling. In study A, after adjusting for age, sex, race, measured GFR (mGFR), renal diagnosis, blood pressure intervention, and BMI, 130 metabolites (83 known metabolites from 28 distinct pathways, including 7 amino acid pathways; 47 unknown metabolites) were significantly different between participants randomly assigned to the low- compared with the moderate-protein diet (Figure 1, Supplemental Table 1). Among the metabolites with a strong negative coefficient (< −0.30; lower levels of metabolites for those on a low- compared with a moderate-protein diet), many were representative of pathways for the essential amino acids, including histidine, isoleucine, leucine, lysine, methionine, phenylalanine, tryptophan, and valine (Figure 2). Other significant metabolites with a strong negative coefficient were known markers of protein or breakdown products of animal sources of protein (3-methylhistidine, carnitine derivatives, urea, and creatine). Those metabolites with slightly weaker negative coefficients (<0 and >−0.30; lower levels of the metabolites with a low- than with a moderate-protein diet) were also representative of essential amino acid pathways and were known markers of dietary protein [trimethylamine N-oxide (TMAO), 1-methylhistidine]. Among the significant metabolites with a positive coefficient (>0; higher metabolite levels with a low- than with a moderate-protein diet) were lipid-related compounds, representing metabolic pathways of phospholipids, lysolipids, and fatty acids.
FIGURE 1.

Scatterplot of P values for the association between known metabolites and dietary protein intake according to pathway in study A. The horizontal line represents the Bonferroni-adjusted threshold for statistical significance. P values were calculated from multivariable linear regression models testing for differences in log-transformed metabolites (outcome) according to randomly assigned intervention groups for dietary protein (exposure), with adjustment for age, sex, race, log-transformed glomerular filtration rate measured by urinary clearance of 125I-iothalamate, renal diagnosis, randomly assigned intervention group for blood pressure control, and BMI in study A (n = 482).
FIGURE 2.
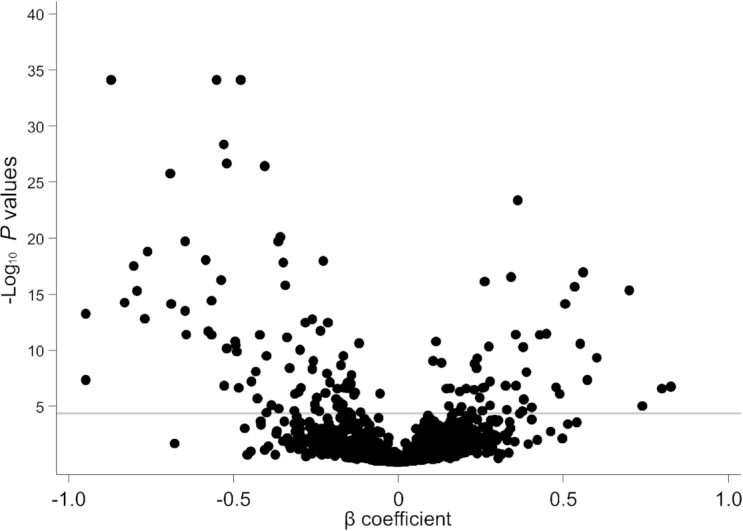
Scatterplot of P values and β coefficients for the association between metabolites and dietary protein intake in study A. The horizontal line represents the Bonferroni-adjusted threshold for statistical significance. P values and β coefficients were calculated from multivariable linear regression models testing for differences in log-transformed metabolites (outcome) according to randomly assigned intervention groups for dietary protein (exposure), with adjustment for age, sex, race, log-transformed glomerular filtration rate measured by urinary clearance of 125I-iothalamate, renal diagnosis, randomly assigned intervention group for blood pressure control, and BMI in study A (n = 482).
Individual metabolites associated with dietary protein intake in study B
In study B, 32 metabolites (22 known metabolites from 8 distinct pathways, including 4 amino acid pathways; 10 unknown metabolites) were significantly different between participants randomly assigned to the very-low-protein diet compared with the low-protein diet (Figure 3, Supplemental Table 2). All 10 significant known metabolites with a negative coefficient (<0; lower metabolite levels with the very-low-protein than with the low-protein diet) in study B were also found to be significant known metabolites with a negative coefficient in study A, including 3-methylhistidine (Figure 4). The majority of the 12 metabolites with a positive coefficient (>0; higher metabolite levels with the very-low-protein than with the low-protein diet) in study B were not statistically significant with a positive coefficient in study A, with the exception of γ-glutamylalanine, which replicated across studies. A total of 11 known metabolites were significantly associated with dietary protein intake in the same direction in both studies A and B: 1) 3-methylhistidine, 2) N-acetyl-3-methylhistidine, 3) xanthurenate, 4) isovalerylcarnitine, 5) creatine, 6) kynurenate, 7) 1-(1-enyl-palmitoyl)-2-arachidonoyl-GPE (P-16:0/20:4), 8) 1-(1-enyl-stearoyl)-2-arachidonoyl-GPE (P-18:0/20:4), 9) 1-(1-enyl-palmitoyl)-2-arachidonoyl-GPC (P-16:0/20:4), 10) sulfate, and 11) γ-glutamylalanine. These 11 metabolites represented metabolic pathways of amino acids (including histidine, tryptophan, leucine, isoleucine, and valine), creatine, plasmalogen, and a chemical.
FIGURE 3.

Scatterplot of P values for the association between known metabolites and dietary protein intake according to pathway in study B. The horizontal line represents the Bonferroni-adjusted threshold for statistical significance. P values were calculated from multivariable linear regression models testing for differences in log-transformed metabolites (outcome) according to randomly assigned intervention groups for dietary protein (exposure), with adjustment for age, sex, race, log-transformed glomerular filtration rate measured by urinary clearance of 125I-iothalamate, renal diagnosis, randomly assigned intervention group for blood pressure control, and BMI in study B (n = 192).
FIGURE 4.
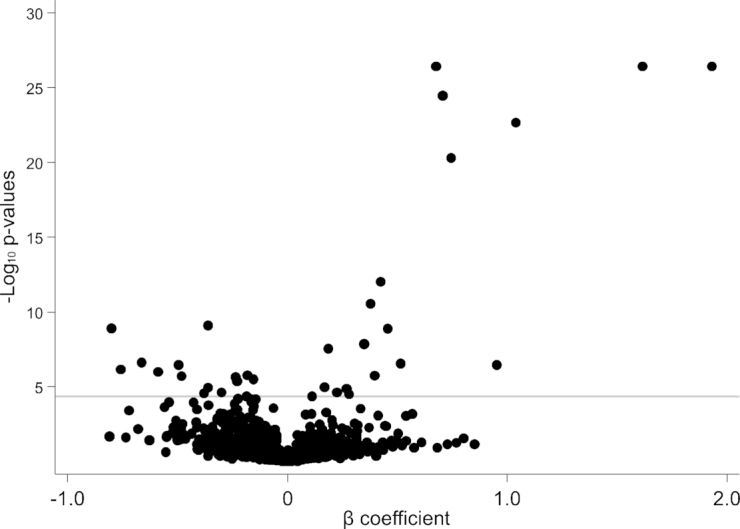
Scatterplot of P values and β coefficients for the association between metabolites and dietary protein intake in study B. The horizontal line represents the Bonferroni-adjusted threshold for statistical significance. P values and β coefficients were calculated from multivariable linear regression models testing for differences in log-transformed metabolites (outcome) according to randomly assigned intervention groups for dietary protein (exposure), with adjustment for age, sex, race, log-transformed glomerular filtration rate measured by urinary clearance of 125I-iothalamate, renal diagnosis, randomly assigned intervention group for blood pressure control, and BMI in study B (n = 192).
In study A, relative to a model including age, sex, race, mGFR, renal diagnosis, blood pressure group, and BMI (C statistic: 0.609; 95% CI: 0.558, 0.659), the 11 metabolites that replicated across studies significantly improved the prediction of dietary protein intervention (C statistic: 0.875; 95% CI: 0.845, 0.905; P < 0.001). Similarly, in study B, these 11 replicated metabolites significantly improved the prediction of dietary protein intervention (C statistic for model without metabolites: 0.570; 95% CI: 0.489, 0.651; C statistic for model with metabolites: 0.861; 95% CI: 0.808, 0.913; P < 0.001).
Individual metabolites associated with dietary protein intake among adherent participants
Two-thirds of the study population were adherent to the randomized protein intervention (66%; n = 432 of 652 after excluding those with missing 24-h urine excretion of urea nitrogen). Adherence was higher among those randomly assigned to less-restrictive diets (moderate protein: 78%; low protein: 65%; very low protein: 41%). In a sensitivity analysis limited to those who were adherent to the randomized protein intervention, a total of 132 metabolites differed between the low-protein and moderate-protein groups in study A, consisting of 83 known metabolites (representing 27 distinct pathways including 9 amino acid pathways) and 49 unknown metabolites (Supplemental Table 3). Overall, these results were similar to the main analysis.
Among adherent participants in study B, 15 metabolites differed between the very-low-protein and low-protein groups, consisting of 13 known metabolites (5 distinct pathways including 3 amino acid pathways) and 2 unknown metabolites (Supplemental Table 4). All 13 significant known metabolites detected in the sensitivity analysis for study B were also detected in the main analysis for study B. All metabolites with a positive coefficient (higher in the very-low-protein group than in the low-protein group) were components or derivatives of components in the keto-acid supplement, which was administered to the very-low-protein group (representing metabolism of leucine, isoleucine, valine, and threonine). The majority of metabolites with negative coefficients were related to animal sources of protein (3-methylhistidine, N-acetyl-3-methylhistidine, and creatine). Four metabolites were significantly associated with protein intake in both studies A and B, both in the overall analytic study population and among adherent participants: 3-methylhistidine, N-acetyl-3-methylhistidine, isovalerylcarnitine, and creatine.
Profile of metabolites associated with dietary protein intake
The use of PLS-DA allowed for the differentiation of composites of metabolites according to amounts of protein intake in study A and study B. Principal component 1 explained 3.9% of the variance in study A and 6.0% of the variance in study B. The most influential known metabolites in study A were hydantoin-5-propionic acid, phenylacetylcarnitine, S-methylmethionine, guanidinosuccinate, N-acetyl-3-methylhistidine, 6-oxopiperidine-2-carboxylic acid, methyl-4-hydroxybenzoate sulfate, azelate (nonanedioate), 3-methylhistidine, and xanthurenate (Figure 5). In study B, the most influential known metabolites were allo-isoleucine, 3-hydroxy-2-ethylpropionate, 4-acetamidophenylglucuronide, 3-methylhistidine, N-acetyl-3-methylhistidine, 2-methoxyacetaminophen glucuronide, 2-hydroxyacetaminophen sulfate, 3-(cystein-S-yl)acetaminophen, and N-acetylisoleucine (Figure 6). Five unknown metabolites in study A and 6 unknown metabolites in study B ranked among the top 15 metabolites according to variable importance in projection scores. The correlation between the top 15 known and unknown metabolites ranged from −0.20 to 0.76 in study A (Supplemental Table 5) and from −0.15 to 0.89 in study B (Supplemental Table 6).
FIGURE 5.
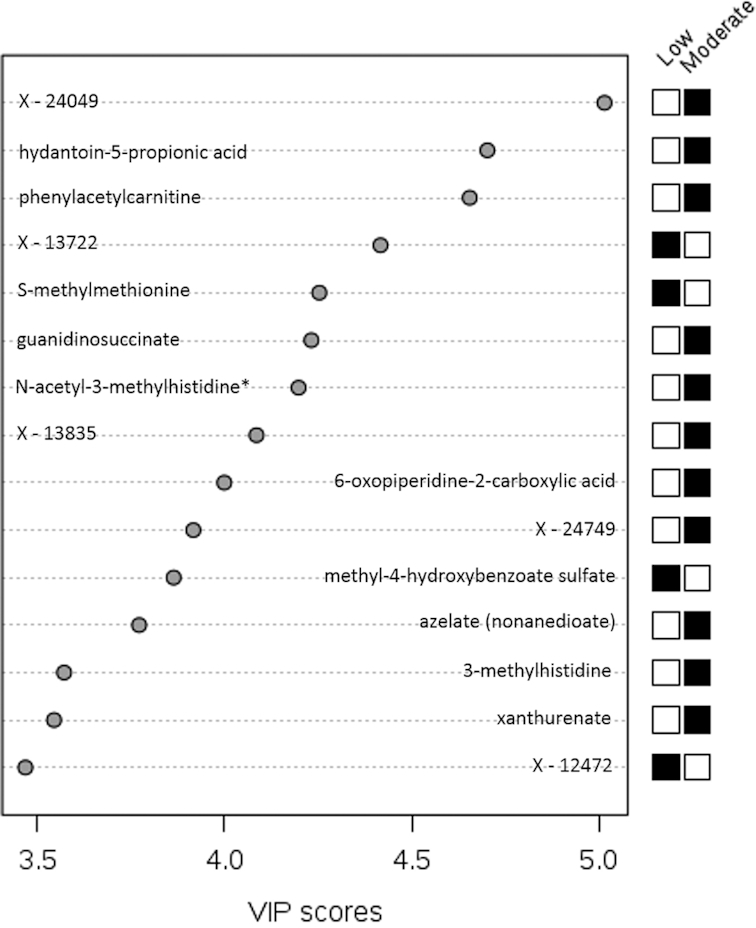
Top 15 metabolites in principal component 1 in study A. VIP scores are calculated as the weighted sum of squares of the partial-least-squares loadings for each component via partial-least-squares–discriminant analysis in study A (n = 482). *Compounds for which the identity is known but which have not been confirmed based on a standard. A black box for moderate protein (and white box for low protein) indicates that serum levels of the metabolite were higher between those randomly assigned to the moderate- compared with the low-protein intervention. A white box for moderate protein (and black box for low protein) indicates that serum levels of the metabolite were lower between those randomly assigned to the moderate- compared with the low-protein intervention. VIP, variable importance in projection.
FIGURE 6.
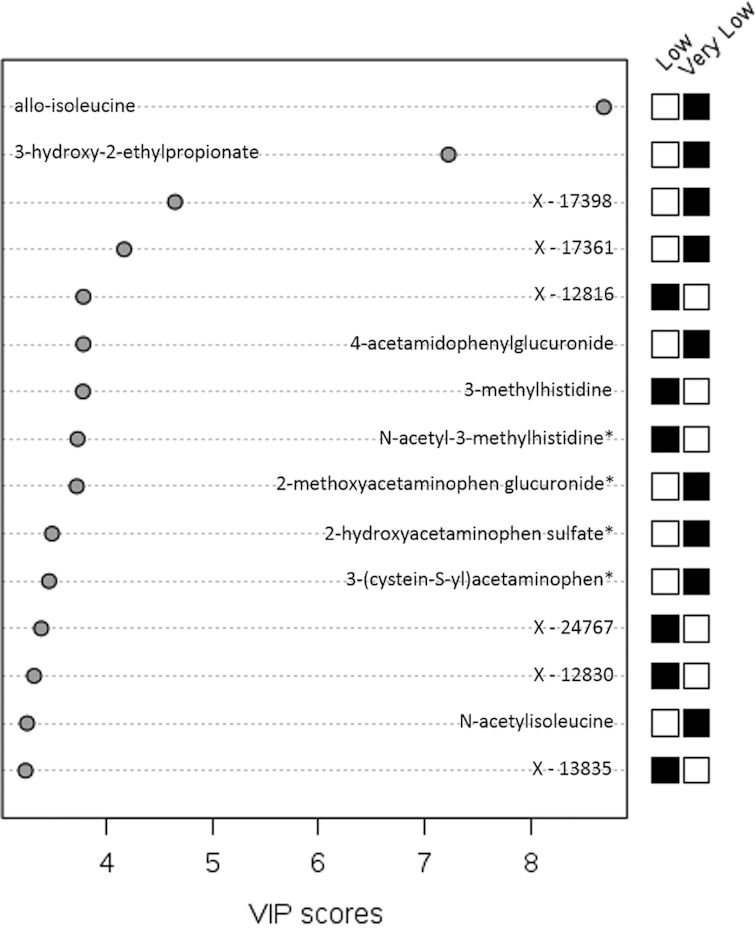
Top 15 metabolites in principal component 1 in study B. VIP scores are calculated as the weighted sum of squares of the partial-least-squares loadings for each component via partial-least-squares–discriminant analysis in study B (n = 192). *Compounds for which the identity is known but which have not been confirmed based on a standard. A black box for very low protein (and white box for low protein) indicates that serum levels of the metabolite were higher between those randomly assigned to the very-low- compared with the low-protein intervention. A white box for very low protein (and black box for low protein) indicates that serum levels of the metabolite were lower between those randomly assigned to the very-low- compared with the low-protein intervention. VIP, variable importance in projection.
Discussion
Among individuals with CKD in the MDRD study, an untargeted metabolomic platform identified multiple pathways and metabolites associated with dietary protein interventions. Many metabolites replicated in both studies A and B were known markers or breakdown products of dietary protein intake and the keto-acid supplement and were supported by previous research. Metabolomic profiling of blood specimens in this clinical trial of dietary protein interventions provided further validity for established biomarkers of protein intake, including 3-methylhistidine, 1-methylhistidine, carnitine derivatives, urea, creatine, TMAO, and essential amino acid metabolites. In addition, our study identified novel metabolites representative of pathways that are known to be related to protein metabolism, such as kynurenate and xanthurenate, which are related to the tryptophan metabolic pathway.
Our study findings are consistent with prior research on biomarkers of dietary protein intake. Multiple known markers of dietary protein intake and breakdown products of protein metabolism were identified. In particular, 3-methylhistidine and other metabolites of the histidine metabolic pathway (N-acetyl-3-methylhistidine, hydantoin-5-propionic acid) were consistently found to be strong and statistically significant markers of protein intake in both studies A and B, among adherers to the diet intervention, and both as individual metabolites and as part of a composite of metabolites. There are a plethora of studies that have noted 3-methylhistidine as being a useful indicator of total intake of animal sources of protein as well as specific sources of protein (red meat, poultry, fish) (11, 25–27).
We also found that several carnitine derivatives (e.g., phenylacetylcarnitine, isovalerylcarnitine) were associated with protein intake, which remained significant in sensitivity analyses and were influential as part of a metabolite profile. Carnitine is synthesized in the body from essential amino acids (lysine and methionine), and food sources include meat and dairy products (28). Carnitine is converted into acylcarnitines after carnitine transports fatty acids to the mitochondria for β-oxidation (28, 29). Elevated blood concentrations of acylcarnitines may suggest altered mitochondrial function and β-oxidation (28). Previous research has reported higher concentrations of acylcarnitines in association with meat consumption and a Western dietary pattern, which is characterized, in part, by a high intake of meat relative to a prudent dietary pattern (30, 31). Further research is needed to evaluate the extent to which diet can modify carnitine-related metabolites for disease prevention.
Creatine was another marker of protein intake, which, in our study, was replicated across studies A and B and remained in the sensitivity analysis among adherers. Animal sources of protein such as fish and red meat are known to be good sources of creatine, which has been shown to be a marker of meat consumption in previous small feeding studies (32, 33). In study A (both in the overall sample and among adherent participants only) but not in study B, TMAO was significantly associated with protein intake. TMAO has been shown to reflect the consumption of animal sources of protein with a high-fat content as a byproduct of carnitine and phosphatidylcholine metabolism by gut microbiota (27, 32, 34–36).
There were many metabolites significantly associated with protein intake that are related to the metabolism of essential amino acids, and branched-chain amino acids in particular (isoleucine, leucine, valine). Because essential amino acids, by definition, need to be consumed because they cannot be synthesized by the body, they could be useful markers of dietary intake. There is emerging evidence to suggest the influence of branched-chain amino acids on cardiometabolic health (37–40). Threonine, an essential amino acid, was detected at higher concentrations with the very-low-protein diet than with the low-protein diet in study B, which reflects the composition of the keto-acid supplement. Last, many of the significant metabolites that were found at higher concentrations among those consuming lower amounts of protein were representative of the other macronutrients [i.e., lipids (phospholipids, lysolipids, fatty acids) and carbohydrates (1,5-anhydroglucitol)]. At the same energy level, in order to reduce dietary intake of protein, it is necessary to increase either or both of the other macronutrients.
These study findings should be interpreted within the context of the study limitations and strengths. Our study included 80% (674 of 840) of the MDRD study participants. The main reason for exclusion was a lack of available stored specimens for metabolomic profiling, which was unrelated to random assignment and would not likely introduce bias. In a sensitivity analysis among participants who adhered to the diet intervention, our analytic sample was more selective, which may limit external validity. The metabolome reflects not only compounds derived from food but also compounds produced from cellular metabolism (endogenous metabolome). Unfortunately, we did not have any direct measures of lean body mass, but we did adjust for BMI as an estimate of body size. Levels of metabolites may have decreased in the stored specimens over time, but it would be expected to be nondifferential by randomly assigned dietary protein group. Furthermore, we were able to show the robustness of the metabolomic platform by reporting high reproducibility with 20 blind duplicate specimens. Another limitation is that levels of metabolites may vary depending on whether the study participant was in the fasting or the fed state at the time of specimen collection. The present study was conducted in individuals with moderately to severely reduced GFR (13–55 mL · min–1 · 1.73 m–2) who volunteered to participate in a clinical trial, and the findings may not be broadly generalizable. Further research should be conducted among people without CKD. Nonetheless, these study findings are important given the ongoing debate about protein restriction among individuals with CKD. We were able to leverage the unique design of the MDRD study to replicate findings from study A in study B; however, there are clear differences between these substudies (i.e., mGFR level and keto-acid supplement use), which could explain differences in the study findings.
The main strength of the present study is the use of a randomized clinical trial study design and a well-controlled diet intervention, which provides stronger evidence that the detected compounds reflect actual dietary protein intake. Many of the metabolites remained statistically significant in sensitivity analyses, in which we restricted the analysis of metabolites and randomly assigned group to those participants who were adherent to the dietary protein intervention based on an established biomarker of protein intake (i.e., 24-h urinary excretion of urea nitrogen). Another strength of our study was the use of blood specimens for the discovery of biomarkers of dietary intake. If our study findings are replicated in other study populations, circulating levels of these metabolites could be used in nutrition research in lieu of collecting 24-h urine specimens for the measurement of dietary biomarkers. This alternative technique would constitute a substantial reduction in the burden to research participants.
One of the main clinical implications of this research is the opportunity to assess protein intake with the use of blood biomarkers. Modifying dietary intake is a difficult goal to accomplish. Being diagnosed with a chronic condition, such as CKD, can be strong motivation for behavior change. However, living with a chronic illness can also introduce competing needs such as following a prescribed pharmacotherapy, managing comorbid conditions, and making other lifestyle changes relating to, for example, weight loss and physical activity. In the MDRD study, the intervention groups consisted of substantial protein restriction (50% reduction for the low-protein group and 75% reduction for the very-low-protein group relative to typical protein consumption) for an extended period of time. Long-term maintenance of diet modification is often necessary for the prevention of chronic disease incidence and progression. Measurement of metabolites of protein intake could be used to objectively assess adherence in clinical trials of dietary interventions and to target nonadherers for a more intensive intervention through nutrition counseling and support.
The discovery approach of the present study is highly novel and points to several future research directions. In particular, it will be necessary to develop quantitative assays for the known compounds and to structurally elucidate the highly promising and influential unknown compounds. Metabolites that represent dietary protein intake can be evaluated for their ability to predict CKD progression, which may inform dietary recommendations for CKD management.
In conclusion, an untargeted metabolomic platform identified many compounds that differed by amount of dietary protein intake, replicated across studies (A and B) within the overall MDRD study, and were consistent with knowledge about biological pathways and known biomarkers of protein intake. The untargeted metabolomic profiling not only provided further validity for previously identified biomarkers of protein intake but also identified novel markers. These study findings provide strong evidence for the measurement of blood markers for assessing consumption of protein in research settings, both as an indicator of adherence to diet interventions in clinical trials and to assess dietary intake in epidemiologic studies.
Supplementary Material
ACKNOWLEDGEMENTS
The authors’ responsibilities were as follows—CMR, MEG, LJA, ASL, and JC: designed the research study; MJS, LAI, ASL, and JC: provided essential materials; CMR and ZZ: performed the statistical analysis; CMR: wrote the article; CMR and JC: had responsibility for the content of the final product; and all authors: read and approved the final manuscript. None of the authors had a conflict of interest.
Notes
Supported by an investigator-initiated research project grant from the National Institute of Diabetes and Digestive and Kidney Diseases (NIDDK) for metabolomics in the Modification of Diet in Renal Disease (MDRD) study (R01 DK097020; to ASL). JC and MJS receive support from the Chronic Kidney Disease Biomarkers Consortium, which is funded by the NIDDK (U01 DK085689, U01 DK102730). CMR is supported by a Mentored Research Scientist Development Award from the NIDDK (K01 DK107782). Metabolon provided a discount on the metabolomic profiling as part of a collaborative agreement to develop a panel of metabolites for the estimation of glomerular filtration rate (provisional patent no. WO/2016/025429, “Precise estimation of glomerular filtration rate from multiple biomarkers”).
Supplemental Figure 1 and Supplemental Tables 1–6 are available from the “Supplementary data” link in the online posting of the article and from the same link in the online table of contents at https://academic.oup.com/ajcn/.
Abbreviations used: CKD, chronic kidney disease; GFR, glomerular filtration rate; MDRD, Modification of Diet in Renal Disease; mGFR, measured glomerular filtration rate; PLS-DA, partial-least-squares–discriminant analysis; TMAO, trimethylamine N-oxide.
References
- 1. Goraya N, Wesson DE. Dietary interventions to improve outcomes in chronic kidney disease. Curr Opin Nephrol Hypertens. 2015;24:505–10. [DOI] [PubMed] [Google Scholar]
- 2. Jain N, Reilly RF. Effects of dietary interventions on incidence and progression of CKD. Nat Rev Nephrol. 2014;10:712–24. [DOI] [PubMed] [Google Scholar]
- 3. National Kidney Foundation. KDOQI clinical practice guideline for diabetes and CKD: 2012 update. Am J Kidney Dis. 2012;60:850–86. [DOI] [PubMed] [Google Scholar]
- 4. Kidney Disease: Improving Global Outcomes (KDIGO). KDIGO clinical practice guideline for the evaluation and management of chronic kidney disease. Kidney Int Suppl. 2013;3:1–150. [Google Scholar]
- 5. Klahr S, Levey AS, Beck GJ, Caggiula AW, Hunsicker L, Kusek JW, Striker G. The effects of dietary protein restriction and blood-pressure control on the progression of chronic renal disease. Modification of Diet in Renal Disease Study Group. N Engl J Med. 1994;330:877–84. [DOI] [PubMed] [Google Scholar]
- 6. Willett WC, Sampson L, Stampfer MJ, Rosner B, Bain C, Witschi J, Hennekens CH, Speizer FE. Reproducibility and validity of a semiquantitative food frequency questionnaire. Am J Epidemiol. 1985;122:51–65. [DOI] [PubMed] [Google Scholar]
- 7. Kipnis V, Midthune D, Freedman L, Bingham S, Day NE, Riboli E, Ferrari P, Carroll RJ. Bias in dietary-report instruments and its implications for nutritional epidemiology. Public Health Nutr. 2002;5:915–23. [DOI] [PubMed] [Google Scholar]
- 8. Freedman LS, Schatzkin A, Midthune D, Kipnis V. Dealing with dietary measurement error in nutritional cohort studies. J Natl Cancer Inst. 2011;103:1086–92. [DOI] [PMC free article] [PubMed] [Google Scholar]
- 9. Illner AK, Freisling H, Boeing H, Huybrechts I, Crispim SP, Slimani N. Review and evaluation of innovative technologies for measuring diet in nutritional epidemiology. Int J Epidemiol. 2012;41:1187–203. [DOI] [PubMed] [Google Scholar]
- 10. Finglas PM, Berry R, Astley S. Assessing and improving the quality of food composition databases for nutrition and health applications in Europe: the contribution of EuroFIR. Adv Nutr. 2014;5(Suppl):608S–14S. [DOI] [PMC free article] [PubMed] [Google Scholar]
- 11. Hedrick VE, Dietrich AM, Estabrooks PA, Savla J, Serrano E, Davy BM. Dietary biomarkers: advances, limitations and future directions. Nutr J. 2012;11:109. [DOI] [PMC free article] [PubMed] [Google Scholar]
- 12. Bingham SA. Urine nitrogen as a biomarker for the validation of dietary protein intake. J Nutr. 2003;133(Suppl 3):921S–4S. [DOI] [PubMed] [Google Scholar]
- 13. Planning Committee on Dietary Reference Intakes Research Synthesis. Dietary Reference Intakes research synthesis: workshop summary. Washington (DC): National Academies Press; 2007, Available from: https://www.nap.edu/initiative/planning-committee-on-dietary-reference-intakes-research-synthesis. Accessed on 11 October 2018. [Google Scholar]
- 14. Jenab M, Slimani N, Bictash M, Ferrari P, Bingham SA. Biomarkers in nutritional epidemiology: applications, needs and new horizons. Hum Genet. 2009;125:507–25. [DOI] [PubMed] [Google Scholar]
- 15. Tzoulaki I, Ebbels TM, Valdes A, Elliott P, Ioannidis JP. Design and analysis of metabolomics studies in epidemiologic research: a primer on -omic technologies. Am J Epidemiol. 2014;180:129–39. [DOI] [PubMed] [Google Scholar]
- 16. Jones DP, Park Y, Ziegler TR. Nutritional metabolomics: progress in addressing complexity in diet and health. Annu Rev Nutr. 2012;32:183–202. [DOI] [PMC free article] [PubMed] [Google Scholar]
- 17. Scalbert A, Brennan L, Manach C, Andres-Lacueva C, Dragsted LO, Draper J, Rappaport SM, van der Hooft JJ, Wishart DS. The food metabolome: a window over dietary exposure. Am J Clin Nutr. 2014;99:1286–308. [DOI] [PubMed] [Google Scholar]
- 18. Levey AS, Adler S, Caggiula AW, England BK, Greene T, Hunsicker LG, Kusek JW, Rogers NL, Teschan PE. Effects of dietary protein restriction on the progression of advanced renal disease in the Modification of Diet in Renal Disease study. Am J Kidney Dis. 1996;27:652–63. [DOI] [PubMed] [Google Scholar]
- 19. Beck GJ, Berg RL, Coggins CH, Gassman JJ, Hunsicker LG, Schluchter MD, Williams GW. Design and statistical issues of the Modification of Diet in Renal Disease trial. The Modification of Diet in Renal Disease Study Group. Control Clin Trials. 1991;12:566–86. [DOI] [PubMed] [Google Scholar]
- 20. Gillis BP, Caggiula AW, Chiavacci AT, Coyne T, Doroshenko L, Milas NC, Nowalk MP, Scherch LK. Nutrition intervention program of the Modification of Diet in Renal Disease study: a self-management approach. J Am Diet Assoc. 1995;95:1288–94. [DOI] [PubMed] [Google Scholar]
- 21. Maroni BJ, Steinman TI, Mitch WE. A method for estimating nitrogen intake of patients with chronic renal failure. Kidney Int. 1985;27:58–65. [DOI] [PubMed] [Google Scholar]
- 22. Milas NC, Nowalk MP, Akpele L, Castaldo L, Coyne T, Doroshenko L, Kigawa L, Korzec-Ramirez D, Scherch LK, Snetselaar L. Factors associated with adherence to the dietary protein intervention in the Modification of Diet in Renal Disease study. J Am Diet Assoc. 1995;95:1295–300. [DOI] [PubMed] [Google Scholar]
- 23. Evans AM, DeHaven CD, Barrett T, Mitchell M, Milgram E. Integrated, nontargeted ultrahigh performance liquid chromatography/electrospray ionization tandem mass spectrometry platform for the identification and relative quantification of the small-molecule complement of biological systems. Anal Chem. 2009;81:6656–67. [DOI] [PubMed] [Google Scholar]
- 24. Curtin F, Schulz P. Multiple correlations and Bonferroni's correction. Biol Psychiatry. 1998;44:775–7. [DOI] [PubMed] [Google Scholar]
- 25. Cross AJ, Major JM, Sinha R. Urinary biomarkers of meat consumption. Cancer Epidemiol Biomarkers Prev. 2011;20:1107–11. [DOI] [PMC free article] [PubMed] [Google Scholar]
- 26. Abe H, Okuma E, Sekine H, Maeda A, Yoshiue S. Human urinary excretion of L-histidine-related compounds after ingestion of several meats and fish muscle. Int J Biochem. 1993;25:1245–9. [DOI] [PubMed] [Google Scholar]
- 27. Cheung W, Keski-Rahkonen P, Assi N, Ferrari P, Freisling H, Rinaldi S, Slimani N, Zamora-Ros R, Rundle M, Frost G et al.. A metabolomic study of biomarkers of meat and fish intake. Am J Clin Nutr. 2017;105:600–8. [DOI] [PubMed] [Google Scholar]
- 28. Borum PR. Carnitine. Annu Rev Nutr. 1983;3:233–59. [DOI] [PubMed] [Google Scholar]
- 29. Steiber A, Kerner J, Hoppel CL. Carnitine: a nutritional, biosynthetic, and functional perspective. Mol Aspects Med. 2004;25:455–73. [DOI] [PubMed] [Google Scholar]
- 30. Bouchard-Mercier A, Rudkowska I, Lemieux S, Couture P, Vohl MC. The metabolic signature associated with the Western dietary pattern: a cross-sectional study. Nutr J. 2013;12:158. [DOI] [PMC free article] [PubMed] [Google Scholar]
- 31. Schmidt JA, Rinaldi S, Ferrari P, Carayol M, Achaintre D, Scalbert A, Cross AJ, Gunter MJ, Fensom GK, Appleby PN et al.. Metabolic profiles of male meat eaters, fish eaters, vegetarians, and vegans from the EPIC-Oxford cohort. Am J Clin Nutr. 2015;102:1518–26. [DOI] [PMC free article] [PubMed] [Google Scholar]
- 32. Stella C, Beckwith-Hall B, Cloarec O, Holmes E, Lindon JC, Powell J, van der Ouderaa F, Bingham S, Cross AJ, Nicholson JK. Susceptibility of human metabolic phenotypes to dietary modulation. J Proteome Res. 2006;5:2780–8. [DOI] [PubMed] [Google Scholar]
- 33. Bertram HC, Hoppe C, Petersen BO, Duus JO, Molgaard C, Michaelsen KF. An NMR-based metabonomic investigation on effects of milk and meat protein diets given to 8-year-old boys. Br J Nutr. 2007;97:758–63. [DOI] [PubMed] [Google Scholar]
- 34. Koeth RA, Wang Z, Levison BS, Buffa JA, Org E, Sheehy BT, Britt EB, Fu X, Wu Y, Li L et al.. Intestinal microbiota metabolism of L-carnitine, a nutrient in red meat, promotes atherosclerosis. Nat Med. 2013;19:576–85. [DOI] [PMC free article] [PubMed] [Google Scholar]
- 35. Wang Z, Klipfell E, Bennett BJ, Koeth R, Levison BS, Dugar B, Feldstein AE, Britt EB, Fu X, Chung YM et al.. Gut flora metabolism of phosphatidylcholine promotes cardiovascular disease. Nature. 2011;472:57–63. [DOI] [PMC free article] [PubMed] [Google Scholar]
- 36. Zhang AQ, Mitchell SC, Smith RL. Dietary precursors of trimethylamine in man: a pilot study. Food Chem Toxicol. 1999;37:515–20. [DOI] [PubMed] [Google Scholar]
- 37. Cheng S, Shah SH, Corwin EJ, Fiehn O, Fitzgerald RL, Gerszten RE, Illig T, Rhee EP, Srinivas PR, Wang TJ et al.. Potential impact and study considerations of metabolomics in cardiovascular health and disease: a scientific statement from the American Heart Association. Circ Cardiovasc Genet. 2017;10:e000032. [DOI] [PMC free article] [PubMed] [Google Scholar]
- 38. Esko T, Hirschhorn JN, Feldman HA, Hsu YH, Deik AA, Clish CB, Ebbeling CB, Ludwig DS. Metabolomic profiles as reliable biomarkers of dietary composition. Am J Clin Nutr. 2017;105:547–54. [DOI] [PMC free article] [PubMed] [Google Scholar]
- 39. Jennings A, MacGregor A, Pallister T, Spector T, Cassidy A. Associations between branched chain amino acid intake and biomarkers of adiposity and cardiometabolic health independent of genetic factors: a twin study. Int J Cardiol. 2016;223:992–8. [DOI] [PMC free article] [PubMed] [Google Scholar]
- 40. Batch BC, Hyland K, Svetkey LP. Branch chain amino acids: biomarkers of health and disease. Curr Opin Clin Nutr Metab Care. 2014;17:86–9. [DOI] [PubMed] [Google Scholar]
Associated Data
This section collects any data citations, data availability statements, or supplementary materials included in this article.