

Abstract
Colour processing at early stages of visual pathways is a topic of intensive study both in vertebrate and invertebrate species. However, it is still unclear how colour learning and memory formation affects an insect brain in the peripheral processing stages and high-order integration centres, and whether associative colour experiences are reflected in plasticity of underlying neuronal circuits. To address this issue, we used Camponotus blandus ants as their proven colour learning and memory capabilities, precisely controllable age and experience, and already known central visual pathways offer unique access to analyse plasticity in neuronal circuits for colour vision in a miniature brain. The potential involvement of distinct neuropils—optic lobes (OLs), mushroom body (MB) input (collar) and output (vertical lobe), anterior optic tubercle (AOTU) and central complex (CX)—in associative colour experiences was assessed by quantification of volumetric and synaptic changes (MB collar) directly after colour conditioning and, 3 days later, after the establishment of long-term memory (LTM). To account for potential effects of non-associative light exposure, we compared neuronal changes in the brain of colour-naive foragers with those of foragers that had been exposed to light in a non-associative way. The results clearly show that the OLs, AOTU, and CX respond with plastic changes after colour learning and LTM formation. This suggests a complex neuronal network for colour learning and memory formation involving multiple brain levels. Such a colour-processing network probably represents an efficient design promoting fast and accurate behavioural decisions during orientation and navigation.
Keywords: colour learning, memory, optic lobe, mushroom body, central complex, anterior optic tubercle
1. Background
Colour vision is a complex physiological process requiring the presence of at least two spectrally distinct photoreceptors [1,2] and a post-receptor neuronal mechanism to modulate dynamic interactions between the peripheral and central brain regions [3–5]. Interestingly, colour vision in vertebrates and insects (for example, bees and ants) was shown to exhibit striking similarities with respect to reception and perception; they share similar classes of visual pigments [6] and use a similar colour opponent mechanism for processing and perception [7]. The neuronal basis of colour vision, especially in humans, has been a topic of intense study emphasizing the involvement of multiple brain centres and the importance of cognitive factors such as learning and memory [2,8,9]. Recently, cognitive constraints have also been suggested to shape colour discrimination performances of insect species [3,4]. However, how colour learning and memory affects an insect brain, especially beyond the peripheral visual sensory centres, and whether associative colour experiences trigger simultaneous plastic changes in the underlying neuronal-circuit architecture have not, to our knowledge, been studied yet.
In insects, colour information, received by the photoreceptors in the retina, is processed at the level of colour opponent neurons in the inner layers of the optic lobe (OL) neuropils—the medulla (ME) and lobula (LO) [10–14]. In some insects, inner photoreceptor terminals [15] and the first optic neuropil, the lamina (LA) [16,17], have also been suggested to contribute to colour processing via spectral opponency. At a higher integrative level, the mushroom bodies (MBs) [18–20] and the central complex (CX) [21] are prominent structures probably involved in colour processing owing to their role in multisensory integration. These brain areas are also known to be involved in learning and memory [18,22–28] and express sensory exposure and experience-dependent changes in their neural circuitry [29–35]. Indeed, recent studies suggested a possible role of the CX, MB-calyx collar and MB output regions (the vertical lobe, VL, in honeybees and ants), in different forms of colour learning and memory formation [36–39]. Additionally, investigations of spectral properties of anterior optic tubercle (AOTU) interneurons in locust [40] and honeybees [41] revealed the involvement of this brain region in processing of chromatic information. A recent study in Drosophila further implied that the AOTU is involved in high-order feature coding necessary for figure–ground discrimination [42]. However, to our knowledge, no study so far has addressed the potential role of the above processing stages and integration centres in colour learning and memory formation using anatomical measures for neuronal plasticity.
To understand the neuronal bases of chromatic information processing in an animal requires the combination of behavioural experiments with neuronal analyses. So far, those studies are rare owing to the difficulties in testing colour learning and discrimination performance in many animals [2]. In ants, the brain anatomy is relatively simple, and the organization of brain neuropils has been analysed in detail over the last few years [33,43,44]. Recently, we showed that Camponotus blandus workers are able to learn the association of colour information and a reward, independent of intensity differences, and to form complex colour memories based upon experience [45], similar to flower visiting honeybees and bumblebees [46–48]. This enables us to link associative colour learning performance with analyses of structural neuronal plasticity in defined neuropils like the OLs, CX, AOTU and MB input (collar) and output regions (VLs) aiming at identifying colour-processing centres in the insect visual pathway involved in colour learning and memory formation.
2. Methods
(a). Animals
Camponotus blandus (Smith, 1858) ants originated from a large laboratory colony collected in 2009 in Formosa, Argentina (by Flavio Roces). A subcolony, containing around 120 larvae and around 100 paint-labelled workers of unknown age, was established a few months before the experiments started and maintained in a climate-controlled chamber (at 25°C, 50% relative humidity and a 12 L : 12 D regime) at the Biozentrum, University of Würzburg, Germany. The colony was placed in a nest-box connected to a foraging arena where food (i.e. dead crickets) and water was provided ad libitum.
Freshly eclosed individuals were marked with numbered-tags and later collected from the foraging arena for behavioural experiments and neuroanatomical analyses. The age of tested workers ranged between 2.5 and 6.5 months, and ants were randomly assigned to one of five experimental groups. To minimize worker size variation, only minor and medium-sized workers with thorax lengths between 2.3 and 3.1 mm were used [33,49]. Workers involved in the memory retrieval experiments were transferred after 21 trials/visits to a second subcolony of similar size and kept under constant darkness for 3 days (see below for more details).
(b). Behavioural experiments
(i). Experimental set-up and light stimuli
The experimental set-up and the light stimuli used during learning and memory experiments were similar to the procedure described in [45]. Briefly, experiments were performed in a Y-maze and green (528 nm) and ultraviolet (UV, 365 nm) light were provided by light emitting diodes (LEDs, 3.46 × 3.46 mm, OSRAM GmbH, Munich, Germany). LEDs were positioned at the arms of the maze at a distance of 12.5 cm from the decision point, subtending a visual angle of ca 23°. Environmental illumination during experiments was provided by a sunray bulb (35 W; Exo Terra, Holm, Germany) with full light spectrum including UV radiation.
(ii). Training
Experimental groups used for behavioural experiments and neuroanatomical analysis are described in detail in figure 1 and the electronic supplementary material, table S1. Behavioural experiments consisted of paired (learning (Le) and long-term memory (LTM)) and unpaired (control of learning (LeCon) and control of LTM (LTMCon)) treatment groups of freely walking foragers (figure 1; electronic supplementary material, table S1). In addition, animals collected from the foraging arena and dissected immediately (without any training and light exposure) for further neuronal analysis, were included in the naive (Na) control group (figure 1; electronic supplementary material, table S1).
Figure 1.

Experimental protocols used for the naive, paired (learning and memory) and control groups. Age-defined foragers collected from the foraging arena were randomly assigned to one of the five experimental groups. (a) Age-defined ants from the naive control group (Na) were dissected immediately after randomly collecting from the foraging arena. (b,d) For the paired groups, foragers were trained with green (GR) (CS+) versus UV (CS−) light for 21 training trials with 6 min inter trial intervals (ITI) and tested under control and critical test conditions directly (Le) or 3 days (LTM) after training. (c,e) For unpaired light exposure (control) groups, age-defined foragers performed 21 consecutive visits to the maze with 6 min ITI where the sucrose solution was associated with either green or UV in a pseudorandomized order. Similar to the paired groups, the ants were tested in a control and critical test directly (LeCon) or 3 days (LTMCon) after training. (Online version in colour.)
Recently, it was shown that C. blandus workers can discriminate green light from UV, overriding their innate UV preference with increasing experience [45]. Therefore, in paired groups we trained ants to discriminate between green (CS+) and UV (CS−) light following the conditioning protocol described in [45]. Green light was rewarded with 3 µl of 20% sucrose solution (CS+), and UV was unrewarded (CS−, water only). In the control groups, the sucrose solution was presented with either green or UV light in a pseudorandomized order, thus preventing the ants learning to associate sucrose solution with a specific wavelength.
(iii). Tests
All ants were tested as follows (for details, see [45]). In the control test (Cnt, see the electronic supplementary material, figure S1), both stimuli were presented at the same intensity (4.50 × 10¹³ photons cm−2 s−1) as during training, while in the critical test (Crt) the intensity of green light was decreased by 1 log unit (1.29 × 10¹²). In Le and the corresponding control group LeCon, foragers, which had completed 21 consecutive visits were tested directly after the experiment while in the LTM and its control group LTMCon, ants were transferred to the second subcolony (see above) and were tested for memory retrieval 3 days after conditioning (electronic supplementary material, table S1). First choice and the relative time spent in the arm (measured for the first minute) containing the green wavelength, were recorded. For each ant, the entire training took approximately 3–4 h, providing sufficient time for potential neuronal changes also for the ants in the Le and LeCon groups [50]. As the time between the end of a first training trial and testing for colour learning performances was 3–4 h, we consider that mid-term memory (MTM) formation may already be involved in potential neuronal changes.
(c). Neuroanatomical experiments
(i). Immunohistochemistry
Ants were anaesthetized on ice and decapitated under the same environmental light conditions used during the behavioural experiments (see above). After dissection, brains were immediately fixed in 4% formaldehyde for 1–3 days at 4°C and further processed using a standard protocol for synapsin immunolabelling in whole mount preparations (for details, see [51]).
(ii). Confocal laser scanning microscopy and data analyses
Whole mount preparations were scanned using a laser scanning confocal microscope (Leica TCS SP2 AOBS, Leica Microsystems AG, Wetzlar, Germany) at a final image resolution of 1024 × 1024 pixels. For reconstruction and volumetric measurements of the neuropils (see also figure 2), optical sections were taken at 5 µm intervals for the OL (20×/0.7 numerical aperture (NA) and imm (multi-immersion), digital zoom 2.5) and MB-calyx collar (20×/0.7 NA imm digital zoom 3) and 4 µm for the AOTU, VL and CX (20×/0.7 NA imm, digital zoom 3). For high-resolution analysis of presynaptic boutons (microglomeruli) in the MB-calyx collar, the collar of one medial calyx was scanned at high resolution at intervals of 0.5 µm (through 10 µm depth) (63×/1.4 NA imm, digital zoom 2).
Figure 2.

Three-dimensional reconstruction of a C. blandus worker brain (a view from the back) highlighting the brain regions used for analyses of structural neuronal plasticity; OL, optic lobe; LA, lamina; ME, medulla; LO, lobula; MB, mushroom body; CO, collar; VL, vertical lobe; AOTU, anterior optic tubercle; FB, fan shape body; EB, ellipsoid body; PB, protocerebral bridge; NO, noduli; AL, antennal lobe. Scale bar: 100 µm. (Online version in colour.)
We used the three dimensional-reconstruction software AMIRA 6.2.0 (FEI Visualization Sciences Group, Düsseldorf, Germany) for absolute volumetric and synaptic analysis of digital image stacks [51]. The density of presynaptic boutons in the collar was quantified by counting synapsin-immunoreactive puncta (the anti-synapsin labelled synaptic boutons) within three 1000 µm³ cuboids. Number of boutons from each cuboid were summed and averaged for each individual. The total amount of boutons per collar was then estimated by multiplying the bouton densities with the volume of the reconstructed collar. Absolute volumes and bouton numbers were used for comparison, as we did not find any correlations between body size (thorax length) and any of the investigated neuropils (Spearman's ρ (α = 0.05): OL: ρ = 0.219, p = 0.09; CX: ρ = 0.103, p = 0.454; MB-calyx: ρ = 0.156, p = 0.251; VL: ρ = −0.020, p = 0.903; AOTU: ρ = 0.081, p = 0.603).
(d). Statistical analyses
The statistical methods used for behavioural experiments were similar to those described previously [45]. For neuroanatomical analyses, a generalized linear mixed model followed by post hoc Tukey test was applied with body size (thorax length) and age (days) as random factors. Statistical analysis was performed in R and the significance level for all analyses was set to 0.05. Graphs and figures were done in SigmaPlot 14 (Systat Software, Inc., USA) and edited using Corel Draw X7 (Corel Corporation Ltd., Ottawa, Canada).
3. Results
(a). Behavioural experiments
In both the Le and LTM groups, foragers trained with green (CS+) versus UV (CS−) light were able to reliably learn the rewarded stimulus during the conditioning phase. As expected, in both unpaired light exposure groups, the ants were not able to associate the sucrose reward with a specific wavelength during training (see the electronic supplementary material, figure S1 for details).
(b). Neuroanatomical experiments
(i). Volumetric changes in the optic lobe neuropils
To investigate whether the OL neuropils express volume changes related to colour learning and LTM formation, volumes of the LA, ME and LO were analysed in animals from the Le group (i.e. after the 3–4 h of training) and the LTM group (i.e. 3 days after training) and were compared with the control groups (figure 3). The volumes of LA and LO increased significantly after colour learning (LA: Le–Na: z = −2.748, p = 0.047; Le–LeCon: z = −3.625, p = 0.002; Le–LTMCon: z = −2.750, p = 0.046; LO: Le–Na: z = −8.599, p = 0 < 0.001; Le–LTMCon: z = −4.403, p = 0 < 0.001) and LTM formation (LA: LTM–LeCon: z = 3.516, p = 0.004; LTM–LTMCon: z = 2.733, p = 0.049; LO: LTM–Na z = −3.478, p = 0.004; LTM–LTMCon: z = 3.270, p = 0.009). Also, we found a significant increase in the ME volume of the Le group when compared with LTMCon (Le–LTMCon: z = −2979, p = 0.023), but no changes in the LTM group (figure 3).
Figure 3.
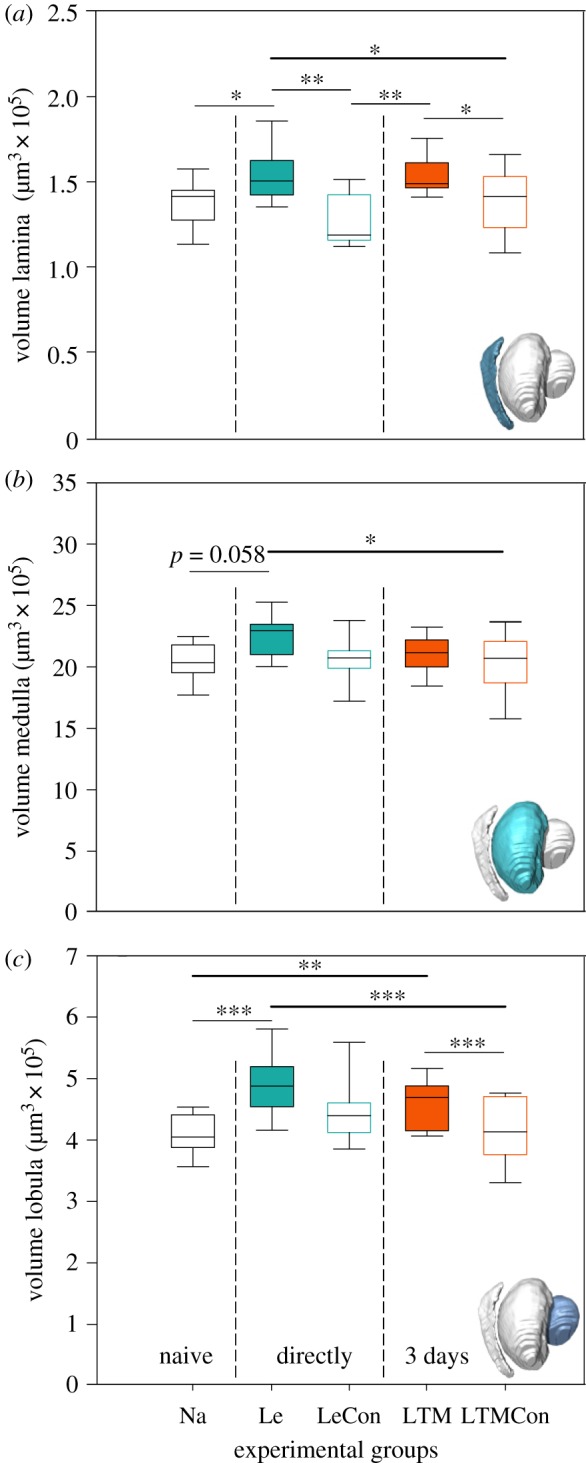
Colour learning and long-term memory related changes in the volume of optic lobe neuropils, (a) lamina, (b) medulla and (c) lobula. Significant differences between the groups are marked with asterisks. Le, learning group; LeCon, light exposure group as an unpaired control of Le; LTM, long-term memory group; LTMCon, light exposure group as an unpaired control of LTM. Na, n = 13; Le, n = 12; LeCon, n = 10; LTM, n = 13; LTMCon, n = 13. n.s., not significant; *p < 0.05; **p < 0.01; ***p < 0.001. (Online version in colour.)
(ii). Volumetric changes and changes of synaptic complexes in the mushroom body visual input (collar) and output (vertical lobe) regions
Possible changes in the MB-calyx collar after colour learning and LTM formation were assessed by quantifying the volume and the density and the extrapolated total number of presynaptic boutons of synaptic complexes. The results revealed that colour learning and LTM formation did not affect the volume of the visual collar when compared with the control groups (Le–Na: z = −1.350, p = 0.64; Le–LeCon: z = 1.698, p = 0.41; Le–LTMCon: z = −2.562, p = 0.07, LTM–Na: z = 0.320, p = 0.997; LTM–LeCon: z = 0.560, p = 0.978; LTM–LTMCon: z = 2.067, p = 0.219; figure 4a).
Figure 4.

Colour learning and long-term memory related changes of the (a) volume, (b) bouton density and (c) total number of boutons in the MB-calyx collar (CO) and (d) in the volume of the visual layer (collar, CO) of the vertical lobe (VL). No statistically significant differences between the groups were found. Le, learning group; LeCon, light exposure group as an unpaired control for Le; LTM, long-term memory group; LTMCon, light exposure group as an unpaired control for LTM. CO: Na, n = 12; Le, n = 12; LeCon, n = 10 (volume), 9 (density); LTM, n = 11; LTMCon, n = 11 (volume), 12 (density). CO layer in VL: Na, n = 7; Le, n = 10; LeCon, n = 7; LTM, n = 7; LTMCon, n = 9 (n.s., not significant). (Online version in colour.)
Similarly, no significant difference was found in the density of presynaptic boutons (Le–Na: z = 0.426, p = 0.993; Le–LeCon: z = 1.687, p = 0.441; Le–LTMCon: z = −0.289, p = 0.993, LTM–Na: z = −0.869, p = 0.908; LTM–LeCon: z = −4.488, p = 0.988; LTM–LTMCon: z = 1.554, p = 0.526; figure 4b) or in total boutons number (Le–Na: z = −2.118, p = 0.212; Le–LeCon: z = −0.528, p = 0.985; Le–LTMCon: z = −2.420, p = 0.110, LTM–Na: z = −1.091, p = 0.811; LTM–LeCon: z = −0.414, p = 0.994; LTM–LTMCon: z = 1.394, p = 0.631; figure 4c) between learning and control groups.
Earlier studies in bees suggested a correlation between learning performance and density of presynaptic boutons [37,39]. We thus tested for possible correlations between learning performance and synaptic density or total bouton number in the Le and LTM groups. However, in both groups, neither synaptic bouton density nor bouton number in the visual collar region of the MB-calyx correlated with learning performances of individual ants (see the electronic supplementary material, figure S2).
We further analysed the volumetric changes in the visual layer of the VL, as a part of the MB output region. For this, we first characterized the VL structure in C. blandus workers and identified the visual sublayers using tracer applications into the VL. Similar to the situation in honeybees [52], the VL in the ant brain is partitioned into three major sublayers, representing one of three input regions of the MB-calyces: basal ring, collar and lip (for detail, see the electronic supplementary material, figure S3). However, no significant differences were found in the volume of the visual layer (collar) of the VL after colour learning and LTM formation (Le–Na: z = −1.338, p = 0.666; Le–LeCon: z = 0.299, p = 0.998; Le–LTMCon: z = −1.064, p = 0.824, LTM–Na: z = −0.867, p = 0.909; LTM–LeCon: z = −0.641, p = 0.968; LTM–LTMCon: z = 0.576, p = 0.978; figure 4d).
(iii). Volumetric changes in the central complex neuropils
Owing to their high density, it is not possible to count individual synaptic complexes within subunits of the CX with the methods used. Therefore, to estimate the effects of colour learning and memory formation on the CX, the volume of the four CX neuropils, the fan-shaped body (FB), ellipsoid body (EB), protocerebral bridge (PB) and noduli (NO), were analysed separately (figure 5). The volume of the FB increased significantly after colour learning and LTM formation (Le–Na: z = −2.971, p = 0.0186; Le–LTMCon: z = −2.981, p = 0.018; LTM–Na: z = −4.155, p < 0.001; LTM–LTMCon: z = 2790.120, p < 0.001; figure 5a). Interestingly, the volume of the PB was significantly larger in the LTM (LTM–Na: z = −3.032, p = 0.02) and LTMCon (LTMCon–Na: z = −2.893, p = 0.03; figure 5c) group compared with the naive control group. By contrast, no changes were found for the EB (Le–Na: z = −2.113, p = 0.214; Le–LeCon: z = −1.258, p = 0.717; Le–LTMCon: z = −1.373, p = 0.644, LTM–Na: z = −0.377, p = 0.996; LTM–LeCon: z = −0.377, p = 0.996; LTM–LTMCon: z = −0.415, p = 0.994; figure 5b) and the noduli volume (Le–Na: z = −1.840, p = 0.349; Le–LeCon: z = −0.627, p = 0.971; Le–LTMCon: z = −0.697, p = 0.957, LTM–Na: z = −0.947, p = 0.291; LTM–LeCon: z = 0.673, p = 0.962; LTM–LTMCon: z = −1.263, p = 0.713; figure 5d).
Figure 5.

Colour learning and long-term memory related changes in the volume of components of the central complex: (a) fan-shaped body (FB), (b) ellipsoid body (EB), (c) protocerebral bridge (PB) and (d) noduli. Significant differences between the groups are marked with asterisks. Le, learning group; LeCon, light exposure group as an unpaired control for Le; LTM, long-term memory group; LTMCon, light exposure group as an unpaired control for LTM; Na, n = 12; Le, n = 10; LeCon, n = 9; LTM, n = 11; LTMCon, n = 13. n.s., not significant; *p < 0.05; ***p < 0.001. (Online version in colour.)
(iv). Volumetric changes in the anterior optic tubercle
We also analysed the volume of the AOTU, which previously was shown to be involved in colour processing [41] (figure 6). The volume of the AOTU increased significantly after colour learning (Le–Na: z = −3.100, p = 0.016; Le–LeCon: z = −2.976, p = 0.024; Le–LTMCon: z = −3.454, p = 0.004) and after LTM formation (LTM–Na: z = −3.391, p = 0.006; LTM–LeCon: z = 3.257, p = 0.009; LTM–LTMCon: z = 3.721, p = 0.00) compared to the control groups (figure 6).
Figure 6.

Colour learning and long-term memory related changes in the volume of the anterior optic tubercle (AOTU). Significant differences between the groups are marked with asterisks. Le, learning group; LeCon, light exposure group as an unpaired control for Le; LTM, long-term memory group; LTMCon, light exposure group as an unpaired control for LTM; Na, n = 11; Le, n = 9; LeCon, n = 8; LTM, n = 8; LTMCon, n = 8. n.s., not significant; *p < 0.05; **p < 0.01. (Online version in colour.)
4. Discussion
Our results show, for the first time to our knowledge, that colour learning and memory formation leads to volume increases of multiple brain regions in the ant brain—i.e. the OL, CX and AOTU—indicating that these neuropils are potential neuronal substrates for associative colour memories. It is, therefore, tempting to speculate that the neuronal circuits of these areas are parts of a colour vision network that may contribute to the same cognitive task promoting fast decision processes during orientation and navigation. Surprisingly, we did not find any specific structural changes following colour learning and LTM formation in the MBs. Therefore, we suggest that the OLs, AOTU and the CX, but not the MBs, might be involved in learning associations for colour discrimination and subsequent mid- and long-term colour memory formation.
The time span ranging between the end of a first training trial and testing for colour learning (3–4 h) corresponds to the formation of an MTM that is induced by multiple conditioning and in parallel to the LTM formation [53]. At the cellular level, therefore, independent volume increases in distinct neuropils during learning, MTM and LTM formation might reflect the establishment of new synaptic connections, such as outgrowth of dendritic or axonal arborizations, or strengthening of existing ones by diameter expansions. In the case of the OLs, for instance, processing of colour information at the level of colour opponency may increase and strengthen the excitatory neuronal connections that are relevant for discrimination behaviour [12]. These connections then probably become accentuated in the case of learning and memory formation. In Drosophila, sensory experience-dependent volumetric changes in the OL neuropils were mainly associated with an increase in the number and size of terminal branches of different photoreceptor cells [34,54,55] and an increase of synaptic contacts between retinula and monopolar LA neurons [56]. The volumetric increases in the first OL neuropil (LA) might imply that colour learning mediated effects occur at a very peripheral site (i.e. in the LA rather than ME). This was also suggested by previous physiological studies [10,16].
In this study, prominent changes in the volume of the FB, but not in the EB, suggest that the FB is a potential region in the CX involved in visual memory formation after associative colour learning. This is consistent with previous findings in Drosophila that implicate the FB in visual pattern memory formation [27,57]. In bees and locusts, the upper unit of the AOTU has been implicated in the processing of chromatic information [40,41,58]. Therefore, we assume that the potential increase in size and connectivity of terminal axons of LO–ME projection neurons within the upper unit of the AOTU might also be involved in colour learning and memory-related structural plasticity in this neuropil. Consistent with this, neuronal connections between the upper unit of the AOTU and FB within the putative colour vision network might mediate neuronal changes in the FB of the ants. The potential role of the PB in a colour vision network is not yet well understood. The significant volume increase in the PB in C. blandus we found both in the control (LTMCon) and memory (LTM) groups (compared to the ants from Na control) might be explained by integration of sensory information (in this case colour information) with self-motion cues to mediate directional information to the motor output [59].
The absence of volumetric or structural synaptic changes in the MB input (collar) and output regions (VL), or any correlation between the bouton density/number and the learning performance of individual foragers, prevent us from making any direct conclusion about the exact role of the MBs in associative colour memories. Previous studies suggested that the MBs might be involved in more complex tasks (i.e. multisensory and contextual learning [53]) or might be confined to specific situations or contexts [60,61]. Comparable to our finding, in honeybees, no changes of the number of presynaptic boutons in the MB-collar was found after fine colour discrimination [37]. In the same line, a role of MB VL lobes—but not the MB collar—was suggested for aversive colour learning after procaine injections in the respective areas [38]. The authors explained this with the layered structural organization of the collar. When compared to honeybees, the MB-calyx collar is less layered in ants indicating potential functional differences [62]. However, we surely cannot exclude any potential changes in the fine structure of presynaptic boutons of projection neurons in the MB collar or dendritic branches of MB intrinsic neurons (Kenyon cells) that might not be detectable by our quantification technique (e.g. [29,63,64]). Furthermore, under our experimental conditions the amount and complexity of stored visual (colour) information is, most probably, well below those formed under natural foraging conditions.
In conclusion, our results provide evidence that during colour learning and memory formation several neuropils at multiple brain levels are involved, suggesting a more complex underlying neuronal network as previously expected. However, the exact function of the MBs within the putative colour vision network, for the moment, remains unknown and needs complementary structural and functional investigations at the cellular and molecular levels for a better functional understanding. Furthermore, whether a combination of feed forward and feedback mechanisms (e.g. to sharpen the visual signal during memory retrieval) are involved in the neuronal modifications, (e.g. in the OLs), is also an intriguing question to be addressed in the future. Potential feedback neurons from the MBs to upstream processing centres have been suggested to potentially relay learned odour information, for example, to the antennal lobe during olfactory processing of novel stimuli [65–68]. With this regard, further studies on the function and potential plasticity in visual pathways across different brain areas will contribute to our understanding of the putative colour vision network. Considering the complex nature of colour vision, especially how distinct visual (i.e. form, motion) and other sensory information converge at different levels into a colour vision network will be of high importance for a better understanding of the neuronal mechanisms of visual perception.
Supplementary Material
Supplementary Material
Acknowledgements
We thank Vera Mayer for her great assistance with behavioural experiments and neuronal analysis, Stephanie Mildner for help with marking ants and Flavio Roces for the supply of ants.
Data accessibility
All raw data for behavioural experiments and neuronal analysis are provided as electronic supplementary material.
Authors' contributions
A.Y., J.S. and W.R. conceived and designed the study. A.Y. and K.G. collected and A.Y. analysed the data. A.Y. drafted and J.S. and W.R. revised the manuscript. All authors gave final approval for publication.
Competing interests
We declare we have no competing interests.
Funding
This work was supported by the Women's Bureau of the Julius-Maximilians-Universität Würzburg (Scientia program); Bavarian Gender Equality Grant (BGF) to A.Y. and the German Research Foundation (DFG), Collaborative Research Center SFB 1047 ‘Insect timing’ (Projects B3 and B6) to J.S. and W.R.
References
- 1.Kelber A, Vorobyev M, Osorio D. 2003. Animal colour vision—behavioural tests and physiological concepts. Biol. Rev. Camb. Philos. Soc. 78, 81–118. ( 10.1017/S1464793102005985) [DOI] [PubMed] [Google Scholar]
- 2.Jacobs GH. 2018. Photopigments and the dimensionality of animal color vision. Neurosci. Biobehav. Rev. 86, 108–130. ( 10.1016/j.neubiorev.2017.12.006) [DOI] [PubMed] [Google Scholar]
- 3.Dyer AG, Paulk AC, Reser DH. 2011. Colour processing in complex environments: Insights from the visual system of bees. Proc. R. Soc. B 278, 952–959. ( 10.1098/rspb.2010.2412) [DOI] [PMC free article] [PubMed] [Google Scholar]
- 4.Avarguès-Weber A, Giurfa M. 2014. Cognitive components of color vision in honey bees: how conditioning variables modulate color learning and discrimination. J. Comp. Physiol. A Neuroethol. Sensory Neural Behav. Physiol. 200, 449–461. ( 10.1007/s00359-014-0909-z) [DOI] [PubMed] [Google Scholar]
- 5.Kemp DJ, Herberstein ME, Fleishman LJ, Endler JA, Bennett ATD, Dyer AG, Hart NS, Marshall J, Whiting MJ. 2015. An integrative framework for the appraisal of coloration in nature. Am. Nat. 185, 705–724. ( 10.1086/681021) [DOI] [PubMed] [Google Scholar]
- 6.Pichaud F, Briscoe A, Desplan C. 1999. Evolution of color vision. Curr. Opin Neurobiol. 9, 622–627. ( 10.1016/S0959-4388(99)00014-8) [DOI] [PubMed] [Google Scholar]
- 7.Song B-M, Lee C-H. 2018. Toward a mechanistic understanding of color vision in insects. Front. Neural Circuits 12, 1–9. ( 10.3389/fncir.2018.00016) [DOI] [PMC free article] [PubMed] [Google Scholar]
- 8.Kulikowski JJ, Walsh V. 1991. On the limits of colour detection and discrimination, pp. 202–220. London, UK: Macmillian Press. [Google Scholar]
- 9.Zeki S, Marini L. 1998. Three cortical stages of colour processing in the human brain. Brain 121, 1669–1685. ( 10.1093/brain/121.9.1669) [DOI] [PubMed] [Google Scholar]
- 10.Paulk AC, Dacks AM, Gronenberg W. 2009. Color processing in the medulla of the bumblebee (Apidae: Bombus impatiens). J. Comp. Neurol. 513, 441–456. ( 10.1002/cne.21993) [DOI] [PMC free article] [PubMed] [Google Scholar]
- 11.Paulk AC, Dacks AM, Phillips-Portillo J, Fellous J-M, Gronenberg W. 2009. Visual processing in the central bee brain. J. Neurosci. 29, 9987–9999. ( 10.1523/JNEUROSCI.1325-09.2009) [DOI] [PMC free article] [PubMed] [Google Scholar]
- 12.Yang EC, Lin HC, Hung YS. 2004. Patterns of chromatic information processing in the lobula of the honeybee, Apis mellifera L. J. Insect Physiol. 50, 913–925. ( 10.1016/j.jinsphys.2004.06.010) [DOI] [PubMed] [Google Scholar]
- 13.Osorio D. 1987. The temporal properties of non-linear, transient cells in the locust medulla. J. Comp. Physiol. A 161, 431–440. ( 10.1007/BF00603968) [DOI] [Google Scholar]
- 14.Kien J, Menzel R. 1977. Chromatic properties of interneurons in the optic lobes of the bee. J. Comp. Physiol. A 113, 35–53. ( 10.1007/bf00610452) [DOI] [Google Scholar]
- 15.Schnaitmann C, Haikala V, Abraham E, Oberhauser V, Thestrup T, Griesbeck O, Reiff DF. 2018. Color processing in the early visual system of Drosophila. Cell 172, 318–330. ( 10.1016/j.cell.2017.12.018) [DOI] [PubMed] [Google Scholar]
- 16.de Souza J, Hertel H, Ventura DF, Menzel R. 1992. Response properties of stained monopolar cells in the honeybee lamina. J. Comp. Physiol. A 170, 267–274. ( 10.1007/BF00191414) [DOI] [Google Scholar]
- 17.Takemura SY, Kinoshita M, Arikawa K. 2005. Photoreceptor projection reveals heterogeneity of lamina cartridges in the visual system of the Japanese yellow swallowtail butterfly, Papilio xuthus. J. Comp. Neurol. 483, 341–350. ( 10.1002/cne.20446) [DOI] [PubMed] [Google Scholar]
- 18.Strausfeld NJ, Hansen L, Li Y, Gomez RS, Ito K. 1998. Evolution, discovery, and interpretations of arthropod mushroom bodies. Learn. Mem. 5, 11–37. ( 10.1101/lm.5.1.11) [DOI] [PMC free article] [PubMed] [Google Scholar]
- 19.Menzel R. 1999. Memory dynamics in the honeybee. J. Comp. Physiol. A Sensory Neural Behav. Physiol. 185, 323–340. ( 10.1007/s003590050392) [DOI] [Google Scholar]
- 20.Gronenberg W. 2001. Subdivisions of hymenopteran mushroom body calyces by their afferent supply. J. Comp. Neurol. 435, 474–489. ( 10.1002/cne.1045) [DOI] [PubMed] [Google Scholar]
- 21.Pfeiffer K, Homberg U. 2014. Organization and functional roles of the central complex in the insect brain. Annu. Rev. Entomol. 59, 165–184. ( 10.1146/annurev-ento-011613-162031) [DOI] [PubMed] [Google Scholar]
- 22.Heisenberg M. 2003. Mushroom body memoir: from maps to models. Nat. Rev. Neurosci. 4, 266–275. ( 10.1038/nrn1074) [DOI] [PubMed] [Google Scholar]
- 23.Giurfa M. 2007. Behavioral and neural analysis of associative learning in the honeybee: a taste from the magic well. J. Comp. Physiol. A 193, 801–824. ( 10.1007/s00359-007-0235-9) [DOI] [PubMed] [Google Scholar]
- 24.Hourcade B, Muenz TS, Sandoz JC, Rossler W, Devaud JM. 2010. Long-term memory leads to synaptic reorganization in the mushroom bodies: a memory trace in the insect brain? J. Neurosci. 30, 6461–6465. ( 10.1523/JNEUROSCI.0841-10.2010) [DOI] [PMC free article] [PubMed] [Google Scholar]
- 25.Falibene A, Roces F, Rössler W. 2015. Long-term avoidance memory formation is associated with a transient increase in mushroom body synaptic complexes in leaf-cutting ants. Front. Behav. Neurosci. 9, 1–13. ( 10.3389/fnbeh.2015.00084) [DOI] [PMC free article] [PubMed] [Google Scholar]
- 26.Devaud J-M, Papouin T, Carcaud J, Sandoz J-C, Grünewald B, Giurfa M. 2015. Neural substrate for higher-order learning in an insect: mushroom bodies are necessary for configural discriminations. Proc. Natl Acad. Sci. USA 112, E5854–E5862. ( 10.1073/pnas.1508422112) [DOI] [PMC free article] [PubMed] [Google Scholar]
- 27.Liu G, Seiler H, Wen A, Zars T, Ito K, Wolf R, Heisenberg M, Liu L. 2006. Distinct memory traces for two visual features in the Drosophila brain. Nature 439, 551–556. ( 10.1038/nature04381) [DOI] [PubMed] [Google Scholar]
- 28.Neuser K, Triphan T, Mronz M, Poeck B, Strauss R. 2008. Analysis of a spatial orientation memory in Drosophila. Nature 453, 1244–1247. ( 10.1038/nature07003) [DOI] [PubMed] [Google Scholar]
- 29.Stieb SM, Muenz TS, Wehner R, Rössler W. 2010. Visual experience and age affect synaptic organization in the mushroom bodies of the desert ant Cataglyphis fortis. Dev. Neurobiol. 70, 408–423. ( 10.1002/dneu.20785) [DOI] [PubMed] [Google Scholar]
- 30.Stieb SM, Hellwig A, Wehner R, Rössler W. 2012. Visual experience affects both behavioral and neuronal aspects in the individual life history of the desert ant Cataglyphis fortis. Dev. Neurobiol. 72, 729–742. ( 10.1002/dneu.20982) [DOI] [PubMed] [Google Scholar]
- 31.Scholl C, Kubert N, Muenz TS, Rossler W. 2015. CaMKII knockdown affects both early and late phases of olfactory long-term memory in the honeybee. J. Exp. Biol. 218, 3788–3796. ( 10.1242/jeb.124859) [DOI] [PubMed] [Google Scholar]
- 32.Muenz TS, Groh C, Maisonnasse A, Le Conte Y, Plettner E, Rössler W. 2015. Neuronal plasticity in the mushroom body calyx during adult maturation in the honeybee and possible pheromonal influences. Dev. Neurobiol. 75, 1368–1384 ( 10.1002/dneu.22290) [DOI] [PubMed] [Google Scholar]
- 33.Yilmaz A, Lindenberg A, Albert S, Grübel K, Spaethe J, Rössler W, Groh C. 2016. Age-related and light-induced plasticity in opsin gene expression and in primary and secondary visual centers of the nectar-feeding ant Camponotus rufipes. Dev. Neurobiol. 76, 1041–1057. ( 10.1002/dneu.22374) [DOI] [PubMed] [Google Scholar]
- 34.Barth M, Heisenberg M. 1997. Vision affects mushroom bodies and central complex in Drosophila melanogaster. Learn. Mem. 4, 219–229. ( 10.1101/lm.4.2.219) [DOI] [PubMed] [Google Scholar]
- 35.Grob R, Fleischmann PN, Grübel K, Wehner R, Rössler W. 2017. The role of celestial compass information in cataglyphis ants during learning walks and for neuroplasticity in the central complex and mushroom bodies. Front. Behav. Neurosci. 11, 1–14. ( 10.3389/fnbeh.2017.00226) [DOI] [PMC free article] [PubMed] [Google Scholar]
- 36.Vogt K, Schnaitmann C, Dylla KV, Knapek S, Aso Y, Rubin GM, Tanimoto H. 2014. Shared mushroom body circuits underlie visual and olfactory memories in Drosophila. Elife 3, e02395 ( 10.7554/eLife.02395) [DOI] [PMC free article] [PubMed] [Google Scholar]
- 37.Sommerlandt FMJ, Spaethe J, Rössler W, Dyer AG. 2016. Does fine color discrimination learning in free-flying honeybees change mushroom-body calyx neuroarchitecture? PLoS ONE 11, 1–17. ( 10.1371/journal.pone.0164386) [DOI] [PMC free article] [PubMed] [Google Scholar]
- 38.Plath JA, Entler BV, Kirkerud NH, Schlegel U, Galizia CG, Barron AB. 2017. Different roles for honey bee mushroom bodies and central complex in visual learning of colored lights in an aversive conditioning assay. Front. Behav. Neurosci. 11, 98 ( 10.3389/fnbeh.2017.00098) [DOI] [PMC free article] [PubMed] [Google Scholar]
- 39.Li L, MaBouDi H, Egertová M, Elphick MR, Chittka L, Perry CJ. 2017. A possible structural correlate of learning performance on a colour discrimination task in the brain of the bumblebee. Proc. R. Soc. B 284, 20171323 ( 10.1098/rspb.2017.1323) [DOI] [PMC free article] [PubMed] [Google Scholar]
- 40.Pfeiffer K, Homberg U. 2007. Coding of azimuthal directions via time-compensated combination of celestial compass cues. Curr. Biol. 17, 960–965. ( 10.1016/j.cub.2007.04.059) [DOI] [PubMed] [Google Scholar]
- 41.Mota T, Gronenberg W, Giurfa M, Sandoz J-C. 2013. Chromatic processing in the anterior optic tubercle of the honey bee brain. J. Neurosci. 33, 4–16. ( 10.1523/JNEUROSCI.1412-12.2013) [DOI] [PMC free article] [PubMed] [Google Scholar]
- 42.Aptekar JW, Kele MF, Lu PM, Zolotova NM, Frye MA. 2015. Neurons forming optic glomeruli compute figure-ground discriminations in Drosophila. J. Neurosci. 35, 7587–7599. ( 10.1523/JNEUROSCI.0652-15.2015) [DOI] [PMC free article] [PubMed] [Google Scholar]
- 43.Gronenberg W. 2008. Structure and function of ant (Hymenoptera: Formicidae) brains: strength in numbers. Myrmecol. News 11, 25–36. [Google Scholar]
- 44.Groh C, Kelber C, Grübel K, Rössler W. 2014. Density of mushroom body synaptic complexes limits intraspecies brain miniaturization in highly polymorphic leaf-cutting ant workers. Proc. R. Soc. B 281, 20140432 ( 10.1098/rspb.2014.0432) [DOI] [PMC free article] [PubMed] [Google Scholar]
- 45.Yilmaz A, Dyer AG, Rössler W, Spaethe J. 2017. Innate colour preference, individual learning and memory retention in the ant Camponotus blandus. J. Exp. Biol. 220, 3315–3326. ( 10.1242/jeb.158501) [DOI] [PubMed] [Google Scholar]
- 46.Wittstock S, Menzel R. 1994. Color learning and memory in honey bees are not affected by protein synthesis inhibition. Behav. Neural Biol. 62, 224–229. ( 10.1016/S0163-1047(05)80020-2) [DOI] [PubMed] [Google Scholar]
- 47.Dyer AG, Garcia JE. 2014. Color difference and memory recall in free-flying honeybees: forget the hard problem. Insects 5, 629–638. ( 10.3390/insects5030629) [DOI] [PMC free article] [PubMed] [Google Scholar]
- 48.Lichtenstein L, Sommerlandt FMJ, Spaethe J. 2015. Dumb and lazy? A comparison of color learning and memory retrieval in drones and workers of the buff-tailed bumblebee, Bombus terrestris, by means of PER conditioning. PLoS ONE 10, e0134248 ( 10.1371/journal.pone.0134248) [DOI] [PMC free article] [PubMed] [Google Scholar]
- 49.Weber NA. 1946. Dimorphism in the African Oecophylla worker and an anomaly (Hym.: Formicidae). Ann. Entomol. Soc. Am. 39, 7–10. ( 10.1093/aesa/39.1.7) [DOI] [Google Scholar]
- 50.Szyszka P. 2008. Associative and non-associative plasticity in Kenyon cells of the honeybee mushroom body. Front. Syst. Neurosci. 2, 1–10. ( 10.3389/neuro.06.003.2008) [DOI] [PMC free article] [PubMed] [Google Scholar]
- 51.Groh C, Lu Z, Meinertzhagen IA, Rössler W. 2012. Age-related plasticity in the synaptic ultrastructure of neurons in the mushroom body calyx of the adult honeybee Apis mellifera. J. Comp. Neurol. 520, 3509–3527. ( 10.1002/cne.23102) [DOI] [PubMed] [Google Scholar]
- 52.Strausfeld NJ. 2002. Organization of the honey bee mushroom body: representation of the calyx within the vertical and gamma lobes. J. Comp. Neurol. 450, 4–33. ( 10.1002/cne.10285) [DOI] [PubMed] [Google Scholar]
- 53.Menzel R. 2001. Searching fort the memory trace in a mini-brain, the honeybee. Learn. Mem. 8, 53–62. ( 10.1101/lm.38801.logeny) [DOI] [PubMed] [Google Scholar]
- 54.Heisenberg M, Heusipp M, Wanke C. 1995. Structural plasticity in the Drosophila brain. J. Neurosci. 15, 1951–1960. ( 10.1523/JNEUROSCI.15-03-01951.1995) [DOI] [PMC free article] [PubMed] [Google Scholar]
- 55.Barth M, Hirsch HVB, Meinertzhagen IA, Heisenberg M.. 1997. Experience-dependent developmental plasticity in the optic lobe of Drosophila melanogaster. J. Neurosci. 17, 1493–1504. ( 10.1523/JNEUROSCI.17-04-01493.1997) [DOI] [PMC free article] [PubMed] [Google Scholar]
- 56.Kral K, Meinertzhagen IA. 1989. Anatomical plasticity of synapses in the lamina of the optci lobe of the fly. Phil. Trans. R. Soc. Lond. B 323, 155–183. ( 10.1098/rstb.1989.0004) [DOI] [PubMed] [Google Scholar]
- 57.Pan Y, Zhou Y, Guo C, Gong H, Gong Z, Liu L. 2009. Differential roles of the fan-shaped body and the ellipsoid body in Drosophila visual pattern memory. Learn. Mem. 16, 289–295. ( 10.1101/lm.1331809) [DOI] [PubMed] [Google Scholar]
- 58.Mota T, Kreissl S, Carrasco Durán A, Lefer D, Galizia G, Giurfa M. 2016. Synaptic organization of microglomerular clusters in the lateral and medial bulbs of the honeybee brain. Front. Neuroanat. 10, 1–17. ( 10.3389/fnana.2016.00103) [DOI] [PMC free article] [PubMed] [Google Scholar]
- 59.Triphan T, Poeck B, Neuser K, Strauss R. 2010. Visual targeting of motor actions in climbing Drosophila. Curr. Biol. 20, 663–668. ( 10.1016/j.cub.2010.02.055) [DOI] [PubMed] [Google Scholar]
- 60.Zhang K, Guo JZ, Peng Y, Xi W, Guo A. 2007. Dopamine-mushroom body circuit regulates saliency-based decision-making in Drosophila. Science 316, 1901–1904. ( 10.1126/science.1137357) [DOI] [PubMed] [Google Scholar]
- 61.Peng Y, Xi W, Zhang W, Zhang K, Guo A. 2007. Experience improves feature extraction in Drosophila. J. Neurosci. 27, 5139–5145. ( 10.1523/JNEUROSCI.0472-07.2007) [DOI] [PMC free article] [PubMed] [Google Scholar]
- 62.Ehmer B, Gronenberg W. 2004. Mushroom body volumes and visual interneurons in ants: comparison between sexes and castes. J. Comp. Neurol. 469, 198–213. ( 10.1002/cne.11014) [DOI] [PubMed] [Google Scholar]
- 63.Farris SM, Robinson GE, Fahrbach SE. 2001. Experience- and age-related outgrowth of intrinsic neurons in the mushroom bodies of the adult worker honeybee. J. Neurosci. 21, 6395–6404. ( 10.1523/JNEUROSCI.21-16-06395.2001) [DOI] [PMC free article] [PubMed] [Google Scholar]
- 64.Frambach I, Rössler W, Winkler M, Schürmann F-W. 2004. F-actin at identified synapses in the mushroom body neuropil of the insect brain. J. Comp. Neurol. 475, 303–314. ( 10.1002/cne.20165) [DOI] [PubMed] [Google Scholar]
- 65.Rybak J, Menzel R. 1993. Anatomy of the mushroom bodies in the honey bee brain: the neuronal connections of the alpha-lobe. J. Comp. Neurol. 334, 444–465. ( 10.1002/cne.903340309) [DOI] [PubMed] [Google Scholar]
- 66.Hu A, Zhang W, Wang Z. 2010. Functional feedback from mushroom bodies to antennal lobes in the Drosophila olfactory pathway. Proc. Natl Acad. Sci. USA 107, 10 262–10 267. ( 10.1073/pnas.0914912107) [DOI] [PMC free article] [PubMed] [Google Scholar]
- 67.Strube-Bloss MF, Herrera-Valdez MA, Smith BH. 2012. Ensemble response in mushroom body output neurons of the honey bee outpaces spatiotemporal odor processing two synapses earlier in the antennal lobe. PLoS ONE 7, 1–13. ( 10.1371/journal.pone.0050322) [DOI] [PMC free article] [PubMed] [Google Scholar]
- 68.Strube-Bloss MF, Rössler W. 2018. Multimodal integration and stimulus categorization in putative mushroom body output neurons of the honeybee. R. Soc. open sci. 5, 171785 ( 10.1098/rsos.171785) [DOI] [PMC free article] [PubMed] [Google Scholar]
Associated Data
This section collects any data citations, data availability statements, or supplementary materials included in this article.
Supplementary Materials
Data Availability Statement
All raw data for behavioural experiments and neuronal analysis are provided as electronic supplementary material.