

Abstract
When confronted with a parasite or pathogen, hosts can defend themselves by resisting or tolerating the attack. While resistance can be diminished when resources are limited, it is unclear how robust tolerance is to changes in environmental conditions. Here, we investigate the sensitivity of tolerance in a single host population living in a highly variable environment. We manipulated the abundance of an invasive parasitic fly, Philornis downsi, in nests of Galápagos mockingbirds (Mimus parvulus) over four field seasons and measured host fitness in response to parasitism. Mockingbird tolerance to P. downsi varied significantly among years and decreased when rainfall was limited. Video observations indicate that parental provisioning of nestlings appears key to tolerance: in drought years, mockingbirds likely do not have sufficient resources to compensate for the effects of P. downsi. These results indicate that host tolerance is a labile trait and suggest that environmental variation plays a major role in mediating the consequences of host–parasite interactions.
Keywords: Galápagos Islands, invasive species, host defence, Philornis downsi, Mimus parvulus
1. Introduction
Hosts defend themselves against parasites using two overall strategies: resistance and tolerance [1–3]. Resistance mechanisms help the host by reducing parasite burden [4]. By contrast, tolerance mechanisms compensate for parasite damage without reducing parasite burden [1,5]. Tolerance has been well studied in plant–herbivore systems [6], but has received less attention as a strategy for defence by animal hosts [2,7,8].
Host defence is not static, but varies with environmental conditions. Resistance has well-documented associations with resource availability and host nutritional status [9–11]. Resistance mechanisms, such as immune responses, are energetically costly, and thus may be diminished under stressful conditions [9,12]. Like resistance, tolerance may also be sensitive to resource availability. However, most studies of animals have focused on differences in tolerance between populations or genotypes, implying that tolerance is a static property [2,13,14]. As a result, relatively little is known about mechanisms or conditions that govern tolerance in animal hosts, compared to resistance.
In plant–herbivore systems, tolerance has complex relationships with resource availability [15]. Early models predicted that, like resistance, tolerance should increase with greater access to resources [16]. However, subsequent experiments produced data both consistent with, and opposite to, this prediction. Rather than a simple positive relationship between tolerance and resource availability, the effects of resource availability on plant tolerance depend on which resources are limiting to plant fitness, and which resources are depleted by herbivores [15].
The relationship between tolerance and resource availability in animal host–parasite systems is probably also complex. Tolerance may increase when resources are abundant if hosts are better able to compensate for energy lost to parasites [17,18]. For example, in an experimental study of the effects of nematodes on Cuban tree frogs (Osteopilus septentrionalis), parasitized frogs were able to maintain body mass when fed on a high resource diet, but not when fed on a low resource diet [18]. On the other hand, like hosts, parasites may benefit from increased resource availability, potentially increasing the damage that they inflict on the host [12,19,20]. Several studies have found reduced host tolerance under high resource conditions, potentially because the parasites were better than the host at exploiting the resource [21–24]. For example, experimental studies show that the tolerance of Drosophila melanogaster to pathogenic bacteria actually decreases on high-yeast and high-sugar diets [22,23].
Most studies on the effect of resource availability on animal host tolerance have been conducted in the laboratory. Therefore, the extent to which tolerance varies in response to natural environmental variation remains poorly understood [2,25]. If tolerance is sensitive to resource availability, it is not a constitutive property of the host, but an outcome of the interaction between host, parasite, and the environment. The strength of this interaction has the potential to affect whether hosts can defend themselves against parasites in changing or variable environments.
In this study, we investigated the tolerance of birds to introduced parasitic nest flies (Philornis downsi) in the Galápagos Islands. Philornis downsi, which is native to mainland South America, was discovered in nests of Galápagos birds in the late 1990s [26]. Adult P. downsi are free-living and feed on organic matter. Female flies lay their eggs in birds' nests. Upon hatching, the larvae feed on blood and tissues of brooding female birds and their nestlings. After three larval instars, the flies pupate in the nest material, after which they emerge as adults [27].
Philornis downsi parasitism causes high nestling mortality in Darwin's finches. Mortality estimates average about 50%, but reach 100% in some studies [28,29]. Galápagos birds appear to have no effective behavioural or immunological resistance against P. downsi [30,31]. Some evidence suggests that nestlings try to resist parasitism by preening off larvae or standing on top of nest mates [32,33]; however, these behavioural responses do not seem to improve the fledging success of parasitized nestlings [30,33].
In contrast to Darwin's finches, Galápagos mockingbirds (Mimus parvulus) tolerate P. downsi. In an experimental study of medium ground finches (Geospiza fortis) and Galápagos mockingbirds, Knutie et al. [31] showed that P. downsi reduced the reproductive success of finches, but had no effect on the reproductive success of mockingbirds. The tolerance of mockingbirds was striking in light of the fact that the density of P. downsi (number of parasites/gram of nestling) did not differ significantly between the two host species. Mockingbirds may be more tolerant to P. downsi than finches in part because mockingbird nestlings are substantially larger than finch nestlings. Their larger size and lower surface area to volume ratio may help mockingbirds better withstand parasitism at night, thus retaining enough energy to beg for food the following morning. Knutie et al. [31] found that host behavioural changes are also linked to tolerance. Parasitized nestlings begged more and were provisioned more by their parents, compared to non-parasitized nestlings. By contrast, finches do not increase provisioning behaviour in response to P. downsi [31,33].
Knutie et al. [31] reported that mockingbirds were tolerant during 2 years of average rainfall. However, the Galápagos Islands have an extremely variable climate, and it is unknown how sensitive mockingbird tolerance is to annual environmental fluctuations. In the Galápagos, rains trigger the growth of vegetation in the arid zone, which leads to higher arthropod abundance [34]. Annual rainfall is unpredictable, causing ‘boom and bust’ cycles. Breeding success of land birds is reduced in dry years when arthropod abundance is low [34,35].
In this study, we experimentally studied tolerance of mockingbirds to P. downsi in 2 years of higher rainfall (2012 and 2013) and 2 years of relatively low rainfall (2015 and 2016). We hypothesized that low resource availability in dry years would limit either host fitness, parasite fitness, or both. If mockingbirds are more limited by resources than P. downsi, we expect tolerance to decrease in dry years. Conversely, if P. downsi is equally or more affected by resource limitation we expect mockingbird tolerance to remain the same across years.
To determine whether the pressure of P. downsi was consistent across years, we quantified parasite abundance and mean size in control nests and measured nestling haemoglobin concentration. Parasite abundance and size were indicators of the burden of parasitism on mockingbirds. Nestling haemoglobin concentration is diminished by ectoparasites as they feed on the host's blood [36,37]. Accordingly, we used reduction in haemoglobin as a measure of the physiological cost of parasitism. To quantify the response of mockingbirds to P. downsi, we measured nestling condition and fledging success. Each year we estimated mockingbird tolerance, defined as the slope of the relationship between host fitness (fledging success) and parasite abundance [38]. We measured variation in provisioning behaviour in parent mockingbirds and nestling stable isotope ratios to infer differences in food availability among years.
2. Material and methods
(a). Study site
The study was conducted from January to April 2015 and 2016 on Santa Cruz Island in the Galápagos archipelago. Previously published data collected from January to April 2012 and 2013 [31] are also used in the analyses. The study site, El Garrapatero, is a 3 × 4 km area in the arid coastal zone, approximately 10 km east of the town of Puerto Ayora. Galápagos mockingbirds are common year-round residents at our study site. Following the onset of the rainy season, mockingbirds build open cup-shaped nests in acacia (Acacia rorudiana) trees or giant prickly pear cacti (Opuntia echios). They lay between one and five eggs, which are incubated by the female for about 15 days [31]. Nestlings are fed by both parents until they fledge at about 14 days of age.
(b). Environmental variation
We used two metrics to evaluate environmental conditions: rainfall data and normalized difference vegetation index (NDVI) data. Daily precipitation data were collected by the Charles Darwin Research Station in Puerto Ayora [39]. We calculated cumulative rainfall during the typical rainy season at our study site (December–March) as well as the cumulative rainfall per nest (total rainfall from the previous 1st of December through to the date of hatching for each nest). We also analysed the relationship between rainfall at Puerto Ayora and vegetation at our field site using NDVI, an index of photosynthesizing vegetation based on the absorption and reflectance of light in satellite images [40]. NDVI and rainfall are highly correlated at our field site (electronic supplementary material, figure S1). Filtered, scaled NDVI data were generated using the MODIS Global Subsetting and Visualization Tool from a representative 2.25 × 2.25 km2 at the centre of our field site every 16 days [41,42]. For our study, we evaluated NDVI values on the date closest to hatching for each nest in order to obtain snapshots of relative vegetation conditions during the nestling period.
(c). Experimental manipulation and parasite quantification
To manipulate parasite abundance, nests were either fumigated with a 1% aqueous permethrin solution (Permectrin™ II), or sham-fumigated with water as a control. Permethrin has been used in several previous studies to eliminate P. downsi larvae [30,33,43]. It has minor, if any, effects on nestlings [44] and degrades upon exposure to UV light [45]. Nests were sprayed soon after the first nestling hatched, and again 5–6 days later. Nestlings, unhatched eggs, and the top layer of the nest were removed during the spraying process, then replaced after the nest dried (less than 10 min). Parents quickly returned to the nest following treatment; we observed no cases of nest abandonment due to treatment.
We quantified P. downsi by collecting each nest soon after nestlings had died or fledged. Mockingbirds do not re-use nests [31]. Nests were carefully dissected within 8 h of collection and the parasites in each nest were counted [30,31,46]. First instar larvae are difficult to quantify from nest contents because they often live subcutaneously in the nestling nares [27]. Thus, the measure of P. downsi abundance we used was the total number of second and third instar larva and pupae in the nest. We also measured the length and width of pupae and calculated the mean pupal volume for each nest. Pupae were reared to the adult stage to confirm that they were P. downsi (no other fly taxa were found in nests).
(d). Nestling growth, condition, and fledging success
In 2012, each nestling was measured within 24 h of hatching and then again at 9–10 days of age [31]. In 2013, 2015, and 2016 nestlings were measured three times: at hatching, at 5–6 days of age, and at 10–11 days of age. At each sampling point, body mass and tarsus length were recorded; at the second and third points, we also recorded the length of the first primary feather [47]. At the second and third sampling points, we took a small blood sample (less than 30 µl) via brachial venipuncture. Haemoglobin concentration was immediately quantified in the field using a HemoCue® HB 201 + portable analyser and approximately 10 µl of blood (haemoglobin was not measured in 2012). Within 6 h of collection, blood samples were spun at 8000 r.p.m. for 10 min to separate plasma and erythrocytes, which were frozen separately in a −20°C freezer. These samples were later transported to the University of Utah in a liquid nitrogen dry shipper for isotope analysis. Nestlings were banded with an individually numbered monel band and a unique combination of colour bands at 9–11 days of age. Fledging was confirmed by locating and identifying banded individuals after leaving the nest (at about 15 days of age).
(e). Provisioning and begging behaviour
We did not directly quantify food availability because we were not confident we could adequately census mockingbirds' broad and varied diet. Instead, we used parental provisioning rates to investigate variation in the amount of food delivered to nestlings. Behaviour was recorded during the hours 06.00–10.00 in 2013, 2015, and 2016 from a haphazard subsample of study nests. Small bullet cameras (31 × 36 mm; Sony SC-IRB) were suspended over nests and connected to portable digital video recorders (DVRs) (Lawmate PV700 Hi-res DVR) hidden at the base of each tree supporting a nest. We quantified behaviour from 51 video observation periods totalling 118 h of video. Videos were analysed using the software Boris version 3.60 [48] by one author (S.M.M.) to avoid inter-observer variation. Provisioning was scored as the per cent of total video time that parents spent inserting food into the mouths of nestlings. In addition to parental provisioning, we also scored nestling begging. Begging was defined as one or more nestlings tilting their head back, with neck extended, and open mouth showing [49]. For each video, time begging was scored as a percentage of total video time.
(f). Blood isotope values
We analysed carbon (δ13C) isotope ratios in 10-day-old nestlings to evaluate variation in their diet between treatments and among years. Carbon stable isotope values distinguish the contributions of different plants in the food chain because carbon fixed by C3 plants is more depleted in C13 isotopes than carbon fixed by CAM and C4 plants [50,51]. C3 vegetation is common at the El Garrapatero field site during rainy conditions. In years with little rain, Opuntia cacti, which use CAM photosynthesis, are the predominant living vegetation. Therefore, we expect nestlings in wetter years to have more depleted δ13C values and nestlings in dry years to have enriched δ13C values.
Stable isotope analysis was performed at the Stable Isotope Ratio Facility for Environmental Research (SIRFER) at the University of Utah. Five microlitres of erythrocytes (approx. 0.5 mg) were pipetted into tin capsules and dried for 48 h at 65°C. Samples were analysed using an elemental analyser attached to an isotope ratio mass spectrometer (EA-IRMS, Thermo Fisher Scientific, Bremen, Germany) operated in continuous flow mode. Laboratory reference materials consisted of two glutamic acids and ground bovine muscle. Stable isotope ratios are reported using the standard δ-notation relative to an international standard in units per mil (‰) using the following: δX = (Rsample/Rstandard − 1) × 1000, where X is the isotope of interest, Rsample and Rstandard are the molar ratios of the heavy to the light isotopes (e.g.13C/12C) of the sample and international standard, respectively.
(g). Statistical analysis
Analyses were conducted in RStudio (2016, version 1.0.136; R version 3.3.3). We ran linear models (LMs), generalized linear models (GLMs), and linear mixed models (LMMs) using the packages ‘MASS’, ‘lmer4’, ‘nlme’, ‘car’, and ‘smart’. Degrees of freedom and p-values for LMMs were calculated using a Satterthwaite approximation with the ‘lmerTest’ package. Post hoc comparisons between years were performed using Tukey's honestly significant difference tests in ‘emmeans’. Parasite abundance, nestling measurements, and behavioural data from 2012 and 2013 were published earlier [31]. For the current study, we directly compared those raw data to new data from 2015 and 2016.
We tested for variation among years in rainfall and NDVI using LMs, modelling each with year as a fixed effect. We tested for variation in nestling isotope ratios using two different LMMs: first, we modelled isotope ratios using the fixed effects of year and treatment and the random effect of nest to test for overall variation among years and between treatments. The effect of treatment was not significant and was removed. Second, we modelled isotope ratios using the fixed effects of rain and NDVI and the random effect of nest to test if nestling isotope ratios were significantly associated with our other indices of environmental conditions. We tested for variation among years in parasite abundance and parasite volume using negative binomial GLMs with year, treatment, and nestling age at collection as fixed effects. Nestling age at collection was not significant for parasite abundance and was removed.
Nestling measurements (mass, tarsus length, first primary feather length, and haemoglobin) were analysed using LMMs with the fixed effects of rain, treatment, age, and clutch size and the random effects of year and individual, nested within mockingbird nest. All models started with a three-way interaction between rain, treatment, and age to test the prediction that nestling growth of parasitized chicks is limited in dry conditions. When the three-way interaction term was not significant (only haemoglobin) it was removed. When the effect of clutch size was not significant (mass and haemoglobin) it was removed. The intercept was set to age 1 for mass and tarsus (the day of hatching), and age 5 for haemoglobin and first primary feather length (the first day of measurement). Haemoglobin values of sham-fumigated (parasitized) nestlings were additionally analysed for variation among years using an LMM with age, year, and their interaction as fixed effects and the random effect of nest.
For analysis of behaviour, per cent time provisioning and per cent time begging were logit transformed and analysed with LMMs with the fixed effects of age, year, clutch size, and treatment, and the random effect of nest. Age and treatment were not significant for provisioning and so were removed.
We tested for variation in fledging success using two different binomial GLMs: first, we modelled fledging success per nest with the fixed effects of treatment, year, and their interaction to test for variation in the fitness cost of P. downsi among years. Second, we modelled fledging success with a GLMM with the fixed effects of treatment, rain, and their interaction, and the random effect of year to test for variation in the fitness cost of P. downsi under different climatic conditions.
(h). Estimation of tolerance
We defined mockingbird tolerance as the slope of the relationship between P. downsi abundance and fledging success [38]. Tolerance was quantified for each year of the study. A slope of zero indicates completely tolerant hosts (i.e. no relationship between parasite abundance and host fitness). More negative slopes show progressively less tolerance. We quantified tolerance using a GLM with binomial errors predicting fledging success per nest (ratio of nestlings that fledged to nestlings that died) with the fixed effects of year, P. downsi abundance, and their interaction. We limited our model to the range of parasite abundance for which we had fledging success data from all years (0–139 parasites; which excludes five nests with more parasites). A significant year × abundance interaction indicates that tolerance differed among years. To estimate tolerance each year and identify differences in tolerance between years, we performed post hoc comparisons using Tukey post hoc tests with the emtrends() function in the package emmeans. This function compares interaction terms (i.e. slopes) between each pair of years while correcting for multiple testing and produces slope estimates for each year.
3. Results
(a). Environmental variation
Rainfall varied substantially among study years (figure 1). The mean rainfall at hatching was higher in 2012 and 2013 than in 2015 and 2016 (LM, p < 0.001; electronic supplementary material, tables S1 and S2). Mean NDVI values during the breeding season ranged from 0.59 in 2015 to 0.62 in 2012 (electronic supplementary material, table S1). NDVI values at hatching were significantly lower in 2015 compared with the other 3 years, intermediate in 2012 and 2016, and highest in 2013 (electronic supplementary material, table S3). Because NDVI values are only taken by satellite every 16 days, multiple nests from a given year had the same NDVI values.
Figure 1.

Cumulative rainfall immediately before and during the typical mockingbird breeding seasons (December–March) at our field site for 2006–2016. Dark grey bars within each study year (2012, 2013, 2015, and 2016) are median rainfall by the date of hatching for nests in the study.
(b). Philornis downsi abundance and size
We studied 30–35 nests per year, for a total of 131 nests (electronic supplementary material, table S4). Mean clutch size did not vary significantly among years or between treatments (LM, p > 0.35). Fumigated nests had fewer parasites than nests sham-fumigated with water in all 4 years (GLM, p < 0.001, electronic supplementary material, table S4). Philornis downsi abundance in sham-fumigated nests did not vary significantly among years (GLM, p > 0.362 for all year by year comparisons; electronic supplementary material, tables S5 and S6). The mean volume of P. downsi pupae was smaller in 2016 than in 2013 (Tukey post hoc adjusted p = 0.001); however, none of the other between-year comparisons differed significantly (electronic supplementary material, table S7).
(c). Nestling isotope values
Nestling δ13C values did not differ significantly between treatments (LMM p = 0.75). However, the values did differ among years: δ13C values were enriched (higher) in 2015, relative to the other 3 years (LMM, p < 0.001 for all comparisons; figure 2; electronic supplementary material, table S8). δ13C values were negatively correlated with NDVI and rainfall values at hatching (LMM rain p = 0.03; NDVI, p < 0.001).
Figure 2.
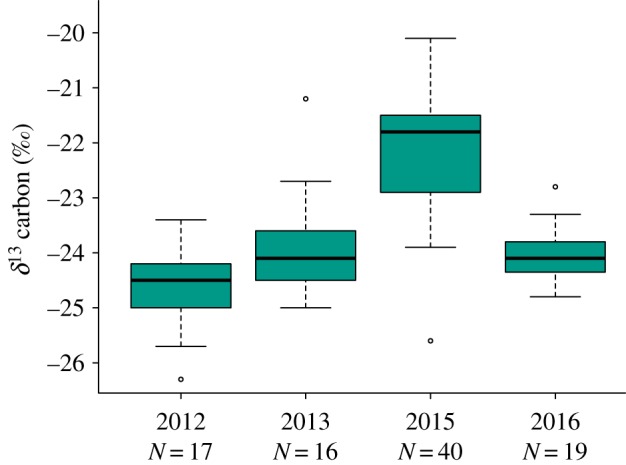
Boxplot showing the δ13 carbon values from nestling blood over the four field seasons. Differences between treatments were not significant and so values were combined. Values from 2015 were higher than other years; no other year by year comparisons were significant. (Online version in colour.)
(d). Nestling growth and condition
All measurements (mass, tarsus, and first primary feather length) increased with age (LMM, p < 0.001, electronic supplementary material, tables S9–S12). Haemoglobin also increased with age, consistent with increased erythropoiesis as nestlings develop (LMM, p < 0.001; electronic supplementary material, table S13) [52]. For mass, tarsus, and first primary feather length, the main effects of treatment and rain were not significant (p > 0.05), meaning that, at hatching, nestlings were the same size regardless of treatment or rain. The interaction of treatment and age was significant, (p < 0.001), indicating that parasitized nestlings grew more slowly than non-parasitized nestlings. The three-way interaction of treatment × rain × age was also significant (p ≤ 0.05), meaning that the cost of parasitism to growth was mitigated by more rainfall. In other words, growth and condition of nestlings was reduced in the sham-fumigated treatment, particularly when rainfall was limited (figure 3). Haemoglobin was reduced in sham-fumigated nestlings in all years (p < 0.001; electronic supplementary material, table S13). However, the effect of treatment on haemoglobin did not vary with rain (three-way interaction p > 0.05). Comparing haemoglobin values of just fumigated nestlings among years, initial (5 day) haemoglobin values were lower in 2016 compared with 2013 (p = 0.001); however, no other year by year differences were significantly different.
Figure 3.
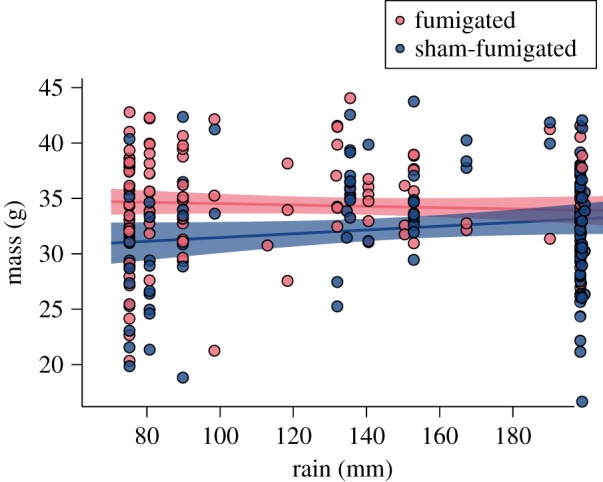
Relationship between rainfall and mass of nestlings at 9–11 days of age. Lines indicate regression lines for fumigated nestlings (no parasites; N = 139) and sham-fumigated nestlings (parasites; N = 120). Shaded regions indicate 95% confidence intervals. Fumigated nestling mass is not significantly associated with rainfall (red line); sham-fumigated nestling mass is positively associated with rainfall (blue line; electronic supplementary material, table S9). (Online version in colour.)
(e). Nestling fledging success
The mean per cent ± s.e. fledging success for fumigated nestlings in each year of our study (2012, 2013, 2015, and 2016) was 77.40 ± 0.09, 66.15 ± 0.11, 59.26 ± 0.07, and 70.83 ± 0.11, respectively. The mean per cent ± s.e. fledging success for sham-fumigated nestlings each year was 79.80 ± 0.08, 66.48 ± 0.10, 19.12 ± 0.07, and 16.67 ± 0.07, respectively (figure 4). The fledging success of fumigated nestlings did not differ significantly between years (binomial GLM; p > 0.11 for all post hoc comparisons; tables S4 and S14). Fledging success did not differ significantly between treatments in 2012 or 2013 (2012 p = 0.97: 2013 p = 0.44). However, fledging success of sham-fumigated nestlings was lower in 2015 and 2016 (p < 0.001 for both). Across all years, rainfall had a positive effect on fledging success (logistic regression, rain p = 0.045; electronic supplementary material, table S15), and parasitism had a negative effect on fledging success (treatment p < 0.001). However, there was an interaction between rainfall and treatment: the likelihood of fledging for sham-fumigated nestlings improved with more rain (treatment × rain p < 0.001).
Figure 4.
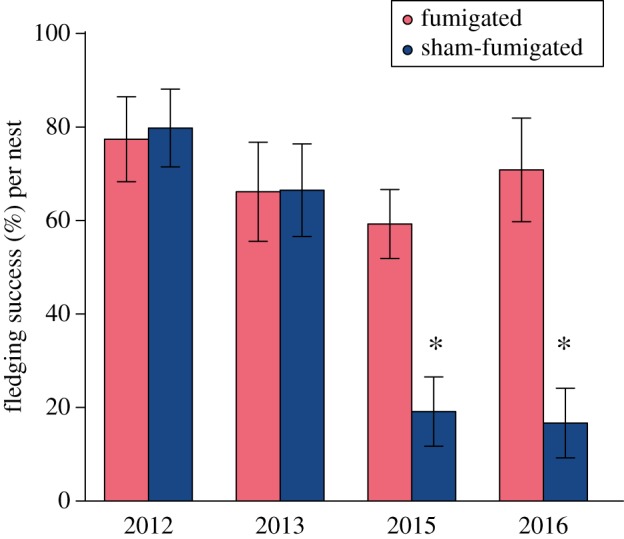
Mean (±s.e.) fledging success per nest in fumigated and sham-fumigated nests over the study period. Fledging success of sham-fumigated nests in 2015 and 2016 (asterisks) was significantly lower than all other groups. (Online version in colour.)
(f). Tolerance
Tolerance varied among years. Philornis downsi abundance was not significantly associated with fledging success in 2012 or 2013 (binomial GLM, 2012 slope estimate: 0.00, 95% CI: −0.01–0.01; 2013 slope estimate: 0.00, 95% CI: −0.01–0.01, electronic supplementary material, table S16; figure 5). By contrast, P. downsi abundance was negatively correlated with fledging success in 2015 (slope estimate: −0.03, 95% CI:−0.05 to−0.01), and marginally correlated with fledging success in 2016 (slope estimate: −0.01, 95% CI: −0.02 to 0.00). Tolerance was significantly lower in 2015 than in 2012 and 2013 (Tukey post hoc tests p = 0.01 for both comparisons). No other year × year comparisons were significantly different.
Figure 5.
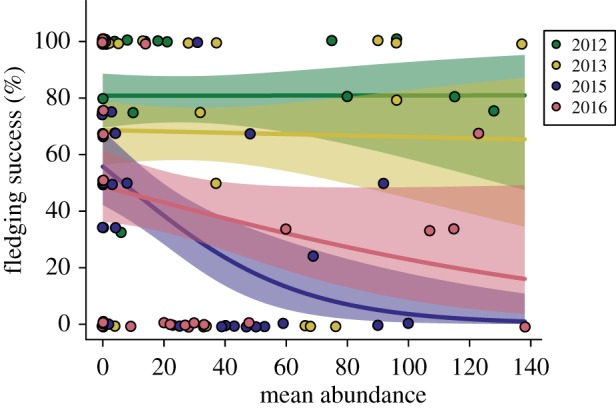
Relationship between abundance of P. downsi and mockingbird fledging success. Each point represents an individual nest (N = 126). Points have been jittered for clarity. Logistic regression lines and shaded 95% confidence intervals are plotted for each year. Steeper slopes indicate lower tolerance. Fledging success was not significantly associated with abundance in 2012 or 2013. Fledging success was marginally associated with abundance in 2016, and was significantly negatively correlated with abundance in 2015 (electronic supplementary material, table S16). (Online version in colour.)
(g). Provisioning and begging behaviour
Nestling begging increased both with nestling age and clutch size (LMM, age p = 0.01, clutch size p = 0.001; electronic supplementary material, table S17). Sham-fumigated nestlings begged more than fumigated nestlings (treatment p = 0.048). Nestlings begged more in 2015 and 2016 than in 2013 (Tukey post hoc comparisons p < 0.01). Provisioning rates did not differ between treatments but increased with clutch size (p < 0.001, electronic supplementary material, table S18). Provisioning rates were significantly lower in 2015 than the other 2 years (Tukey post hoc comparisons p < 0.05). Estimated tolerance increased linearly with mean provisioning rate (LM, R2 = 0.99, p = 0.019; figure 6).
Figure 6.
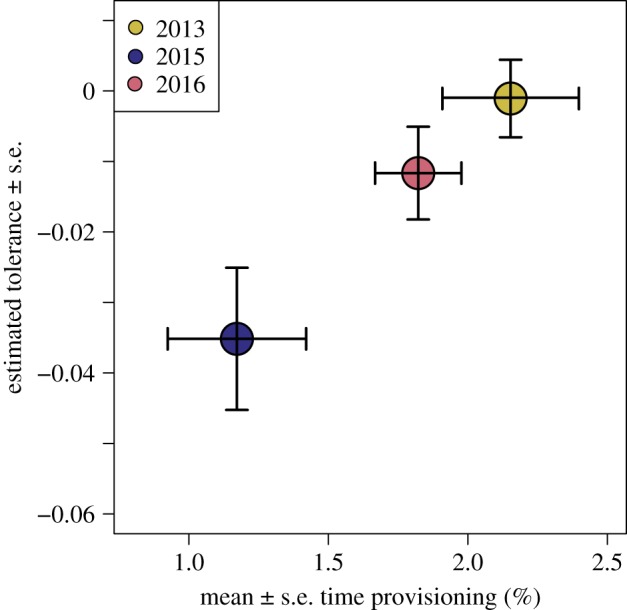
Relationship between mean (±s.e.) time that parents spent provisioning nestlings and tolerance (±s.e.) each year. Provisioning data were not collected in 2012. Annual provisioning rates were based on 15 observation periods in 2013, and 2018 observations in each of 2015 and 2016. Tolerance was calculated from 33 nests in 2013, 34 nests in 2015, and 29 nests in 2016. Tolerance is the slope of the relationship (i.e. GLM estimate) between P. downsi abundance and host fledging success (figure 5). (Online version in colour.)
4. Discussion
Extreme variation in rainfall among years in the Galápagos provides an opportunity to test the extent to which the parasite, the host, or both are sensitive to environmental conditions. In this study, we document a dramatic increase in the costs of P. downsi to mockingbird reproductive success in dry conditions. Philornis downsi abundance in nests at our study site did not vary among years. Although studies report that P. downsi abundance on some islands increases in very wet years [28,53], the prevalence and intensity of P. downsi on Santa Cruz appear relatively constant [27,46]. Philornis downsi pupal volume and haemoglobin values both varied between 2 years (2013 versus 2016). However, pupal volume and haemoglobin values did not differ significantly for most between-year comparisons. Moreover, these values did not significantly differ between the most and least tolerant years. In short, the data suggest the reduced fledging success in parasitized nests in dry years is not because P. downsi larvae themselves cause more damage to nestlings in dry years. Rather, lower fledging success in drier years appears to be due to an inability of birds to compensate for the costs of P. downsi.
Our data further suggest that mockingbird tolerance is correlated with resource availability. Rainfall at our field site was correlated with measures of vegetation (NDVI and nestling carbon isotope values). Provisioning rates were higher in years with higher rainfall and vegetation, consistent with previous work showing a strong relationship between rainfall, food availability, and reproductive success in Galápagos passerines [34,35]. Mockingbird tolerance increased with higher provisioning rates, suggesting that in dry years, when vegetation is scarce and resources limited, mockingbirds cannot provision their nestlings sufficiently to repay the costs of P. downsi.
Our results are based on only 4 years of study, which limits our ability to conclude with certainty that variation in rainfall is the main mechanism driving variation in tolerance. Although rainfall is considered a key environmental variable in the Galápagos, other factors, such as the presence of introduced cats, may increase stress and reduce foraging capabilities of mockingbirds. Because Galápagos mockingbirds can live for 7 or more years and typically have several opportunities to reproduce [35], it is also possible that the costs of reproduction in one year may have carry-over effects in subsequent years. For instance, if tolerance in one reproductive attempt trades-off with future reproductive success, the costs of P. downsi to individual host fitness could fluctuate among years. However, even if the effects of P. downsi on individuals vary, we would expect the mean effects on a population level to be consistent across years.
It is also possible that the interaction between P. downsi and mockingbirds is changing over time. One long-term study of P. downsi in Darwin's finch nests reports that mortality rates of nestlings have increased due to earlier and heavier infestation of nests [54]. Nestling mortality rates are increasing despite a decrease in mean pupal size, which may be an indication that competition among larval flies for scarce resources is limiting the amount they can grow before the host dies. Similarly, we found smaller pupal sizes in the last year of our study, compared to the second year. However, we found no increase in P. downsi abundance. Our study took place over a much shorter time span than the Kleindorfer et al. [54] study (5 years versus 10 years). As a result, further work is needed to infer changes in interactions between mockingbirds and P. downsi.
Fluctuations or the loss of tolerance in mockingbirds could theoretically affect other hosts of P. downsi in the community. Tolerant hosts can serve as reservoirs that maintain or even increase the overall parasite population [31,55]. The presence of a reservoir could increase the prevalence and intensity of parasitism in the nests of vulnerable hosts, such as Darwin's finches. However, a reduction in tolerance of the reservoir host might reduce the population size of the parasite by limiting the number of flies that complete their life cycle before the host dies. Despite this possibility, the abundance of P. downsi in mockingbird nests did not differ among years in our study. Most sham-fumigated nests that failed in 2015 survived at least to the 5–6 day mark, which is likely enough time for P. downsi to complete the larval stages [28]. Moreover, pupal size was not diminished in 2015, the year of lowest tolerance. Since pupal size is associated with future adult fly fecundity [54], reduced host tolerance does not appear to affect parasite fitness. Thus, mockingbirds still have the potential to serve as reservoir hosts even in years of lower tolerance. A direct test of the effect of mockingbirds on P. downsi abundance in finch nests is needed to evaluate whether mockingbirds increase the pressure of this invasive parasite on other host species.
The robustness of tolerance influences its efficacy against novel parasites and pathogens. Tolerance to a new parasite could arise in a population faster than resistance because tolerance mechanisms are not necessarily parasite specific, but may involve general changes in host behaviour that promote recovery from sickness [56]. When the mechanism of tolerance is a response such as increased provisioning, behavioural plasticity can allow hosts to respond quickly to a novel stressor. However, the extent to which behaviours are plastic may be limited by trade-offs with other adaptations and the environment itself [57,58]. Our data indicate that the environment constrains the extent to which behavioural responses confer tolerance.
Whether tolerance or resistance is more robust to environmental fluctuations is unknown. Several studies suggest that resistance and tolerance are negatively correlated, i.e. a host cannot be both resistant and tolerant [4,59]. Selection for different defence strategies may depend on which defence is least dependent on resource availability. Because resistance and tolerance have different implications for host–parasite coevolution, a shift in host defence strategy could, in turn, affect pathogenicity and population dynamics of the parasite [60,61].
Trade-offs between different defence strategies may be particularly relevant for hosts that face consistent parasite pressure, yet live in variable environments, such as Galápagos mockingbirds. The ability to mount a successful defence may become even more challenging in the face of a changing climate [25,62]. Recent models predict increased variability and magnitude of El Niño and La Niña events [63], which are the primary climatic cycles that drive rainfall patterns in the Galápagos [34]. Our data suggest that even short-term environmental variation can generate radically different costs of parasites to host fitness. If climatic variability increases, hosts may be pushed to the limits of what they can tolerate, leading to increased emergence of disease in otherwise non-pathogenetic host–parasite interactions. Continued investigation of the dynamics of host tolerance is necessary to understand the future consequences of parasitism on host fitness and host populations.
Supplementary Material
Acknowledgements
We thank the Galápagos National Park and Charles Darwin Foundation for logistical support and permits. We are grateful for field assistance from Emily DiBlasi, Jordan Herman, Daniela Vargas, Oliver Tiselma, Andrew Bartlow, and Elena Arriero. We thank Jeb Owen, Fred Adler, Franz Goller, Scott Villa, Monte Neate-Clegg, Phillip Dennison, Russell Lenth, and the Philornis Working Group for helpful discussion. We are grateful to the SIRFER facility and Christy Mancuso, Suvankar Chakraborty, and Jim Ehleringer for supporting the isotopic analysis. We thank Paul Tol for colour palette design. We thank two anonymous reviewers for their helpful comments on the manuscript. This publication is contribution number 2240 of the Charles Darwin Foundation for the Galápagos Islands. All applicable institutional guidelines for the care and use of animals were followed.
Data accessibility
Files used for analysis are available in the Dryad Digital Repository: https://dx.doi.org/10.5061/dryad.n11h95s [64]. Files include (1) summary of nests in study, (2) nestling size and condition, and (3) behavioural scores from video analysis.
Authors' contributions
S.M.M., S.A.K., and D.H.C. designed the study and wrote the paper; S.M.M., S.A.K., G.B.G., A.S., A.T., J.Y.R., S.E.B., and D.H.C. collected the data; S.M.M. analysed the data.
Competing interests
We declare we have no competing interests.
Funding
This work was supported by NSF grants DEB-0816877 to D.H.C., DDIG-1701006 to S.M.M. and D.H.C., an NSF Graduate Research Fellowship and a University of Utah Global Change and Sustainability Center (GCSC) Research Grant to S.M..M, and a GCSC Grant, a University of Utah Graduate Research Fellowship and Frank Chapman Research Grant to S.A.K.
References
- 1.Medzhitov R, Schneider DS, Soares MP. 2012. Disease tolerance as a defense strategy. Science 335, 936–941. ( 10.1126/science.1214935) [DOI] [PMC free article] [PubMed] [Google Scholar]
- 2.Kutzer MAM, Armitage SAO. 2016. Maximising fitness in the face of parasites: a review of host tolerance. Zoology 119, 281–289. ( 10.1016/j.zool.2016.05.011) [DOI] [PubMed] [Google Scholar]
- 3.Boots M. 2008. fight or learn to live with the consequences? Trends Ecol. Evol. 23, 245–248. ( 10.1016/j.tree.2008.02.003) [DOI] [PubMed] [Google Scholar]
- 4.Råberg L, Graham AL, Read AF. 2009. Decomposing health: tolerance and resistance to parasites in animals. Proc. R. Soc. B 364, 37–49. ( 10.1098/rstb.2008.0184) [DOI] [PMC free article] [PubMed] [Google Scholar]
- 5.Rauw WM. 2012. Immune response from a resource allocation perspective. Front. Genet. 3, 1–14. ( 10.3389/fgene.2012.00267) [DOI] [PMC free article] [PubMed] [Google Scholar]
- 6.Fornoni J. 2011. Ecological and evolutionary implications of plant tolerance to herbivory. Funct. Ecol. 25, 399–407. ( 10.1111/j.1365-2435.2010.01805.x) [DOI] [Google Scholar]
- 7.Zeller M, Koella JC. 2017. The role of the environment in the evolution of tolerance and resistance to a pathogen. Am. Nat. 190, 389–397. ( 10.1086/692759) [DOI] [PubMed] [Google Scholar]
- 8.Mazé-Guilmo E, Loot G, Páez DJ, Lefèvre T, Blanchet S. 2014. Heritable variation in host tolerance and resistance inferred from a wild host-parasite system. Proc. R. Soc. B 281, 20132567 ( 10.1098/rspb.2013.2567) [DOI] [PMC free article] [PubMed] [Google Scholar]
- 9.Schmid-Hempel P. 2003. Variation in immune defence as a question of evolutionary ecology. Proc. R. Soc. Lond. B 270, 357–366. ( 10.1098/rspb.2002.2265) [DOI] [PMC free article] [PubMed] [Google Scholar]
- 10.Cotter SC, Simpson SJ, Raubenheimer D, Wilson K. 2011. Macronutrient balance mediates trade-offs between immune function and life history traits. Funct. Ecol. 25, 186–198. ( 10.1111/j.1365-2435.2010.01766.x) [DOI] [Google Scholar]
- 11.Ezenwa VO. 2004. Interactions among host diet, nutritional status and gastrointestinal parasite infection in wild bovids. Int. J. Parasitol. 34, 535–542. ( 10.1016/j.ijpara.2003.11.012) [DOI] [PubMed] [Google Scholar]
- 12.Cressler CE, Nelson WA, Day T, Mccauley E. 2014. Disentangling the interaction among host resources, the immune system and pathogens. Ecol. Lett. 17, 284–293. ( 10.1111/ele.12229) [DOI] [PMC free article] [PubMed] [Google Scholar]
- 13.Jokela J, Schmid-Hempel P, Rigby MC. 2000. Dr. Pangloss restrained by the Red Queen – steps towards a unified defence theory. Oikos 89, 267–274. ( 10.1034/j.1600-0706.2000.890207.x) [DOI] [Google Scholar]
- 14.Little TJ, Shuker DM, Colegrave N, Day T, Graham AL. 2010. The coevolution of virulence: tolerance in perspective. PLoS Pathog. 6, e1001006 ( 10.1371/journal.ppat.1001006) [DOI] [PMC free article] [PubMed] [Google Scholar]
- 15.Wise MJ, Abrahamson WG. 2007. Effects of resource availability on tolerance of herbivory: a review and assessment of three opposing models. Am. Nat. 169, 443–454. ( 10.1086/512044) [DOI] [PubMed] [Google Scholar]
- 16.Maschinski J, Whitham TG. 1989. The continuum of plant responses to herbivory: the influence of plant association, nutrient availability, and timing. Am. Nat. 134, 1–19. ( 10.1086/284962) [DOI] [Google Scholar]
- 17.Vale PF, Wilson AJ, Best A, Boots M, Little TJ. 2011. Epidemiological, evolutionary, and coevolutionary implications of context-dependent parasitism. Am. Nat. 177, 510–521. ( 10.1086/659002) [DOI] [PMC free article] [PubMed] [Google Scholar]
- 18.Knutie SA, Wilkinson CL, Wu QC, Ortega CN, Rohr JR. 2017. Host resistance and tolerance of parasitic gut worms depend on resource availability. Oecologia 183, 1031–1040. ( 10.1007/s00442-017-3822-7) [DOI] [PMC free article] [PubMed] [Google Scholar]
- 19.Bedhomme S, Agnew P, Sidobre C, Michalakis Y. 2004. Virulence reaction norms across a food gradient. Proc. R. Soc. Lond. B 271, 739–744. ( 10.1098/rspb.2003.2657) [DOI] [PMC free article] [PubMed] [Google Scholar]
- 20.Hall SR, Simonis JL, Nisbet RM, Tessier AJ, Cáceres CE. 2009. Resource ecology of virulence in a planktonic host-parasite system: an explanation using dynamic energy budgets. Am. Nat. 174, 149–162. ( 10.1086/600086) [DOI] [PubMed] [Google Scholar]
- 21.Ayres JS, Schneider DS. 2009. The role of anorexia in resistance and tolerance to infections in Drosophila. PLoS Biol. 7, e1000150 ( 10.1371/journal.pbio.1000150) [DOI] [PMC free article] [PubMed] [Google Scholar]
- 22.Howick VM, Lazzaro BP. 2014. Genotype and diet shape resistance and tolerance across distinct phases of bacterial infection. BMC Evol. Biol. 14, 56 ( 10.1186/1471-2148-14-56) [DOI] [PMC free article] [PubMed] [Google Scholar]
- 23.Kutzer MAM, Armitage SAO. 2016. The effect of diet and time after bacterial infection on fecundity, resistance, and tolerance in Drosophila melanogaster. Ecol. Evol. 6, 4229–4242. ( 10.1002/ece3.2185) [DOI] [PMC free article] [PubMed] [Google Scholar]
- 24.Cornet S, Bichet C, Larcombe S, Faivre B, Sorci G. 2014. Impact of host nutritional status on infection dynamics and parasite virulence in a bird-malaria system. J. Anim. Ecol. 83, 256–265. ( 10.1111/1365-2656.12113) [DOI] [PubMed] [Google Scholar]
- 25.Decker LE, de Roode JC, Hunter MD.. 2018. Elevated atmospheric concentrations of carbon dioxide reduce monarch tolerance and increase parasite virulence by altering the medicinal properties of milkweeds. Ecol. Lett. 21, 1353–1363. ( 10.1111/ele.13101) [DOI] [PubMed] [Google Scholar]
- 26.Fessl B, Couri MS, Tebbich S. 2001. Philornis downsi Dodge & Aitken, new to the Galapagos Islands (Diptera, Muscidae). Stud. Dipterol. 8, 317–322. [Google Scholar]
- 27.Fessl B, Sinclair BJ, Kleindorfer S. 2006. The life-cycle of Philornis downsi (Diptera: Muscidae) parasitizing Darwin's finches and its impacts on nestling survival. Parasitology 133, 739–747. ( 10.1017/S0031182006001089) [DOI] [PubMed] [Google Scholar]
- 28.McNew SM, Clayton DH. 2018. Alien invasion: biology of Philornis flies highlighting P. downsi, an introduced parasite of Galápagos birds. Annu. Rev. Entomol. 63, 369–387. ( 10.1146/annurev-ento-020117-043103) [DOI] [PubMed] [Google Scholar]
- 29.Kleindorfer S, Dudaniec RY. 2016. Host-parasite ecology, behavior and genetics: a review of the introduced fly parasite Philornis downsi and its Darwin's finch hosts. BMC Zool. 1, 1 ( 10.1186/s40850-016-0003-9) [DOI] [Google Scholar]
- 30.Koop JAH, Owen JP, Knutie SA, Aguilar MA, Clayton DH. 2013. Experimental demonstration of a parasite-induced immune response in wild birds: Darwin's finches and introduced nest flies. Ecol. Evol. 3, 2514–2523. ( 10.1002/ece3.651) [DOI] [PMC free article] [PubMed] [Google Scholar]
- 31.Knutie SA, et al. 2016. Galápagos mockingbirds tolerate introduced parasites that affect Darwin's finches. Ecology 97, 940–950. ( 10.1890/15-0119.1) [DOI] [PubMed] [Google Scholar]
- 32.O'Connor JA, Robertson J, Kleindorfer S. 2010. Video analysis of host–parasite interactions in nests of Darwin's finches. Oryx 44, 588–594. ( 10.1017/S0030605310000086) [DOI] [Google Scholar]
- 33.O'Connor JA, Robertson J, Kleindorfer S. 2014. Darwin's finch begging intensity does not honestly signal need in parasitised nests. Ethology 120, 228–237. ( 10.1111/eth.12196) [DOI] [Google Scholar]
- 34.Grant PR, Grant BR. 2014. 40 years of evolution. Princeton, NJ: Princeton University Press. [Google Scholar]
- 35.Curry RL, Grant PR. 1989. Demography of the cooperatively breeding Galápagos mockingbird (Nesomimus parvulus) in a climactically variable environment. J. Anim. Ecol. 1, 441–463. ( 10.2307/4841) [DOI] [Google Scholar]
- 36.Dudaniec RY, Kleindorfer S, Fessl B. 2006. Effects of the introduced ectoparasite Philornis downsi on haemoglobin level and nestling survival in Darwin's small ground finch (Geospiza fuliginosa). Austral Ecol. 31, 88–94. ( 10.1111/j.1442-9993.2006.01553.x) [DOI] [Google Scholar]
- 37.O'Brien EL, Morrison BL, Johnson LS. 2001. Assessing the effects of haematophagous ectoparasites on the health of nestling birds: Haematocrit vs haemoglobin levels in House Wrens parasitized by blow fly larvae. J. Avian Biol. 32, 73–76. ( 10.1034/j.1600-048X.2001.320110.x) [DOI] [Google Scholar]
- 38.Simms EL. 2000. Defining tolerance as a norm of reaction. Evol. Ecol. 14, 563–570. ( 10.1023/A:1010956716539) [DOI] [Google Scholar]
- 39.Charles Darwin Foundation. 2018. CDF Meteorological Database - Base de datos meterologico de la FCD. Online data portal - portal de datos en linea. See http://www.darwinfoundation.org/datazone/climate/ Last updated 31 January 2018.
- 40.Anyamba A, Tucker CJ. 2005. Analysis of Sahelian vegetation dynamics using NOAA-AVHRR NDVI data from 1981–2003. J. Arid Environ. 63, 596–614. ( 10.1016/j.jaridenv.2005.03.007) [DOI] [Google Scholar]
- 41.ORNL-DAAC. 2017. MODIS Collection 6 Land Products Global Subsetting and Visualization Tool. ORNL DAAC, Oak Ridge, Tennessee, USA. Accessed 13 January 2018. Subset obtained for MOD13Q1 product at 0.6848S,90.2236 W, time period: 2012-01-01 to 2016-12-18, and subset size: 2. See 10.3334/ORNLDAAC/1379. [DOI]
- 42.Didan K. 2015. MOD13Q1 MODIS/Terra vegetation indices 16-day L3 global 250 m SIN grid V006. NASA EOSDIS Land Processes DAAC.
- 43.Fessl B, Kleindorfer S, Tebbich S. 2006. An experimental study on the effects of an introduced parasite in Darwin's finches. Biol. Conserv. 127, 55–61. ( 10.1016/j.biocon.2005.07.013) [DOI] [Google Scholar]
- 44.López-Arrabé J, Cantarero A, Pérez-Rodríguez L, Palma A, Moreno J. 2014. Experimental pyrethroid treatment underestimates the effects of ectoparasites in cavity-nesting birds due to toxicity. Ibis 156, 606–614. ( 10.1111/ibi.12160) [DOI] [Google Scholar]
- 45.Elliott M, Janes NF, Potter C. 1978. The future of pyrethroids in insect control. Annu. Rev. Entomol. 23, 443–469. [Google Scholar]
- 46.Koop JAH, Le Bohec C, Clayton DH.. 2013. Dry year does not reduce invasive parasitic fly prevalence or abundance in Darwin's finch nests. Rep. Parasitol. 3, 11–17. ( 10.2147/RIP.S48435) [DOI] [Google Scholar]
- 47.Koop JAH, Huber SK, Laverty SM, Clayton DH. 2011. Experimental demonstration of the fitness consequences of an introduced parasite of Darwin's finches. PLoS ONE 6, e19706 ( 10.1371/journal.pone.0019706) [DOI] [PMC free article] [PubMed] [Google Scholar]
- 48.Friard O, Gamba M. 2016. BORIS: a free, versatile open-source event-logging software for video/audio coding and live observations. Methods Ecol. Evol. 7, 1325–1330. ( 10.1111/2041-210X.12584) [DOI] [Google Scholar]
- 49.Christe P, Richner H, Oppliger A. 1996. Begging, food provisioning, and nestling competition in great tit broods infested with ectoparasites. Behav. Ecol. 7, 127–131. ( 10.1093/beheco/7.2.127) [DOI] [Google Scholar]
- 50.Kelly JF. 2000. Stable isotopes of carbon and nitrogen in the study of avian and mammalian trophic ecology. Can. J. Zool. 78, 1–27. ( 10.1139/z99-165) [DOI] [Google Scholar]
- 51.Wolf BO, Martinez del Rio C. 2000. Use of saguaro fruit by white-winged doves: isotopic evidence of a tight ecological association. Oecologia 124, 536–543. ( 10.1007/s004420000406) [DOI] [PubMed] [Google Scholar]
- 52.Fair J, Whitaker S, Pearson B. 2007. Sources of variation in haematocrit in birds. Ibis 149, 535–552. ( 10.1111/j.1474-919X.2007.00680.x) [DOI] [Google Scholar]
- 53.Dudaniec RY, Fessl B, Kleindorfer S. 2007. Interannual and interspecific variation in intensity of the parasitic fly, Philornis downsi, in Darwin's finches. Biol. Conserv. 139, 325–332. ( 10.1016/j.biocon.2007.07.006) [DOI] [Google Scholar]
- 54.Kleindorfer S, Peters KJ, Custance G, Dudaniec RY, Connor JAO. 2014. Changes in Philornis infestation behavior threaten Darwin's finch survival. Curr. Zool. 60, 542–550. ( 10.1093/czoolo/60.4.542) [DOI] [Google Scholar]
- 55.Haydon DT, Cleaveland S, Taylor LH, Laurenson MK. 2002. Identifying reservoirs of infection: a conceptual and practical challenge. Emerg. Infect. Dis. 8, 1468–1473. ( 10.3201/eid0812.010317) [DOI] [PMC free article] [PubMed] [Google Scholar]
- 56.Adelman JS, Hawley DM. 2017. Tolerance of infection: a role for animal behavior, potential immune mechanisms, and consequences for parasite transmission. Horm. Behav. 88, 79–86. ( 10.1016/j.yhbeh.2016.10.013) [DOI] [PubMed] [Google Scholar]
- 57.Relyea RA. 2001. Morphological and behavioral plasticity of larval anurans in response to different predators. Ecology 82, 523–540. ( 10.1890/0012-9658(2001)082[0523:MABPOL]2.0.CO;2) [DOI] [Google Scholar]
- 58.Sih A, Bell A, Johnson JC. 2004. Behavioral syndromes: an ecological and evolutionary overview. Trends Ecol. Evol. 19, 372–378. ( 10.1016/j.tree.2004.04.009) [DOI] [PubMed] [Google Scholar]
- 59.Sears BF, Snyder PW, Rohr JR. 2015. Host life history and host-parasite syntopy predict behavioural resistance and tolerance of parasites. J. Anim. Ecol. 84, 625–636. ( 10.1111/1365-2656.12333) [DOI] [PMC free article] [PubMed] [Google Scholar]
- 60.Roy BA, Kirchner JW. 2000. Evolutionary dynamics of pathogen resistance and tolerance. Evolution 54, 51–63. ( 10.1111/j.0014-3820.2000.tb00007.x) [DOI] [PubMed] [Google Scholar]
- 61.Miller MR, White A, Boots M. 2005. The evolution of host resistance: tolerance and control as distinct strategies. J. Theor. Biol. 236, 198–207. ( 10.1016/j.jtbi.2005.03.005) [DOI] [PubMed] [Google Scholar]
- 62.Altizer S, Ostfeld RS, Johnson PTJ, Kutz S, Harvell CD. 2013. Climate change and infectious diseases: from evidence to a predictive framework. Science 341, 514–519. ( 10.1126/science.1239401) [DOI] [PubMed] [Google Scholar]
- 63.Cai W, Wang G, Dewitte B, Wu L, Santoso A, Takahashi K, Yang Y, Carréric A, McPhaden MJ. 2018. Increased variability of eastern Pacific El Niño under greenhouse warming. Nature 564, 201–206. ( 10.1038/s41586-018-0776-9) [DOI] [PubMed] [Google Scholar]
- 64.McNew SM, Knutie SA, Goodman GB, Theodosopoulos A, Saulsberry A, Yépez RJ, Bush SE, Clayton DH. 2019. Data from: Annual environmental variation influences host tolerance to parasites Dryad Digital Repository. ( 10.5061/dryad.n11h95s) [DOI] [PMC free article] [PubMed]
Associated Data
This section collects any data citations, data availability statements, or supplementary materials included in this article.
Data Citations
- McNew SM, Knutie SA, Goodman GB, Theodosopoulos A, Saulsberry A, Yépez RJ, Bush SE, Clayton DH. 2019. Data from: Annual environmental variation influences host tolerance to parasites Dryad Digital Repository. ( 10.5061/dryad.n11h95s) [DOI] [PMC free article] [PubMed]
Supplementary Materials
Data Availability Statement
Files used for analysis are available in the Dryad Digital Repository: https://dx.doi.org/10.5061/dryad.n11h95s [64]. Files include (1) summary of nests in study, (2) nestling size and condition, and (3) behavioural scores from video analysis.