

Abstract
Background & Aims:
We compared fat storage in the abdominal region among individuals from 5 different ethnic/racial groups to determine whether fat storage is associated with disparities observed in the metabolic syndrome and other obesity-associated diseases.
Methods:
We collected data from 1794 participants in the Multiethnic Cohort Study (60–77 years old; of African, European (white), Japanese, Latino, or Native Hawaiian ancestry) with body mass index values of 17.1–46.2 kg/m2. From May 2013 through April 2016, participants visited the study clinic to undergo body measurements, an interview, and a blood collection. Participants were evaluated by dual energy X-ray absorptiometry and abdominal magnetic resonance imaging. Among the ethnic groups, we compared adiposity of trunk, intra-abdominal visceral cavity, and liver, adjusting for total fat mass; we evaluated the association of adult weight change with abdominal adiposity; and we examined the prevalence of the metabolic syndrome mediated by abdominal adiposity.
Results:
Relative amounts of trunk, visceral, and liver fat varied significantly with ethnicity—they were highest in Japanese Americans, lowest in African Americans, and intermediate in the other groups. Compared with African Americans, the mean visceral fat area was 45% and 73% greater in Japanese American men and women, respectively, and the mean measurements of liver fat were 61% and 122% greater in Japanese American men and women. The visceral and hepatic adiposity associated with weight gain since participants were 21 years old varied in a similar pattern among ethnic/racial groups. In the mediation analysis, visceral and liver fat jointly accounted for a statistically significant fraction of the difference in metabolic syndrome prevalence, in comparison to white persons, for African Americans, Japanese Americans, and Native Hawaiian women, independently of total fat mass.
Conclusions:
In an analysis of data from the participants in the Multiethnic Cohort Study, we found extensive differences among ethnic/racial groups in the propensity to store fat intra-abdominally. This observation should be considered by clinicians in the prevention and early detection of metabolic disorders.
Keywords: BMI, NAFLD, MRI, DXA
Excess body fat is an important modifiable risk factor for cardiovascular disease, type 2 diabetes, and multiple cancers.1 Obesity, defined as body-mass index (BMI) ≥ 30 kg/m2, is estimated to cost $150 billion in medical care in the U.S.,2 and obesity and overweight (BMI 25–29 kg/m2) combined account for 19% of all deaths.3 However, the metabolic disease risk resulting from excess adiposity appears to vary substantially based on body fat distribution.4 Trunk fat and, particularly, abdominal visceral fat have been more strongly associated with mortality and cardiac events than overall adiposity.5–7 Ectopic fat accumulation in organs, especially in the liver, is of additional concern as obesity-associated non-alcoholic fatty liver disease (NAFLD) contributes increasingly to cardiovascular disease, chronic liver disease and liver cancer.8,9
Ethnicity, along with male sex and older age, are among the few known determinants of body fat deposition in ectopic abdominal regions, rather than as subcutaneous adipose tissue.4,10 It is postulated that these ethnic differences in body fat distribution account for much of the heterogeneity in the associations between obesity and disease, including diabetes11 and breast cancer.12 Latinos13,14 and Asians15 have been reported to carry greater amounts of abdominal visceral and hepatic fat, whereas African Americans have less,13,16 compared to whites. However, many studies that compared ethnic populations did not adjust for the strong confounding by total body fat, or only adjusted for BMI,15–17 a poor surrogate for adiposity in ethnic comparisons.18 Most studies contrasted only two14–16 to three13 ethnic groups or did not provide pairwise ethnic/racial comparisons.17 Some compared populations living in different countries.15
An optimal ethnic/racial comparison of intra-abdominal adiposity would involve a population-based study of several ethnic groups living in a similar environment. Imaging is the current gold standard for adiposity quantification, and simultaneous measurement of visceral and liver fat is best achieved with magnetic resonance imaging (MRI), since computed tomography (CT) is less sensitive in detecting mild hepatic steatosis.19,20 The largest MRI-based multiethnic comparison of intra-abdominal adiposity to date is the Dallas Heart Study of 2,170 adults aged 30–65 years, which showed lower amounts of visceral and liver fat in African Americans, compared to Latinos or whites, after adjustment for total adiposity.13 Imaging data are much more limited for Asian Americans, who have been reported to carry greater overall and intra-abdominal adiposity for a given BMI,15,17 and non-existent for Pacific Islanders who exhibit a particularly high prevalence of obesity.21
In this imaging study nested in a multiethnic cohort, we characterized ethnic/racial differences in relative fat distribution across a wide range of total fat mass and in relation to weight change since early adulthood. We also examined the prevalence of the metabolic syndrome (MetSx) to better understand the contribution of intra-abdominal adiposity to the observed ethnic/racial differences in the occurrence of metabolic diseases in these populations.
METHODS
Study Population
A detailed description of the study methods is provided in Supplementary Materials. In short, the study was conducted in a subset of the Multiethnic Cohort (MEC) Study participants.21 At baseline (1993–1996), the MEC was composed of over 215,000 men and women, aged 45–75 years, of mainly five ethnic groups (Japanese Americans, Native Hawaiians and whites mostly from Hawaii and African Americans and Latinos mostly from Los Angeles County, California), who returned a mailed questionnaire on demographics, height, weight (current and at age 21), usual dietary intake, and other lifestyle and medical history information.
In 2012, a subset of MEC participants, aged 58–74 years, were selected for the present study, the Adiposity Phenotype Study (MEC-APS). We prioritized individuals who reported to be of only one race, except for Native Hawaiians who could be part-Hawaiian. Mailed invitations were followed by a telephone call to screen for eligibility. Exclusion criteria included reported BMI outside range of 18.5–40 kg/m2; smoking in the past 2 years; soft or metal body implants or amputation; insulin or thyroid medications; and serious medical conditions (e.g., dialysis, chronic hepatitis). Women were all postmenopausal. Participants were enrolled stratified on sex, ethnicity and six BMI categories (18.5–21.9, 22–24.9, 25–26.9, 27–29.9, 30–34.9, and 35–40 kg/m2, based on self-reported weight and height) in order to optimize the adjustment for total adiposity in populations with different body sizes.
Between May 2013 and April 2016, participants visited the study clinic after an overnight fast (>8 hours) to undergo body measurements, an interview, and a blood collection. The study was conducted at the University of Hawaii (UH) in Honolulu, Hawaii, and at the University of Southern California (USC) in Los Angeles, California. The Institutional Review Boards of UH and USC approved the study protocol. All participants signed an informed consent form.
The overall participation rate was 15% among the 12,602 individuals invited, and 23% after excluding 4,624 persons who were willing but ineligible, leading to a sample size of 1,861 subjects. We excluded 21 individuals with invalid densitometry scans due to implants and an additional 46 with invalid MRI scans due to motion artifacts (n=38) or presence of visceral masses (n=8), leaving 1,794 participants for the current analysis.
Anthropometric and Body Composition Assessment
Trained technicians obtained measurements of height, weight, and circumferences of the waist and hip. Body composition was determined by a whole-body dual energy X-ray absorptiometry (DXA) scan using a fan-beam densitometer. Fat mass and lean mass were estimated for the whole body, trunk, arms and legs, from which skeletal muscle mass was derived.22 An abdominal MRI scan was acquired on 3-Tesla scanners to quantify visceral fat areas (cm2) at four intervertebral segments of the intra-abdominal cavity (L1-L2, L2-L3, L3-L4, L4-L5) using an axial gradient-echo sequence with breath holds and to calculate percent fat in the liver using a series of axial triple gradient-echo Dixon-type scans.23 All quality control measures are described in the Supplementary Materials. NAFLD was defined as 5% or greater percent liver fat in the absence of excessive alcohol use in the past year (>30 g/day in men, >20 g/day in women)24 based on a food frequency questionnaire.
Assessment of the Metabolic Syndrome (MetSx)
MetSx was defined as the presence of three or more abnormal findings out of five components, including resting blood pressure (≥130/85 mmHg or antihypertensive treatment combined with a history of hypertension), fasting blood levels of glucose (≥100 mg/dL or treatment for hyperglycemia), triglycerides (≥150 mg/dL), and high-density lipoprotein cholesterol (<40 mg/dL in men and <50 mg/dL in women), and waist circumference (≥90 cm for Asian men, ≥80 cm for Asian women; ≥102 cm for men and ≥88 cm for women of other ethnicity).25,26
Statistical Analysis
Four abdominal fat variables were considered as the main outcomes, namely, percent trunk fat (100 × trunk fat mass/total fat mass), visceral fat area (cm2) averaged over four cross-sections at L1-L5, and percent liver fat (log-transformed to improve normality), as well as the presence of NAFLD. We used a general linear regression model for the first three continuous outcomes and a log-linear model for NAFLD, to compare covariate-adjusted means (and 95% confidence limits) across ethnic groups within each sex. All models were adjusted for age and height, and models for visceral fat, liver fat and NAFLD prevalence were additionally adjusted for total fat mass to assess relative fat distribution, as a main effect and as interaction terms with ethnic groups as needed. The interaction terms were significant and were retained in the models for visceral and liver fat and NAFLD. The Tukey-Kramer method was used to adjust for multiple testing in pairwise ethnic comparisons.27
The adiposity outcomes were also analyzed in relation to weight change since age 21 [(current weight – weight at age 21)/age difference in years]. Trunk fat mass, visceral fat area, and log-transformed percent liver fat were each regressed, by sex and ethnicity, on adult weight change, with adjustment for age, height, and weight at age 21. Weight change was parameterized in units of 0.227 kg per year (or 0.5 lbs/year), which was comparable to the observed mean weight change (0.3 ± 0.3 kg/year), in order to produce interpretable results. Interaction between ethnicity and weight change was tested in sex-specific models to determine if weight gain preferentially accumulated in the abdominal regions for some ethnic groups. Weight change was further examined in two independent analyses, one for “early adulthood” (between age 21 and cohort baseline, ages 45–57 years) and another for “late adulthood” (between cohort baseline and current study).
Prevalence of MetSx was compared across ethnicities in each sex using a log-linear model, with and without adjustment for visceral fat and liver fat to assess the contribution of intra-abdominal adiposity to ethnic differences. Also, a formal mediation analysis was performed using natural effect models.28 The log-linear and mediation models were adjusted for age, height, alcohol intake, and total fat mass. Education, past smoking, physical activity, dietary intake of total sugar, added sugar or regular soda, and Alternate Healthy Eating index29 component score for sugar-sweetened beverages including fruit juice were also considered but did not confound the associations observed.
RESULTS
The stratified recruitment resulted in a comparable number of study participants across the sex-ethnicity-BMI categories, except for smaller numbers in the African American male and extreme BMI categories (Supplementary Figure 1). Characteristics, such as age, education, past smoking, alcohol intake, and anthropometric measurements, showed only limited variation across ethnic groups (Table 1).
Table 1.
Characteristics* of participants in the Multiethnic Cohort Adiposity Phenotype Study (MEC-APS) by sex and ethnicity.
| African American | White | Latino | Native Hawaiian | Japanese American | |
|---|---|---|---|---|---|
| MEN, n (%) | 121 (14%) | 207 (24%) | 191 (22%) | 134 (15%) | 228 (26%) |
| Age, years | 70.3 (67.9 – 72.2) | 68.3 (66.8 – 70.8) | 69.8 (67.5 – 72.3) | 69.5 (67.0 – 71.4) | 68.7 (66.6 – 70.5) |
| Education, years | 14.0 (14.0 – 16.0) | 18.0 (16.0 – 18.0) | 14.0 (12.0 – 16.0) | 14.0 (14.0 – 16.0) | 16.0 (14.0 – 16.0) |
| Past smoking, n (%) | 64 (53%) | 80 (39%) | 89 (47%) | 67 (50%) | 121 (53%) |
| Pack-years among past smokers |
7.6 (3.9 – 19.8) | 6.2 (3.9 – 19.8) | 6.2 (2.0 – 12.0) | 6.2 (2.0 – 19.8) | 6.4(2.0 – 19.8) |
| Alcohol, g/day | 0.9 (0.0 – 9.1) | 9.8 (0.9 – 23.0) | 3.7 (0.1 – 11.5) | 2.3 (0.1 – 11.2) | 1.5 (0.1 – 10.7) |
| Weight, kg | 85.7 (76.8 – 97.2) | 81.0 (73. – 91.9) | 80.4 (72.6 – 92.6) | 82.2 (73.8 – 91.3) | 72.2 (64.5 – 81.3) |
| Weight gain since age 21, kg | 15.1 (9.5 – 23.9) | 9.8 (3.3 – 17.7) | 13.3 (6.5 – 22.6) | 12.6 (4.4 – 20.8) | 8.3 (2.1 – 15.6) |
| Height, m | 1.76 (1.72 – 1.79) | 1.75 (1.71 – 1.80) | 1.69 (1.65 – 1.73) | 1.71 (1.67 – 1.76) | 1.67 (1.63 – 1.71) |
| BMI, kg/m2 | 28.2 (25.8 – 31.1) | 26.6 (24.1 – 29.7) | 28.2 (26.0 – 31.4) | 28.2 (25.9 – 31.5) | 26.0 (23.1 – 28.8) |
| Waist, cm | 96.7 (90.9 – 105.0) | 98.4 (91.4 – 107.0) | 98.0 (92.1 – 106.2) | 101.1 (92.4 – 107.2) | 93.9 (86.2 – 100.8) |
| Waist-hip ratio | 0.95 (0.91 – 0.98) | 0.96 (0.91 – 1.00) | 0.97 (0.94 – 1.01) | 0.97 (0.94 – 1.01) | 0.95 (0.92 – 0.99) |
| Total fat mass, kg | 26.8 (22.5 – 32.4) | 20.5 (16.3 – 25.5) | 26.2 (21.8 – 30.6) | 21.3 (17.0 – 26.5) | 18.5 (15.1 – 22.3) |
| % total fat | 30.7 (27.0 – 33.9) | 25.7 (23.1 – 28.6) | 31.8 (28.8 – 34.2) | 26.7 (23.5 – 29.6) | 25.8 (23.2 – 28.9) |
| Total lean mass, kg | 61.4 (55.5 – 66.6) | 58.4 (53.4 – 65.7) | 55.5 (51.3 – 61.6) | 58.0 (54.0 – 66.3) | 52.5 (48.6 – 57.9) |
| Total muscle mass, kg | 27.3 (24.5 – 29.7) | 24.9 (22.9 – 28.2) | 23.3 (21.3 – 25.9) | 25.0 (23.3 – 28.9) | 22.1 (20.3 – 24.5) |
| WOMEN, n (%) | 176 (19%) | 193 (21%) | 186 (20%) | 155 (17%) | 203 (22%) |
| Age, years | 69.6 (67.9 – 71.7) | 69.0 (67.2 – 70.9) | 69.5 (67.4 – 72.0) | 67.8 (66.1 – 70.8) | 68.7 (66.8 – 70.7) |
| Education, years | 14.0 (14.0 – 16.0) | 16.0 (14.0 – 18.0) | 14.0 (10.0 – 14.0) | 14.0 (12.0 – 16.0) | 16.0 (14.0 – 18.0) |
| Past smoking, n (%) | 59 (34%) | 70 (36%) | 35 (19%) | 52 (34%) | 57 (28%) |
| Pack-years among past smokers |
6.2 (1.3 – 19.8) | 3.9 (2.0 – 19.8) | 3.9 (1.3 – 6.4) | 6.2 (2.0 – 12.0) | 6.2 (1.3 – 19.8) |
| Alcohol, g/day | 0.1 (0.0 – 2.7) | 4.6 (0.4 – 17.5) | 0.1 (0.0 – 3.2) | 0.1 (0.0 – 2.2) | 0.1 (0.0 – 0.9) |
| Weight, kg | 76.3 (67.5 – 89.4) | 67.6 (59.4 – 79.1) | 68.6 (62.0 – 79.3) | 69.5 (61.4 – 82.3) | 61.0 (53.7 – 68.8) |
| Weight gain since age 21, kg | 20.9 (12.6 – 29.8) | 13.3 (4.0 – 22.3) | 16.7 (8.4 – 24.5) | 16.8 (7.1 – 24.5) | 11.1 (6.1 – 15.3) |
| Height, m | 1.63 (1.59 – 1.67) | 1.61 (1.57 – 1.66) | 1.55 (1.51 – 1.60) | 1.58 (1.54 – 1.62) | 1.54 (1.51 – 1.58) |
| BMI, kg/m2 | 29.2 (25.1 – 33.2) | 26.2 (22.6 – 30.1) | 28.9 (25.4 – 32.9) | 28.2 (24.5 – 32.4) | 25.5 (22.7 – 28.9) |
| Waist, cm | 91.0 (81.2 – 98.3) | 93.0 (83.6 – 102.9) | 89.4 (81.8 – 98.8) | 96.4 (87.9 – 104.0) | 90.5 (85.1 – 98.4) |
| Waist-hip ratio | 0.84 (0.79 – 0.89) | 0.89 (0.84 – 0.93) | 0.86 (0.81 – 0.91) | 0.90 (0.86 – 0.95) | 0.92 (0.88 – 0.96) |
| Total fat mass, kg | 33.5 (26.6 – 39.2) | 25.0 (18.9 – 30.2) | 29.9 (26.0 – 36.4) | 25.4 (21.0 – 30.7) | 21.8 (18.4 – 25.3) |
| % total fat | 42.7 (39.2 – 45.6) | 37.2 (32.6 – 40.2) | 43.5 (40.8 – 46.1) | 36.8 (34.3 – 40.4) | 36.4 (33.8 – 38.9) |
| Total lean mass, kg | 45.6 (40.5 – 49.2) | 42.5 (38.1 – 46.3) | 39.6 (36.4 – 43.4) | 41.9 (38.5 – 48.0) | 38.4 (34.2 – 41.7) |
| Total muscle mass, kg | 18.9 (16.8 – 20.7) | 16.6 (15.0 – 18.4) | 15.3 (13.9 – 16.8) | 16.7 (15.1 – 19.4) | 14.5 (13.0 – 16.2) |
The median (interquartile range) of continuous variables and the count (percent) of categorical variables are presented for men and women across ethnic groups. All characteristics are from inquiries and measurements at the time of MEC-APS.
Figure 1 (and Supplementary Table 1) compares the mean adiposity outcomes across ethnic groups within each sex, after adjustment for age, height and total fat mass. Consistently for trunk, visceral, and liver fat, the means were highest for Japanese Americans, lowest for African Americans, and intermediate for Native Hawaiians, Latinos, and whites (p-heterogeneity <.0001 for all adiposity variables). The adjusted mean adiposity outcomes varied widely across ethnicities for men and women: percent trunk fat range of 50–59% and 47–54%; visceral fat area range of 161–234 cm2 and 102–176 cm2; and percent liver fat range of 3.6–5.8% and 3.2–7.1%. These values account for the differences in the strength of the relationship between total fat mass and each of trunk, visceral, and liver fat across ethnic/racial groups, as illustrated by the regression slopes in Supplementary Figure 2.
Figure 1. Mean and 95% confidence limits of abdominal adiposity outcomes by sex and ethnic groups.
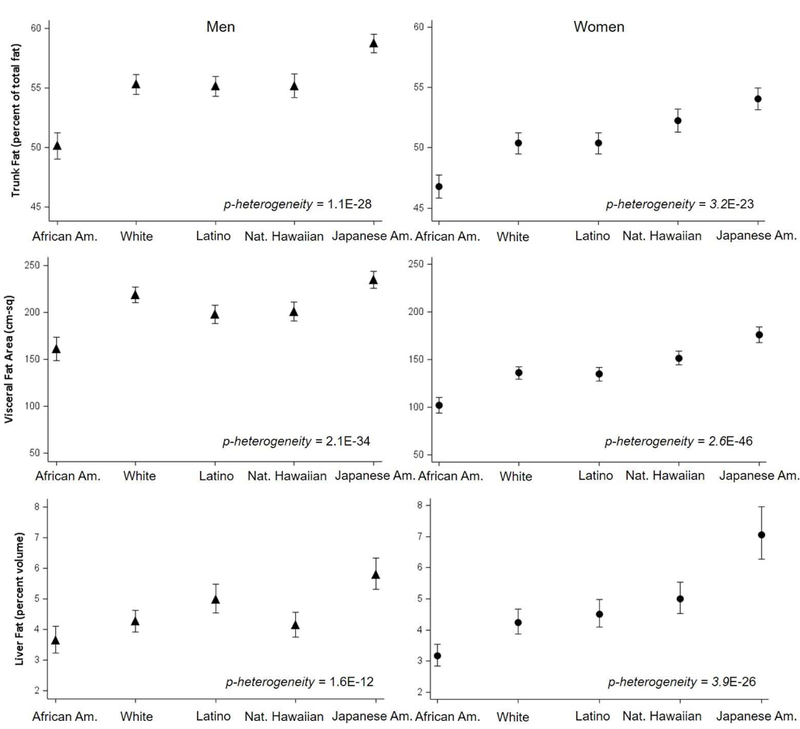
Adjusted means (symbols) and 95% confidence limits (bars) were estimated by general linear models. Percent trunk fat over total fat was adjusted for age and height, and visceral fat area (average of 4 cross-sections between L1 and L5) and percent liver fat were further adjusted for total fat mass.
The prevalence of NAFLD observed in the APS was 38% overall in both men and women, but it ranged widely by ethnicity (21–54% in men, 17–52% in women; Supplementary Table 1). These ethnic differences became more pronounced after adjusting for total fat mass, with a 4–5 fold difference in NAFLD prevalence between Japanese Americans (57% in men, 72% in women) and African Americans (12%, 19%). Latinos had the second highest adjusted prevalence of NAFLD in men (41%) and third highest in women (44%), after Native Hawaiian women (47%). When we corrected for sampling fractions (Supplementary Methods), to estimate the prevalence of NAFLD in the parent MEC population, the prevalence was substantially increased for Latinos (56% for men, 47% for women) and lowered for Japanese Americans (38%, 46%); however, the estimates for MEC remained similar overall (36%) and for the other ethnic groups [African Americans (21% men, 18% women), whites (23%, 21%) and Native Hawaiians (35%, 42%)].
Adult weight change since age 21 was positively associated with current abdominal and intra-abdominal adiposity, independently of age, height, and weight at age 21 (Table 2); e.g., an increase in weight by 0.227 kg (or 0.5 lbs) per year over 48.2 ± 2.7 years was associated with a greater percent liver fat in women ranging from 1.12% to 1.60%, depending on ethnicity. The amount of visceral fat and liver fat, but not of trunk fat, associated with the unit weight change differed significantly by ethnicity and was again greatest in Japanese Americans and lowest in African Americans. When examined for weight change in early (between age 21 and cohort baseline) and late (between cohort baseline and current study) adulthood, current intra-abdominal adiposity tended to diverge more by ethnicity in relation to weight change in early adulthood (Supplementary Table 2).
Table 2.
Current abdominal and intra-abdominal adiposity amounts [beta coefficient (95% confidence limit)]* associated with weight change since age 21.
| African American | White | Latino | Native Hawaiian | Japanese American | p-het.** | |
|---|---|---|---|---|---|---|
| MEN | ||||||
| Trunk fat mass, kg | ||||||
| Adjusted for age, height, weight at age 21 |
3.24 (2.88, 3.60) | 3.48 (3.21, 3.76) | 3.49 (3.24, 3.74) | 3.19 (2.94, 3.44) | 3.56 (3.29, 3.83) | 0.56 |
| Visceral fat area, cm2 | ||||||
| Adjusted for age, height, weight at age 21 |
39.7 (29.8, 49.7) | 68.1 (61.0, 75.2) | 53.7 (44.5, 62.8) | 52.2 (44.6, 59.8) | 78.6 (71.4, 85.7) | 0.00001 |
| Liver fat, % | ||||||
| Adjusted for age, height, weight at age 21 |
1.11 (1.02, 1.20) | 1.38 (1.29, 1.47) | 1.25 (1.16, 1.35) | 1.28 (1.19, 1.37) | 1.51 (1.39, 1.64) | 0.00003 |
| WOMEN | ||||||
| Trunk fat mass, kg | ||||||
| Adjusted for age, height, weight at age 21 |
3.59 (3.34, 3.85) | 3.88 (3.64, 4.12) | 3.44 (3.17, 3.70) | 3.39 (3.13, 3.66) | 3.53 (3.26, 3.81) | 0.05 |
| Visceral fat area, cm2 | ||||||
| Adjusted for age, height, weight at age 21 |
26.4 (21.5, 31.4) | 42.1 (37.5, 46.6) | 41.2 (35.2, 47.3) | 44.5 (38.2, 50.8) | 52.8 (46.4, 59.1) | 1.0E-7 |
| Liver fat, % | ||||||
| Adjusted for age, height, weight at age 21 |
1.12 (1.05, 1.19) | 1.38 (1.28, 1.48) | 1.26 (1.16, 1.37) | 1.41 (1.28, 1.55) | 1.60 (1.45, 1.78) | 4.5E-8 |
A multiple linear regression model was run for each adiposity outcome and sex-ethnic group to estimate the amount of adiposity [beta coefficient (95% confidence limit)] associated with a unit weight change (0.227 kg/year or 0.5 lbs/year) between age 21 (as reported on the cohort baseline questionnaire) and the current study measurement [ages 60–77 years, over 48.2 ± 2.7 years)], with adjustment for current age, height, and weight at age 21. Median (interquartile) adult weight change since age 21 was: in men, 0.317 kg (0.188 – 0.479) for African Americans, 0.208 kg (0.069 – 0.369) for whites, 0.271 kg (0.128 – 0.456) for Latinos, 0.254 kg (0.098 – 0.447) for Native Hawaiians, and 0.170 kg (0.043 – 0.320) for Japanese Americans; in women, 0.446 kg (0.262 – 0.613) for African Americans, 0.274 kg (0.079 – 0.458) for whites, 0.358 kg (0.173 – 0.503) for Latinos, 0.358 kg (0.160 – 0.526) for Native Hawaiians, and 0.240 kg (0.126 – 0.331) for Japanese Americans.
The p-value for ethnic heterogeneity in the association between adult weight change and current regional adiposity was obtained from the product term between ethnicity and weight change in an equivalent general linear model for each sex.
Lastly, we explored the contribution of visceral and liver fat, independently of overall adiposity, to differences in MetSx prevalence by ethnic/racial group. Comparing models with additional adjustment for visceral and liver fat to those without that adjustment, the cross-ethnic range for the prevalence of MetSx was reduced, from 21–71% to 24–65% in men and from 19–76% to 34–69% in women (Supplementary Table 3), due to the increase in prevalence for African Americans and the decrease in Japanese Americans (Supplementary Figure 3). Mediation analysis (Figure 2) showed a statistically significant indirect effect of ethnicity/race on MetSx prevalence through joint mediation by visceral and liver fat in these groups and Native Hawaiian women, compared to whites: African Americans (proportion mediated = 57% in men, 73% in women), Japanese Americans (40%, 38%), and Native Hawaiian women (40%). In African Americans, the results indicate that their lower likelihood of MetSx compared to whites (overall ORs of 0.28 in men and 0.33 in women) was in part mediated through their lower relative intra-abdominal adiposity. The reverse was observed for Japanese American men and women and Native Hawaiian women, for whom the data showed that their higher likelihood of MetSx compared to whites was in part mediated through their higher relative intra-abdominal adiposity.
Figure 2. Odds ratio and 95% confidence intervals for the relative likelihood of the metabolic syndrome in each non-white ethnic group compared to whites, decomposed into the direct effect and the indirect effect through visceral and liver fat.
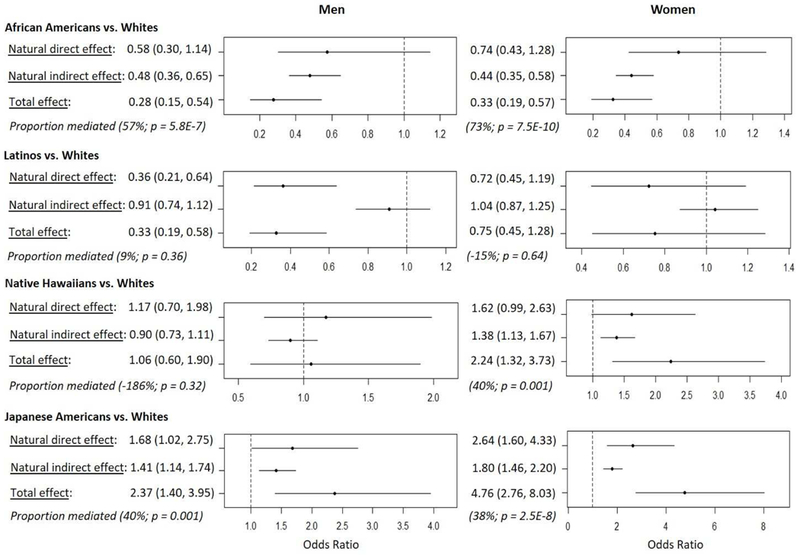
Mediation analysis using natural effect modeling was performed in each sex to decompose the total effect of ethnicity on MetSx into a direct effect and an indirect effect mediated through visceral and liver fat jointly (R medflex; Supplementary Methods). An imputation approach was selected to estimate counterfactuals. The natural effect model included logistic regression of MetSx and generalized linear regression of joint mediators on ethnicity and covariates (age, height, alcohol intake and total fat mass). Effect decomposition was obtained in pairs of ethnic groups to estimate odds ratios (and 95% confidence intervals from bootstrap samples) of a non-white ethnic group to have MetSx compared to whites through direct and indirect pathways involving mediators. Proportion mediated was calculated as the ratio of the natural indirect effect to the total effect, [= 100 × (logOR for indirect effect) / (logOR for total effect)] in each ethnic pair comparison.
DISCUSSION
Using DXA and MRI imaging in a large multiethnic population of healthy older adults, abdominal and intra-abdominal adiposity were measured relative to total adiposity and found to be largest in Japanese Americans, followed by Native Hawaiians, Latinos and whites, and lowest in African Americans. These ethnic/racial differences for Japanese Americans compared to African Americans were modest and similar in size between sexes for relative trunk fat (17% in men, 16% in women), whereas they were large and significant, especially among women, for relative visceral fat (45%, 73%) and liver fat (61%, 122%; Supplementary Table 1). Similarly, the association of weight change since age 21 and the abdominal fat outcomes showed a similar heterogeneous association across ethnicities for current visceral and liver fat but not trunk fat (Table 2), after adjustment for total fat mass, which was strongly correlated with weight change (Spearman ρ=0.78). Further, visceral and liver fat appeared to explain a considerable fraction of the ethnic difference in the prevalence of MetSx, independently of total fat mass.
In this study, the ethnic comparison was made in a subset of a population-based multiethnic cohort, using data collected through a standardized protocol. The findings provide strong evidence for a disproportionately greater susceptibility to intra-abdominal adiposity among Japanese Americans compared to other ethnic/racial groups and for a greater prevalence of NAFLD in Latinos (due to their overall greater adiposity) and Japanese Americans (due to this susceptibility to intra-abdominal fat accumulation). These findings extend previous studies among Hispanics14,30 and various Asian groups,14,30 mostly in comparison to whites. The present study included Native Hawaiians, an understudied Pacific Islander group with a high burden of obesity and obesity-related diseases,11,12,21 and showed that their susceptibility to visceral adiposity and related dysmetabolism (adjusting for total adiposity) was second only to Japanese Americans among women, and was comparable to whites in men. As in previous studies of Latinos,13,31 we observed that, once total fat mass was accounted for, their visceral fat levels were generally similar to whites. Therefore, their greater metabolic disease risk, as observed in the MEC11 and in the general population, is likely due to their greater overall adiposity21 and adult weight gain (Table 1) leading to high visceral obesity in this population. The previously observed lower intra-abdominal adiposity in African Americans as compared to whites13,31 was replicated in this study. Lastly, addressing the limitation resulting from the cross-sectional design of our adiposity measurements, the associations of the adiposity outcomes with adult weight change and their mediating effect on ethnic differences in MetSx prevalence were supportive of the long-term nature of the ethnic differences that we observed in abdominal fat distribution.
Genetic and specific lifestyle factors may account for the ethnic/racial variation in body fat distribution. Genome-wide association studies have estimated the heritability of BMI-adjusted visceral adiposity to be as high as 36%.32 A well-established genetic variant associated with increased hepatic adiposity (PNPLA3 rs738409) displayed a 3.5-fold difference in allele frequency across Mexican (54%), European (25%) and African (14%) ancestral groups, consistent with the prevalence of NAFLD in these groups.33 In addition, age,10 menopause,34,35 smoking36,37 and alcohol intake38 have been associated with visceral and hepatic adiposity. Importantly, our findings were independent of these potential confounders.
The design of this study was optimized for comparing the relative size of fat depots across five ethnic groups throughout a wide range of overall adiposity. The use of gold standard imaging allowed for the comparison of adiposity phenotypes beyond the capacity of BMI and waist circumference (Figure 3). The ethnic difference in MetSx prevalence mediated by total adiposity appeared to be underestimated substantially among African Americans and Latinos, and overestimated slightly among Native Hawaiians and Japanese Americans, when BMI was used instead of total fat mass (Supplementary Table 4). Other strengths include the standardized data collection protocol, the large sample size and the inclusion of populations living in a similar environment and with differing risk of metabolic disease.
Figure 3. An example of cross-sectional MR images of two individuals who have markedly different amounts of visceral fat in the L4-L5 region of the abdomen but similar levels of BMI, waist circumference, total fat mass and abdominal fat area.
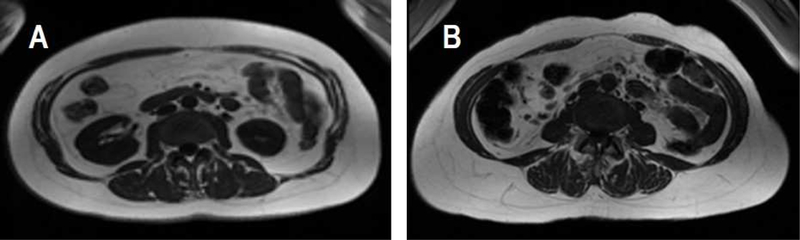
Adiposity measurements of Subject A and B: BMI (A: 28.3 kg/m2; B: 27.2 kg/m2), total fat mass (A: 29.0 kg; B: 29.5 kg), waist circumference (A: 97.6 cm; B: 93.8 cm), abdominal area (A: 581 cm2; B: 585 cm2), abdominal fat area (A: 290 cm2; B: 295 cm2), visceral fat area (A: 145 cm2; B: 85 cm2), and ratio of visceral fat to subcutaneous fat (A: 0.69; B: 0.35).
Study limitations include the cross-sectional design that precludes a definitive conclusion about the temporality of the relationship between weight gain and change in body fat distribution and the mediation of ethnicity on MetSx prevalence through body fat distribution. Also, the adiposity measures taken in these older adults may not fully reflect their adiposity patterns during early adulthood due to the skeletal muscle loss and relative fat mass gain observed with aging.10 However, the age range of our participants has not been linked to drastic changes in body composition in longitudinal studies10 and may be more relevant for capturing the effect of aging- and menopause-associated lipodystrophy, a reduced ability of subcutaneous adipocytes to store fat and a relative increase in visceral and ectopic adiposity.10,34
In conclusion, these findings provide strong evidence for the existence of large differences in relative visceral and hepatic adiposity among the five ethnic/racial groups studied. They also implicate body fat distribution as a cause of metabolic disease risk beyond what is explained by overall adiposity, especially in Asian Americans and Native Hawaiian women. In particular, the frequency of NAFLD-associated chronic liver disease and liver cancer has increased substantially in recent years as the result of the increase in obesity in the U.S. population.39,40 In fact, NAFLD has become the most common cause of chronic liver disease and liver cancer, surpassing alcoholic and viral etiologies,9,41 and is thought to also play a role in cardiometabolic diseases and other malignancies.42–44 Thus, the extensive ethnic/racial heterogeneity in the propensity to store fat intra-abdominally highlighted by this study should be considered as a cause of ethnic/racial health disparities, and the rising frequency of NAFLD and non-alcoholic steatohepatitis (NASH) as a serious concern, by both public health practitioners and clinicians.
Supplementary Material
ACKNOWLEDGEMENTS
We thank the Multiethnic Cohort Study participants who generously donated their time and effort for the Adiposity Phenotype Study.
We acknowledge the contribution of the study staff members whose excellent performance made this research possible: the Recruitment and Data Collection Core staff at USC (Dr. Valencerina, Adelaida Irimian, Chanthel Figueroa, Brenda Figueroa, Carla Flores, Karla Soriano) and UH (Dr. Terrilea Burnett, Jane Yakuma, Naomi Hee, Clara Richards, Cheryl Toyofuku, Hui Chang, Janice Nako-Piburn, Reid Sakamoto, Sara Sameshima, Pacer Lee, Emmalyn Pilande, Neelima Nuti, Shirley So, Maya Yamane, Juanita Kaaukai); the Data Management and Analysis Core staff at USC (Zhihan Huang) and UH (Maj Earle, Joel Julian, Anne Tome, Yun Oh Jung, Emil Svrcina); the Project Administrative Core staff at UH (Eugene Okiyama); and the UH Analytical Biochemistry Shared Resource lab staff (Dr. Xingnan Li, Laurie Custer, Jen Lai, Tricia DeBaun, Melanie Nakatani, Karly Torii, and Alyson Omori).
Grant Support
Funding for this study was provided by a program project grant from the National Cancer Institute (NCI), National Institutes of Health (NIH): P01 CA168530 (LLM). The Multiethnic Cohort Study is funded by grant U01 CA164973 (LLM, LRW and Dr. Christopher Haiman at USC). The UHCC Shared Resources (Analytical Biochemistry, Biostatistics, and Nutrition Support) were supported in part by NCI (P30 CA071789). Recruitment activities at USC were supported in part by grants to the Southern California Clinical and Translational Science Institute (UL1 TR000130) from the NIH National Center for Advancing Translational Science. The funding agencies had no role in study design, data collection and analysis, decision to publish, or preparation of the manuscript.
Footnotes
Publisher's Disclaimer: This is a PDF file of an unedited manuscript that has been accepted for publication. As a service to our customers we are providing this early version of the manuscript. The manuscript will undergo copyediting, typesetting, and review of the resulting proof before it is published in its final citable form. Please note that during the production process errors may be discovered which could affect the content, and all legal disclaimers that apply to the journal pertain.
Disclosures
Dr. Kristal is a consultant for Metabolon, which played no role in this study. Dr. Ernst is a consultant for KinetiCor, Inc., which played no role in this study. The other authors declare no conflicts of interest.
REFERENCES
- 1.G. B. D. Obesity Collaborators, Afshin A, Forouzanfar MH, et al. Health Effects of Overweight and Obesity in 195 Countries over 25 Years. N Engl J Med 2017;377:13–27. [DOI] [PMC free article] [PubMed] [Google Scholar]
- 2.Kim DD, Basu A. Estimating the Medical Care Costs of Obesity in the United States: Systematic Review, Meta-Analysis, and Empirical Analysis. Value Health 2016;19:602–13. [DOI] [PubMed] [Google Scholar]
- 3.The Global BMI Mortality Collaboration, Di Angelantonio E, Bhupathiraju Sh N, et al. Body-mass index and all-cause mortality: individual-participant-data meta-analysis of 239 prospective studies in four continents. Lancet 2016;388:776–86. [DOI] [PMC free article] [PubMed] [Google Scholar]
- 4.Tchernof A, Despres JP. Pathophysiology of human visceral obesity: an update. Physiol Rev 2013;93:359–404. [DOI] [PubMed] [Google Scholar]
- 5.Zong G, Zhang Z, Yang Q, Wu H, Hu FB, Sun Q. Total and regional adiposity measured by dual-energy X-ray absorptiometry and mortality in NHANES 1999–2006. Obesity (Silver Spring) 2016;24:2414–21. [DOI] [PMC free article] [PubMed] [Google Scholar]
- 6.Rosenquist KJ, Massaro JM, Pedley A, et al. Fat quality and incident cardiovascular disease, all-cause mortality, and cancer mortality. J Clin Endocrinol Metab 2015;100:227–34. [DOI] [PMC free article] [PubMed] [Google Scholar]
- 7.Lee SW, Son JY, Kim JM, Hwang SS, Han JS, Heo NJ. Body fat distribution is more predictive of all-cause mortality than overall adiposity. Diabetes Obes Metab 2018;20:141–7. [DOI] [PubMed] [Google Scholar]
- 8.Diehl AM, Day C. Cause, Pathogenesis, and Treatment of Nonalcoholic Steatohepatitis. N Engl J Med 2017;377:2063–72. [DOI] [PubMed] [Google Scholar]
- 9.Setiawan VW, Stram DO, Porcel J, Lu SC, Le Marchand L, Noureddin M. Prevalence of chronic liver disease and cirrhosis by underlying cause in understudied ethnic groups: The Multiethnic Cohort. Hepatology 2016;64:1969–77. [DOI] [PMC free article] [PubMed] [Google Scholar]
- 10.Kuk JL, Saunders TJ, Davidson LE, Ross R. Age-related changes in total and regional fat distribution. Ageing Res Rev 2009;8:339–48. [DOI] [PubMed] [Google Scholar]
- 11.Maskarinec G, Grandinetti A, Matsuura G, et al. Diabetes prevalence and body mass index differ by ethnicity: the Multiethnic Cohort. EthnDis 2009;19:49–55. [PMC free article] [PubMed] [Google Scholar]
- 12.White KK, Park SY, Kolonel LN, Henderson BE, Wilkens LR. Body size and breast cancer risk: the Multiethnic Cohort. Int J Cancer 2012;131:E705–16. [DOI] [PMC free article] [PubMed] [Google Scholar]
- 13.Guerrero R, Vega GL, Grundy SM, Browning JD. Ethnic differences in hepatic steatosis: an insulin resistance paradox? Hepatology 2009;49:791–801. [DOI] [PMC free article] [PubMed] [Google Scholar]
- 14.Wagenknecht LE, Scherzinger AL, Stamm ER, et al. Correlates and heritability of nonalcoholic fatty liver disease in a minority cohort. Obesity (Silver Spring) 2009;17:1240–6. [DOI] [PMC free article] [PubMed] [Google Scholar]
- 15.Azuma K, Kadowaki T, Cetinel C, et al. Higher liver fat content among Japanese in Japan compared with non-Hispanic whites in the United States. Metabolism 2009;58:1200–7. [DOI] [PMC free article] [PubMed] [Google Scholar]
- 16.Beasley LE, Koster A, Newman AB, et al. Inflammation and race and gender differences in computerized tomography-measured adipose depots. Obesity (Silver Spring) 2009;17:1062–9. [DOI] [PMC free article] [PubMed] [Google Scholar]
- 17.Mongraw-Chaffin M, Golden SH, Allison MA, et al. The Sex and Race Specific Relationship between Anthropometry and Body Fat Composition Determined from Computed Tomography: Evidence from the Multi-Ethnic Study of Atherosclerosis. PLoS One 2015;10:e0139559. [DOI] [PMC free article] [PubMed] [Google Scholar]
- 18.Deurenberg P, Yap M, van Staveren WA. Body mass index and percent body fat: a meta analysis among different ethnic groups. IntJObesRelat Metab Disord 1998;22:1164–71. [DOI] [PubMed] [Google Scholar]
- 19.Klopfenstein BJ, Kim MS, Krisky CM, Szumowski J, Rooney WD, Purnell JQ. Comparison of 3 T MRI and CT for the measurement of visceral and subcutaneous adipose tissue in humans. Br J Radiol 2012;85:e826–30. [DOI] [PMC free article] [PubMed] [Google Scholar]
- 20.Bohte AE, van Werven JR, Bipat S, Stoker J. The diagnostic accuracy of US, CT, MRI and 1H-MRS for the evaluation of hepatic steatosis compared with liver biopsy: a meta-analysis. Eur Radiol 2011;21:87–97. [DOI] [PMC free article] [PubMed] [Google Scholar]
- 21.Kolonel LN, Henderson BE, Hankin JH, et al. A multiethnic cohort in Hawaii and Los Angeles: baseline characteristics. Am J Epidemiol 2000;151:346–57. [DOI] [PMC free article] [PubMed] [Google Scholar]
- 22.Shepherd JA, Ng BK, Sommer MJ, Heymsfield SB. Body composition by DXA. Bone 2017;104:101–5. [DOI] [PMC free article] [PubMed] [Google Scholar]
- 23.Guiu B, Loffroy R, Petit JM, et al. Mapping of liver fat with triple-echo gradient echo imaging: validation against 3.0-T proton MR spectroscopy. Eur Radiol 2009;19:1786–93. [DOI] [PubMed] [Google Scholar]
- 24.Ahmed A, Wong RJ, Harrison SA. Nonalcoholic Fatty Liver Disease Review: Diagnosis, Treatment, and Outcomes. Clin Gastroenterol Hepatol 2015;13:2062–70. [DOI] [PubMed] [Google Scholar]
- 25.Alberti KG, Eckel RH, Grundy SM, et al. Harmonizing the metabolic syndrome: a joint interim statement of the International Diabetes Federation Task Force on Epidemiology and Prevention; National Heart, Lung, and Blood Institute; American Heart Association; World Heart Federation; International Atherosclerosis Society; and International Association for the Study of Obesity. Circulation 2009;120:1640–5. [DOI] [PubMed] [Google Scholar]
- 26.Aguilar M, Bhuket T, Torres S, Liu B, Wong RJ. Prevalence of the metabolic syndrome in the United States, 2003–2012. JAMA 2015;313:1973–4. [DOI] [PubMed] [Google Scholar]
- 27.Kramer CY. Extension of multiple range tests to group means with unequal numbers of replications. Biometrics 1956;12:307–10. [Google Scholar]
- 28.Steen J, Loeys T, Moerkerke B, Vansteelandt S. medflex: An R package for flexible mediation analysis using natural effect models. J Statistical Software 2017;76:1–46. [Google Scholar]
- 29.Maskarinec G, Lim U, Jacobs S, et al. Diet Quality in Midadulthood Predicts Visceral Adiposity and Liver Fatness in Older Ages: The Multiethnic Cohort Study. Obesity (Silver Spring) 2017;25:1442–50. [DOI] [PMC free article] [PubMed] [Google Scholar]
- 30.Lear SA, Humphries KH, Kohli S, Chockalingam A, Frohlich JJ, Birmingham CL. Visceral adipose tissue accumulation differs according to ethnic background: results of the Multicultural Community Health Assessment Trial (M-CHAT). Am J Clin Nutr 2007;86:353–9. [DOI] [PubMed] [Google Scholar]
- 31.Carroll JF, Chiapa AL, Rodriquez M, et al. Visceral fat, waist circumference, and BMI: impact of race/ethnicity. Obesity(SilverSpring) 2008;16:600–7. [DOI] [PubMed] [Google Scholar]
- 32.Fox CS, Liu Y, White CC, et al. Genome-wide association for abdominal subcutaneous and visceral adipose reveals a novel locus for visceral fat in women. PLoS Genet 2012;8:e1002695. [DOI] [PMC free article] [PubMed] [Google Scholar]
- 33.Hernaez R, McLean J, Lazo M, et al. Association between variants in or near PNPLA3, GCKR, and PPP1R3B with ultrasound-defined steatosis based on data from the third National Health and Nutrition Examination Survey. Clin Gastroenterol Hepatol 2013;11:1183–90 e2. [DOI] [PMC free article] [PubMed] [Google Scholar]
- 34.Lovejoy JC, Champagne CM, de Jonge L, Xie H, Smith SR. Increased visceral fat and decreased energy expenditure during the menopausal transition. Int J Obes (Lond) 2008;32:949–58. [DOI] [PMC free article] [PubMed] [Google Scholar]
- 35.Ryu S, Suh BS, Chang Y, et al. Menopausal stages and non-alcoholic fatty liver disease in middle-aged women. Eur J Obstet Gynecol Reprod Biol 2015;190:65–70. [DOI] [PubMed] [Google Scholar]
- 36.Lee K, Lee CM, Kwon HT, et al. Associations of smoking and smoking cessation with CT-measured visceral obesity in 4656 Korean men. Prev Med 2012;55:183–7. [DOI] [PubMed] [Google Scholar]
- 37.Hamabe A, Uto H, Imamura Y, et al. Impact of cigarette smoking on onset of nonalcoholic fatty liver disease over a 10-year period. J Gastroenterol 2011;46:769–78. [DOI] [PubMed] [Google Scholar]
- 38.Younossi ZM, Koenig AB, Abdelatif D, Fazel Y, Henry L, Wymer M. Global epidemiology of nonalcoholic fatty liver disease-Meta-analytic assessment of prevalence, incidence, and outcomes. Hepatology 2016;64:73–84. [DOI] [PubMed] [Google Scholar]
- 39.Younossi ZM, Stepanova M, Afendy M, et al. Changes in the prevalence of the most common causes of chronic liver diseases in the United States from 1988 to 2008. Clin Gastroenterol Hepatol 2011;9:524–30 e1; quiz e60. [DOI] [PubMed] [Google Scholar]
- 40.Welzel TM, Graubard BI, Quraishi S, et al. Population-attributable fractions of risk factors for hepatocellular carcinoma in the United States. Am J Gastroenterol 2013;108:1314–21. [DOI] [PMC free article] [PubMed] [Google Scholar]
- 41.Calzadilla Bertot L, Adams LA. The Natural Course of Non-Alcoholic Fatty Liver Disease. Int J Mol Sci 2016;17. [DOI] [PMC free article] [PubMed]
- 42.Vanni E, Marengo A, Mezzabotta L, Bugianesi E. Systemic Complications of Nonalcoholic Fatty Liver Disease: When the Liver Is Not an Innocent Bystander. Semin Liver Dis 2015;35:236–49. [DOI] [PubMed] [Google Scholar]
- 43.Sanna C, Rosso C, Marietti M, Bugianesi E. Non-Alcoholic Fatty Liver Disease and Extra-Hepatic Cancers. Int J Mol Sci 2016;17. [DOI] [PMC free article] [PubMed]
- 44.Adams LA, Anstee QM, Tilg H, Targher G. Non-alcoholic fatty liver disease and its relationship with cardiovascular disease and other extrahepatic diseases. Gut 2017;66:1138–53. [DOI] [PubMed] [Google Scholar]
Associated Data
This section collects any data citations, data availability statements, or supplementary materials included in this article.