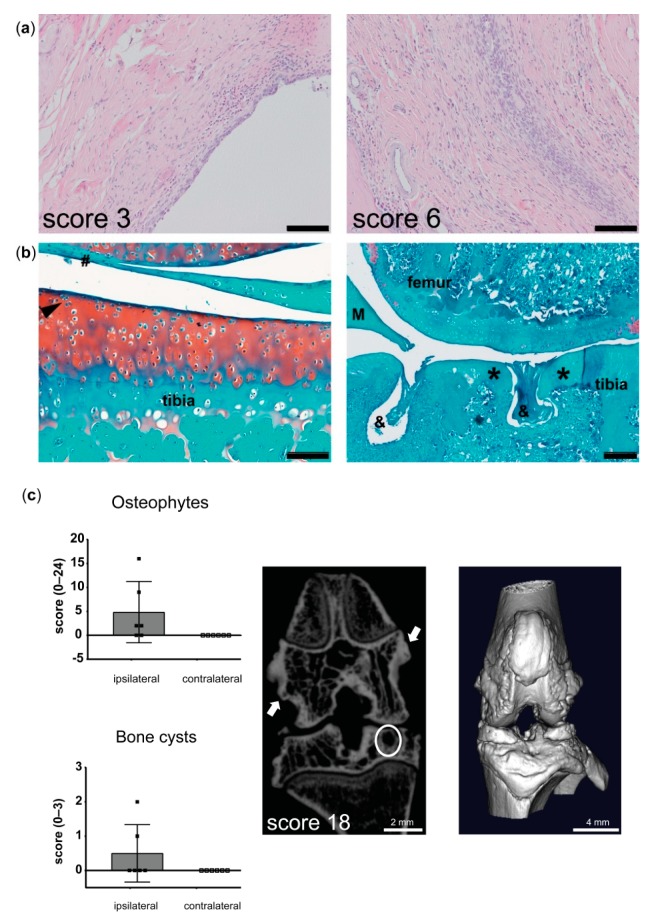
Figure 2.
Osteoarthritis (OA)-related features in joints from rats in the modified arthritis model. (a) Left; microscopic image of the best outcome of Krenn score, reflecting mild synovitis (3 out of 9), right; microscopic image of the worst outcome of Krenn score, showing moderate–severe synovitis (6 out of 9). Scale bars = 100 µm. (b) Left; microscopic image of the best outcome of Mankin score, reflecting very mild cartilage degeneration, hashtag indicates pannus formation, black arrow shows cell cloning. Scale bar = 100 µm. Right; microscopic image of the worst outcome of Mankin score. Asterisk indicates loss of proteoglycans and hypo-cellularity. Ampersand shows bone erosion. M = meniscus. Scale bar = 20 µm. (c) Left; quantification of osteophyte and bone cyst formations in the affected ipsilateral and contralateral knee joints of untreated animals that were reactivated with peptidoglycan polysaccharide (PGPS). Data represent mean ± standard deviation (SD). Right; 2D and 3D µCT image of the affected joint from an untreated rat. Arrows indicate osteophytes and a bone cyst in the tibia plateau is encircled.

