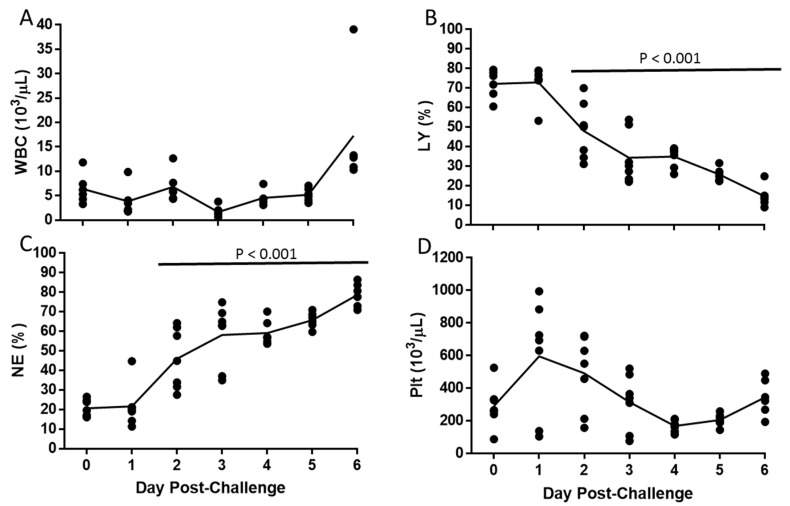
Figure 4.
Hematological Changes following EBOV Challenge. Symbols (•) represent values for individual mice and the line represents means of White Blood Cell counts (WBC; A), Percent of lymphocytes (LY; B), Percent of neutrophils (NE; C), and Platelet counts (Plt; D). Horizontal bar indicates significant difference from Day 0.

