

Abstract
Beige adipocytes are an inducible form of mitochondria-enriched thermogenic adipocytes that emerge in response to external stimuli, such as chronic cold exposure. We have previously shown that after the withdrawal of external stimuli, beige adipocytes directly acquire a white fat-like phenotype through autophagy-mediated mitochondrial degradation. We investigated the upstream pathway that mediates mitochondrial clearance and report that Parkin-mediated mitophagy plays a key role in the beige-to-white adipocyte transition. Mice genetically deficient in Park2 showed reduced mitochondrial degradation and retained thermogenic beige adipocytes even after the withdrawal of external stimuli. Norepinephrine signaling through the PKA pathway inhibited the recruitment of Parkin protein to mitochondria in beige adipocytes. However, mitochondrial proton uncoupling by uncoupling protein 1 (UCP1) was dispensable for Parkin recruitment and beige adipocyte maintenance. These results suggest a physiological mechanism by which external cues control mitochondrial homeostasis in thermogenic fat cells through mitophagy.
INTRODUCTION
The tightly regulated dichotomy of mitochondrial biogenesis and degradation maintains physiological levels of mitochondrial numbers. Under conditions that require active oxidative phosphorylation in mitochondria, mitochondrial biogenesis is induced by a set of nuclear-coded transcriptional regulators, such as nuclear respiratory factors (NRF1 and NRF2), transcription factor A, mitochondrial (TFAM), transcription factor B proteins (TFBs), and peroxisome proliferator-activated receptor γ (PPARγ) coactivator 1α/β (PGC-1α and PGC-1 β) (1, 2). On the other hand, cells undergo active mitochondrial degradation when damaged, or excess mitochondria are removed in a process referred to as mitophagy, which is the autophagic mechanism that targets mitochondria. Molecular regulation of mitophagy has become an active area of research, in part, because dysregulation in mitochondrial homeostasis is closely linked to various diseases, such as cancer, diabetes, cardiovascular diseases, and neurodegenerative diseases (3, 4).
A reduction in the mitochondrial membrane potential leads to mitophagy through protein stabilization of PINK1 [PTEN (phosphatase and tensin homolog)-induced putative kinase 1] on the outer mitochondrial membrane and subsequent recruitment of Parkin, an E3 ubiquitin ligase that ubiquitinates outer mitochondrial proteins (5–7). Subsequently, selective autophagy adaptor proteins, such as NDP52 (nuclear dot protein 52 kDa), NBR1 (neighbor of Brca1 gene 1), OPTN (optineurin), and p62 (SQSTM1), link the ubiquiti-nated mitochondrial proteins to LC3 (microtubule-associated pro-tein 1 light chain 3), leading to the formation of autophagosomes that target damaged mitochondria (8–11). Mitophagy is also activated by ubiquitin-independent mechanisms that involve BCL2L13 (BCL2- like 13, a mammalian homolog of Atg32), BNIP3 (BCL2/E1B 19 kDa- interacting protein 3), and FUNDC1 (FUN14 domain-containing protein 1), which directly interact with LC3 (12–14). The extent to which mitochondrial clearance is regulated in a cell type- or tissue-specific manner remains poorly understood.
Beige adipocytes (or beige fat) are an inducible form of thermogenic fat cells that reside within white adipose tissue (WAT). Like brown adipocytes that comprise brown adipose tissue (BAT), beige adipocytes have the thermogenic property and cristae-dense mitochondria that express uncoupling protein 1 (UCP1). Despite the similarities between brown fat and beige fat, each cell type has distinct features, including their developmental lineages, molecular regulation, and function (15,16). For instance, beige adipocytes have a UCP1-independent thermogenic mechanism that involves calcium cycling (17).
Beige fat also serves as a unique model to explore the molecular mechanisms of mitochondrial homeostasis because beige adipocytes exhibit dynamic regulation of the mitochondrial contents in response to environmental cues. For instance, chronic cold acclimation, followed by the activation of β3-adrenergic receptor (β3-AR) signaling, stimulates beige adipocyte differentiation in the subcutaneous WAT, in a process often referred to as the browning of white fat (18, 19). Intriguingly, the newly recruited beige adipocytes gradually disappear within about 2 weeks after external stimuli are withdrawn (20–23). We have previously shown that beige adipocytes directly acquire a white fat-like phenotype in conjunction with the activation of autophagy-mediated mitochondrial degradation after the withdrawal of cold stimulus or β3-AR agonist (22). We have further demonstrated that autophagy is required for the beige-to-white adipocyte transition (22); however, it remains unknown how the autophagy-mediated mitochondrial degradation is triggered during the transition process. Understanding the mechanisms that maintain beige fat is important because beige adipocytes are an attractive cellular target for the treatment of obesity and obesity-related disorders (15). Prolonged retention of beige adipocytes by the genetic ablation of Atg12 or Atg5 sufficiently increases whole-body energy expenditure and protects animals from diet- induced obesity and insulin resistance (22).
Here, we sought to determine the upstream mechanism that controlled the autophagy-mediated mitochondrial degradation during the beige-to-white adipocyte transition. We found that Parkin protein recruitment to the mitochondria, which was regulated by the β3-AR and PKA [cAMP (cyclic adenosine monophosphate)-dependent protein kinase] signaling pathway, was an essential step for the activation of mitophagy in beige fat and the maintenance of beige adipocyte thermogenesis in vivo. In contrast, UCPl-mediated proton uncoupling was dispensable for Parkin recruitment and the beige-to-white adipocyte transition. These data suggest a physiological mechanism by which mitophagy controls beige adipocyte maintenance and adipose tissue remodeling in vivo.
RESULTS
Regulation of mitophagy during the beige-to-white adipocyte transition
We have previously shown that autophagic activity in inguinal WAT (IngWAT), as assessed by the formation of LC3 punctae and the expression of autophagy-related components (such as LC3-II), is reduced in mice exposed to cold temperatures or chronically treated with the β3-AR agonist CL316,243 but is quickly reactivated upon the withdrawal of external stimuli (22). As demonstrated by morphological analysis by electron microscopy, most of the autophagosomes in the IngWAT colocalize with mitochondria and contain mitochondrial remnants, which are a morphological characteristic of mito-phagy. However, it remains unclear as to how the sympathetic nerve stimulus through the β3-AR signaling pathway regulates mitophagy per se in the adipose tissue.
To address this question, we used an animal model that allowed us to monitor mitophagy in vivo (24). In brief, mt-Keima mice express a pH-sensitive fluorescent Keima protein directed to the mitochondrial matrix, such that mitophagic activity in the adipose tissue can be quantified by flow cytometry analysis (Fig. 1A). The flow cytometry data in mature adipocytes isolated from mt-Keima mice showed that mitophagy was robustly activated by the treatment with a mitochondrial uncoupler, carbonyl cyanide p-trifluoromethoxyphenylhydrazone (FCCP) (fig. S1A). The fluorescent signal was not detected in wild-type control mice (fig. S1B). Given the heterogeneous nature of adipose tissues, the flow cytometry-based quantification was useful because it allowed us to monitor mitophagic activity in more than 10,000 adipocytes per tissue, although this method did not provide morphological evidence of mitophagy.
Fig. 1. Regulation of mitophagy during the beige-to-white adipocyte transition.
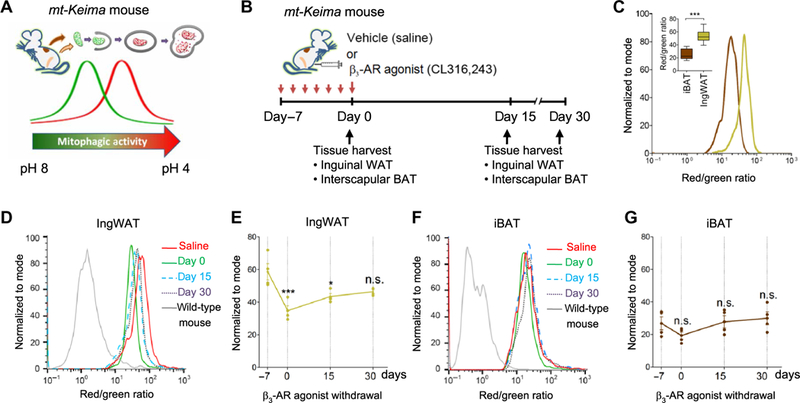
(A) Mitophagic activity in adipose tissues was monitored in vivo by using mitochondrial- targeted Keima (mt-Keima) mice. (B) Schematic illustration of the experiments. mt-Keima mice were treated with the β3-adrenergic receptor (β3-AR) agonist CL316,243 or vehicle (saline) for seven consecutive days and harvested at days 0, 15, and 30 after β3-AR agonist withdrawal. Mitophagic activity in the adipose tissue from each mouse was measured by flow cytometry. (C) Mature adipocytes were isolated from the interscapular brown adipose tissue (iBAT; brown) or the inguinal white adipose tissue (IngWAT; beige) of mt-Keima mice. Signals from green (458 nm) and red (561 nm) channels were detected by flow cytometry. ***P< 0.001 by unpaired Student’s t test. n = 8 mice per group. The inset graph shows medians with interquartile range. (D) Mitophagic activity in the IngWAT of mt-Keima mice in (B) based on the ratio of red/green fluorescence intensity. Y axis represents the number of adipocytes normalized to mode. Data are representative of four independent experiments. (E) Quantification of flow cytometry data in (D) by analyzing the median of red/green fluorescence intensity ratio. *P < 0.05 and ***P < 0.001 by one-way analysis of variance (ANOVA) with post hoc test by Tukey’s method. n.s., not significant. Data are mean ± SEM, relative to vehicle-treated mt-Keima mice. (F) Mitophagic activity in the iBAT of mt-Keima mice in (B). Data are representative of four independent experiments. (G) Quantification of flow cytometry data in (F) by analyzing the median of red/green fluorescence intensity ratio. Data are as mean ± SEM, relative to vehicle-treated mt-Keima mice.
To determine mitophagic activity during the beige-to-white adipocyte transition in vivo, we treated mt-Keima mice with the β3-AR agonist CL316,243 or vehicle (saline) for 7 days and performed the analysis immediately at the end of the 7-day treatment period (which we designated as day 0) or 15 (day 15) or 30 days (day 30) after the end of treatment (Fig. 1B). We have previously shown that the β3-AR agonist increases the number of beige adipocytes in the IngWAT at the end of the 7-day treatment (day 0 after injection) relative to vehicle-treated mice and that most of the β3-AR agonist-induced beige adipocytes adopt a white fat-like phenotype, as characterized by unilocular lipid droplets and lack of detectable UCP1 expression, at 15 days after β3-AR agonist withdrawal (22). After harvesting adipose tissue samples, mitophagic activity in the interscapular BAT (iBAT) and the IngWAT of mt-Keima mice was analyzed by flow cytometry (fig. S1, C and D). Notably, we found that the basal mitophagic activity in the IngWAT was significantly higher than that in the iBAT (Fig. 1C).
During the beige-to-white adipocyte transition, the flow cytometry analysis in the IngWAT of mt-Keima mice detected a decrease in mitophagy at day 0, as compared to vehicle-treated control mice. After β3-AR agonist withdrawal, mitophagic activity in the IngWAT gradually increased and reached levels comparable to those in vehicle-treated mice (Fig. 1D). Quantification of the mitophagic activity indicated that mitophagy in the IngWAT was significantly reduced by 40.7 and 25.9% at days 0 and 15, respectively, and returned to the basal level at day 30 of postinjection (Fig. 1E). These data are consistent with our previous observation that autophagic activity in beige adipocytes is reduced at day 0 of postinjection with chronic β3-AR agonist and gradually returns to basal levels at day 30 (22). In contrast, mitophagic activity in the iBAT was not significantly changed after b3-AR agonist treatment (Fig. 1, F and G). Martinez-Lopez et al. (25) have reported that cold exposure activates lipophagy, an autophagy-mediated degradation of lipid droplets, in iBAT and liver. Together, these results suggest that organelle-specific autophagy, or at least mitophagy and lipophagy, is differentially regulated in a cell type-specific fashion.
Requirement of Parkin for beige adipocyte maintenance in vivo
Parkin, which is encoded by the PARK2 gene, is a RING-HECT hybrid E3 ubiquitin ligase that plays a key role in the initiation of mitophagy. Although genetic deletion of Park2 is insufficient to cause a Parkinson’s disease phenotype in mice (26, 27), Park2 knockout mice (referred to as Park2 KO mice) are resistant to body weight gain under a high-fat diet, partially because of reduced lipid uptake by the fatty acid transporter CD36 (28, 29). Although the underlying cellular mechanisms by which Parkin deletion causes diet-induced obesity have yet to be fully elucidated, these studies suggest a physiological role of Parkin in body weight control. In addition, Parkin expression is increased during adipogenesis in cultured 3T3-L1 adipocytes, whereas its expression is moderately reduced when adipocytes are treated with a synthetic PPARγ ligand rosiglitazone (29, 30). Consistent with these reports, we found that Parkin expression was induced during beige adipocyte differentiation (fig. S2A). Furthermore, we found that chronic CL316,243 treatment significantly increased Park2 mRNA expression in the IngWAT, whereas it did not alter the Park2 mRNA expression in the iBAT (fig. S2B).
Because the role of Parkin in beige adipocyte maintenance has not been examined, we next examined the extent to which mitophagy through the Parkin pathway was involved in the beige-to-white adipocyte transition using Park2 KO mice (Fig. 2, A and B). In the IngWAT, adipose tissue weight did not differ between control and Park2 KO mice at day 0 after β3-AR agonist withdrawal. However, at day 15, the IngWAT of Park2 KO mice was moderately but significantly smaller than that of control mice (Fig. 2C). On the other hand, there was no significant difference in iBAT and epididymal WAT weights between control and Park2 KO mice at either time point (Fig. 2, D and E).
Fig. 2. Parkin is required for beige adipocyte maintenance in vivo.
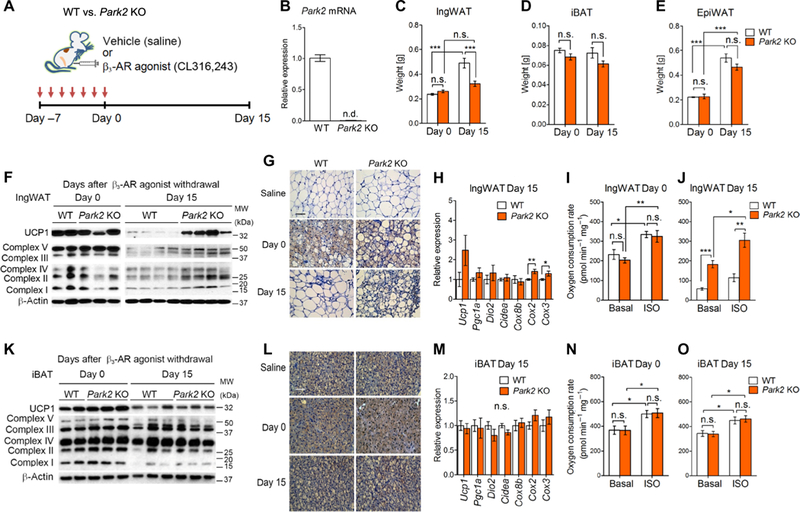
(A) Schematic illustration of the experiments. Park2 KO mice and control mice were treated with the β3-AR agonist CL316,243 or vehicle (saline) for seven consecutive days. Adipose tissue samples were harvested at days 0 and 15 after β3-AR agonist withdrawal. (B) Park2 mRNA expression in the IngWAT of control and Park2 KO mice. n.d., not detected. n = 5 mice per group. (C) Tissue weight of the IngWAT of control and Park2 KO mice at days 0 and 15 after β3-AR agonist withdrawal. ***P < 0.001 by two-way ANOVA with post hoc test by Tukey’s method. n = 6 to 8 mice per group. Data are mean ± SEM. (D) Tissue weight of the iBAT in (C). (E) Tissue weight of the epididymal WAT (EpiWAT) in (C). (F) Representative immunoblotting for uncoupling protein 1 (UCP1) and mitochondrial complexes (as indicated) in the IngWAT of control and Park2 KO mice treated with CL316,243 at days 0 and 15. β-Actin was used as a loading control. Protein molecular weight (kDa) is shown on the right. Data are representative of three independent experiments. (G) Immunohistochemistry of UCP1 in the inguinal WAT of mice in (F). Vehicle (saline)-treated mice were shown as a reference. Scale bar, 100 μm. n = 3 mice per group. (H) Relative mRNA expression of thermogenic genes (as indicated) in the IngWAT of control and Park2 KO mice at day 15 after β3-AR agonist withdrawal. *P < 0.05 and **P < 0.01 by unpaired Student’s t test. n = 8 mice per group. Data are mean ± SEM. (I) OCR in the IngWAT of control and Park2 KO mice at day 0. OCR data were shown per 1 mg of tissue. Tissues were treated with isoproterenol (ISO) or vehicle (basal). *P < 0.05 and **P < 0.01 by two-way ANOVA with post hoc test by paired or unpaired Student’s t test. n = 6 mice per group. Data are mean ± SEM. (J) OCR in the IngWAT of control and Park2 KO mice at day 15 after β3-AR agonist withdrawal. *P < 0.05, **P < 0.01, and ***P < 0.001 by two-way ANOVA with post hoc test by paired or unpaired Student’s t test. n = 6 mice per group. Data are mean ± SEM. (K) Representative immunoblotting for UCP1 and mitochondrial complexes (as indicated) in the iBAT of control and Park2 KO mice treated with CL316,243 at days 0 and 15. β-Actin was used as a loading control. The molecular weight is shown on the right. Data are representative of three independent experiments. (L) Immunohistochemistry of UCP1 in the iBAT of mice in (K). Vehicle (saline)-treated mice were shown as a reference. Scale bar, 100 μm. n = 3 mice per group. (M) Relative mRNA expression of thermogenic genes (as indicated) in the iBAT of control and Park2 KO mice at day 15 after β3-AR agonist withdrawal. n = 8 mice per group. Data are mean ± SEM. (N) OCR in the iBAT of control and Park2 KO mice at day 0. OCR data were shown per 1 mg of tissue. Tissues were treated with isoproterenol or vehicle (basal). *P < 0.05 by two-way ANOVA with post hoc test by paired or unpaired Student’s t test. n = 6 mice per group. Data are mean ± SEM. (O) OCR in the iBAT of control and Park2 KO mice at day 15 after β3-AR agonist withdrawal. *P < 0.05 by two-way ANOVA with post hoc test by paired or unpaired Student’s t test. n = 6 mice per group. Data are mean ± SEM. WT, wild type.
Next, we determined whether genetic loss of Park2 altered beige adipocyte biogenesis and maintenance in vivo. At the end of the 7-day treatment with CL316,243 (day 0), beige adipocyte biogenesis was robustly induced both in control and Park2 KO mice, as assessed by protein and mRNA expression of UCP1 and other beige fat-selective genes (Fig. 2F and fig. S2C). Histologically, we did not observe any obvious difference in the number and distribution of UCP1-positive multilocular beige adipocytes between control and Park2 KO mice (Fig. 2G, middle). These data suggest that Parkin is dispensable for beige adipocyte biogenesis per se. At day 15 after β3-AR agonist withdrawal, however, we found that the IngWAT from the Park2 KO mice expressed higher levels of UCP1 and mitochondrial respiratory chain complexes than that from control mice (Fig. 2F). Consistent with the higher UCP1 and mitochondrial proteins, Park2 KO mice had more multilocular UCP1+ beige adipocytes in the IngWAT at day 15, whereas control mice lost most of the newly recruited beige adipocytes (Fig. 2G, bottom). We also found that the expression of several mitochondrial DNA (mtDNA)-encoded transcripts, such as Cox2 and Cox3, was significantly higher in the IngWAT of Park2 KO mice than that in control mice at day 15 after β3-AR agonist withdrawal, further indicating that Park2 KO mice had more mitochondria than did control mice at day 15 (Fig. 2H). In contrast, many of the nuclear-encoded beige fat-selective genes, including Ucp1, Dio2, and Cidea, did not significantly differ between the genotypes (Fig. 2H).
Next, we determined whether the retained beige adipocytes in Park2 KO mice were thermogenically active by measuring oxygen consumption rate (OCR) of isolated IngWAT depots. There was no significant difference in OCR between control and Park2 KO mice at day 0, although enhanced cAMP signaling by isoproterenol treatment significantly increased OCR in both genotypes (Fig. 2I). At day 15, however, the IngWAT from Park2 KO mice had a significantly higher OCR than control mice in the presence or absence of isoproterenol (Fig. 2J). These data are consistent with our previous observation that OCR in the IngWAT of autophagy-deficient mice, which have Ucp1-Cre- mediated deletion of Atg5 and Atg12, is significantly higher than that in control mice after the withdrawal of cold stimulus or β3-AR agonist (22). Park2 deletion did not affect the sympathetic nerve innervation in the IngWAT of mice kept either at ambient temperature (fig. S2, D and E) or thermoneutrality (30°C) (fig. S2, F and G). We also found a similar phenotype in beige adipocyte maintenance even when mice were kept under a thermoneutral condition at 30°C: The IngWAT from Park2 KO mice expressed higher protein levels of UCP1 and mitochondrial respiratory chain complexes than that from control mice at day 15 after β3-AR agonist withdrawal under thermoneutrality (fig. S2H), although mRNA expression of nuclear-coded thermogenic genes was not affected (fig. S2I). Furthermore, OCR in the IngWAT from Park2 KO mice was significantly higher than control mice only when tissues were stimulated by isoproterenol (fig. S2J). Together, these results suggest that Park2 loss prevents mitochondrial degradation in beige fat, thereby leading to prolonged retention of thermogenic beige adipocytes even after the withdrawal of external stimuli.
In contrast, the iBAT of Park2 KO mice expressed similar levels of UCP1 and mitochondrial respiratory chain complex proteins as those of control mice both at days 0 and 15 after β3-AR agonist withdrawal (Fig. 2K). Histologically, both Park2 KO mice and control mice had similar numbers of UCP1-positive brown adipocytes in the iBAT (Fig. 2L). Similarly, the mRNA expression of many brown fat-selective genes did not significantly differ between control and Park2 KO mice at day 15 (Fig. 2M). Tissue respiration analysis showed that stimulation of cAMP production by isoproterenol increased the OCR in the iBAT depots at days 0 and 15 after β3-AR agonist withdrawal, although no significant difference was found between control and Park2 KO mice (Fig. 2, N and O).
Dispensable role of UCP1-mediated proton uncoupling in beige adipocyte maintenance
We next investigated the manner by which Parkin-mediated mito-phagy was initiated in beige adipocytes. PINK1 protein stabilization is triggered by a reduction in the mitochondrial membrane potential (which constitutes a “damage” cue), leading to the recruitment of Parkin protein into the mitochondria (5, 6). UCP1 mediates proton leak caused by proton uncoupling in the mitochondrial inner membrane in brown fat and beige fat. In addition, the loss of UCP1 protein is correlated with the loss of mitochondrial respiratory chain complexes during the beige-to-white adipocyte transition (22). Accordingly, we hypothesized that UCP1-mediated proton uncoupling was involved in the activation of mitophagy and subsequent beige-to-white adipocyte transition.
To test this hypothesis, we used Ucp1 KO mice that were chronically treated with the β3-AR agonist, CL316,243, or vehicle (saline) (Fig. 3A). Because Ucp1 KO mice are cold-sensitive and hypothermia- prone (31), and cold-induced activation of the sympathetic nerve system promotes beige adipocyte differentiation (32), the experiments were performed at thermoneutrality (30°C) to avoid compensatory activation of beige adipocyte biogenesis in Ucp1 KO mice by cold stress. IngWAT weight did not significantly differ between control and Ucp1 KO mice at either day 0 or 15 (Fig. 3B). In contrast, the iBAT of Ucp1 KO mice was significantly larger than those of control mice at day 15 (Fig. 3C). These findings are consistent with a previous study (31) and histological data showing that the iBAT of Ucp1 KO mice had larger lipid droplets than that of control mice (fig. S3A). Epididymal WAT weight did not differ between control and Ucp1 KO mice (Fig. 3D).
Fig. 3. UCP1 is dispensable for beige adipocyte maintenance in vivo.
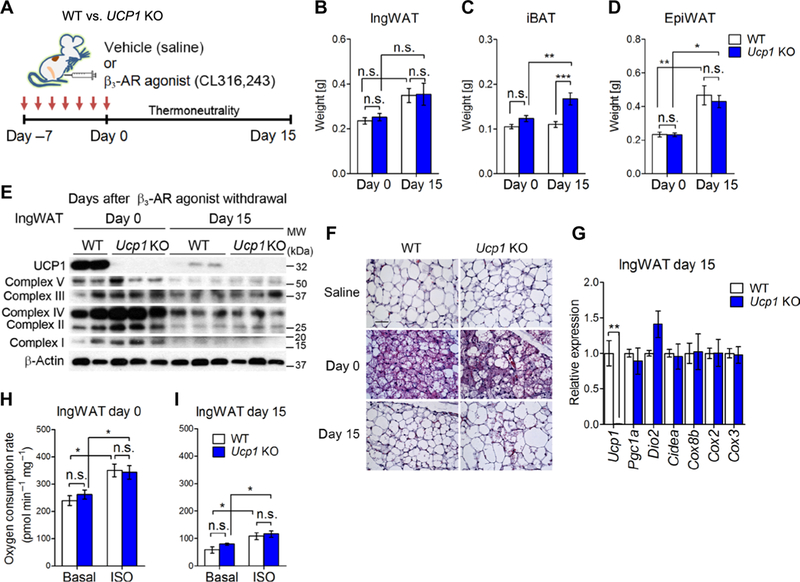
(A) Schematic illustration of the experiments. Ucp1 KO mice and control mice were treated with the β3-AR agonist CL316,243 or vehicle (saline) for seven consecutive days. Adipose tissue samples were harvested at days 0 and 15 after β3-AR agonist withdrawal under thermoneutrality (30°C). (B) Tissue weight of the IngWAT of control and Ucp1 KO mice at days 0 and 15 after β3-AR agonist withdrawal. *P < 0.05, **P < 0.01, and ***P < 0.001 by two-way ANOVA with post hoc test by Tukey’s method. n = 6 to 8 mice per group. Data are mean ± SEM. (C) Tissue weight of the iBAT in (B). (D) Tissue weight of the epididymal WAT in (B). (E) Representative immunoblotting for UCP1 and mitochondrial complexes (as indicated) in the IngWAT of control and Ucp1 KO mice treated with CL316,243 at days 0 and 15.β-Actin was used as a loading control. The molecular weight is shown on the right. Data are representative of three independent experiments. (F) Hematoxylin and eosin staining in the IngWAT of mice in (E). Vehicle (saline)-treated mice were shown as a reference. Scale bar, 100 μm. n = 3 mice per group. (G) Relative mRNA expression of thermogenic genes (as indicated) in the IngWAT of control and Ucp1 KO mice at day 15 after β3-AR agonist withdrawal. **P < 0.01 by unpaired Student’s t test. n = 3 mice per group. Data are mean ± SEM. (H) OCR in the IngWAT of control and Ucp1 KO mice at day 0 after β3-AR agonist withdrawal. OCR data were shown per 1 mg of tissue. Tissues were treated with isoproterenol or vehicle (basal). *P < 0.05 by two-way ANOVA with post hoc test by paired or unpaired t test. n = 6 mice per group. Data are mean ± SEM. (I) OCR in the IngWAT of control and Ucp1 KO mice at day 15 after β3-AR agonist withdrawal. *P < 0.05 by two-way ANOVA with post hoc test by paired or unpaired t test. n = 6. Data are mean ± SEM.
Next, we performed biochemical and histological analyses to determine the extent to which the beige-to-white adipocyte transition was altered in Ucp1 KO mice. Protein levels of mitochondrial respiratory chain complex were similar between control and Ucp1 KO mice at days 0 and 15 after β3-AR agonist withdrawal (Fig. 3E). Morphologically, CL316,243 treatment potently promoted the formation of multilocular adipocytes in the IngWAT of Ucp1 KO mice at day 0 of postinjection, whereas most of the newly recruited multilocular adipocytes disappeared by day 15 after treatment in a manner similar to that of control mice (Fig. 3F). Consistent with the protein expression and morphological data, Ucp1 KO mice expressed similar amounts of mtDNA-encoded transcripts and nuclear-encoded thermogenic genes except for Ucp1 at day 15 after β3-AR agonist withdrawal in the IngWAT (Fig. 3G) and the iBAT (fig. S3, B and C).
Last, we found that OCR in the IngWAT was similar between Ucp1 KO mice and control mice both at days 0 and 15 after β3-AR agonist withdrawal (Fig. 3, H and I). This result was somewhat unexpected because of the critical role of UCP1 for BAT thermogenesis; however, UCP1-independent thermogenic mechanisms have been identified by several studies. For example, Granneman et al. (33) have shown that chronic treatment with CL316,243 increases metabolic rate in epididymal WAT of Ucp1 KO mice. In addition, beige fat has UCP1-independent thermogenic mechanisms that are mediated by calcium cycling (17) and creatine-driven substrate cycle (34). Hence, it is likely that these UCP1-independent thermogenic mechanisms mediate the increase in OCR by isoproterenol treatment in the IngWAT of Ucp1 KO mice. Together, these data suggest that UCP1-mediated mitochondrial proton uncoupling is dispensable for beige adipocyte maintenance in vivo.
Regulation of Parkin recruitment into the mitochondria by PKA signaling
The above data suggest that mitophagy through Parkin, but not through UCPl-mediated proton uncoupling, plays a critical role in the beige-to-white adipocyte transition. Because PINK1 expression was not altered by the activation of β3-AR in beige adipocytes (fig. S4A), we next asked whether Parkin protein recruitment to the mitochondria was regulated by β3-AR signaling. Parkin protein is rapidly recruited to the mitochondria in cells treated with proton uncouplers, such as FCCP and CCCP (carbonyl cyanide m-chlorophenylhydrazine) (5–7). Consistent with these studies, we also observed that CCCP treatment in beige adipocytes promoted the recruitment of Parkin protein to the mitochondria, as assessed by the formation of yellow fluorescent protein (YFP)-Parkin punctae that colocalized with mitochondria (using Tom20 as a mitochondrial marker) (Fig. 4A). We found that Parkin recruitment to mitochondria was potently inhibited by norepinephrine treatment even in the presence of CCCP. This finding is consistent with the results obtained from mt-Keima mice in which pharmacological activation of β3-AR by CL316,243 significantly reduced mitophagic activity in beige fat (Fig. 1).
Fig. 4. Norepinephrine inhibits Parkin protein recruitment to depolarized mitochondria in beige adipocytes through the PKA pathway.
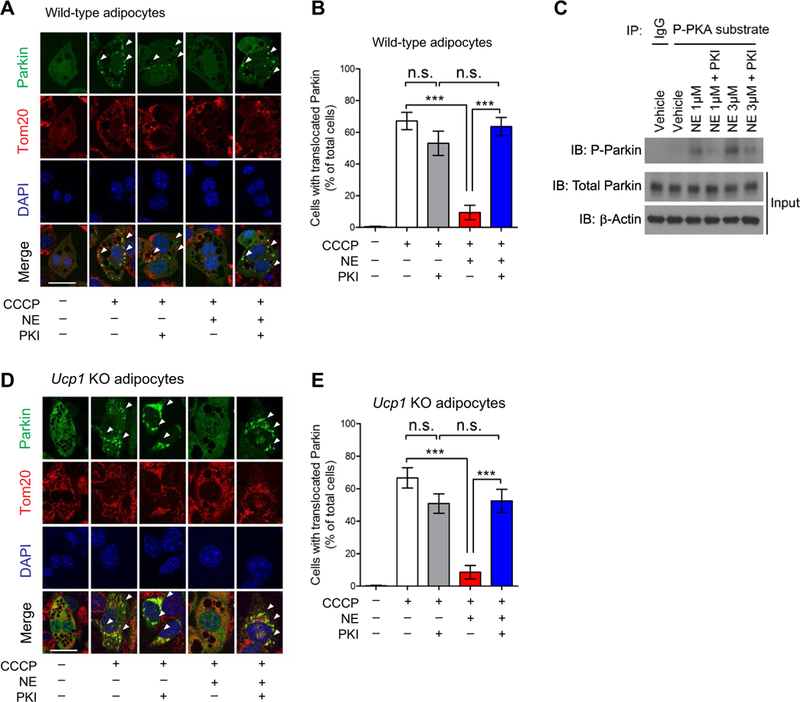
(A) Yellow fluorescent protein (YFP)-Parkin was expressed in beige adipocytes derived from wild-type mice. Differentiated adipocytes were pretreated with a PKA [cAMP (cyclic adenosine monophosphate)-dependent protein kinase] inhibitor (PKI) or vehicle for 1 hour. Cells were treated with norepinephrine (NE) for 30 min and CCCP (carbonyl cyanide m-chlorophenylhydrazine) for 3 hours. Mitochondria were stained for Tom20 (red), and nuclei were stained with 4’,6-diamidino-2-phenylindole (DAPI) (blue). YFP-Parkin localization to the mitochondria was analyzed by confocal microscopy. Arrowheads indicate punctae of YFP-Parkin recruitedto the mitochondria. Scale bars, 20 μm. (B) Quantification of Parkin localization in the mitochondria in (A). ***P < 0.001 by one-way ANOVA with post hoc test by Tukey’s method. A total of 405 cells from 10 independent images were analyzed for each experimental group. Data are mean ± SEM. The study was repeated in three independent experiments. (C) Phosphorylated (P) Parkin protein was detected by immunoprecipitation (IP) of phospho-PKA substrates followed by immunoblotting (IB) using a Parkin antibody. Wild-type inguinal cells were pretreated with vehicle or PKI and then with norepinephrine at 1 or 3 μM for 30 min. Immunoblotting of total Parkin and β-actin is shown (Input). The study was repeated in three independent experiments. IgG, immunoglobulin G. (D) YFP-Parkin was expressed in UCP1-null beige adipocytes derived from Ucpl KO mice. The experiments were performed according to (A). Scale bars, 20 μm. (E) Quantification of Parkin mitochondrial localization in Ucpl KO beige adipocytes in (D). ***P < 0.001 by one-way ANOVA with post hoc test by Tukey’s method. A total of 360 cells from 10 independent images were analyzed for each experimental group. Data are mean ± SEM.
Because the PKA pathway is a primary downstream effector of β3-AR signaling in adipose tissues (32), we next asked whether pharmacological inhibition of PKA signaling alters Parkin recruitment to the beige fat mitochondria by pretreating beige adipocytes with the specific PKA inhibitor PKI before stimulating with norepinephrine. Although PKA inhibition alone did not alter Parkin localization, it significantly blunted the inhibitory effect of norepinephrine on Parkin recruitment to depolarized mitochondria (Fig. 4, A and B).We also observed a similar change in Parkin recruitment when the cells were pretreated with the chemical PKA inhibitor H89 (fig. S4, B and C). As an alternative approach to validate these observations, we also used two independent small interfering RNAs (siRNAs) targeting the catalytic subunit of PKA (PKACA encoded by the Prkaca gene) to inhibit PKA signaling in beige adipocytes (fig. S4D). Consistent with the results obtained with PKA inhibitors, we found that the repressive effect of norepinephrine on Parkin recruitment to depolarized mitochondria was significantly blunted when Prkaca was depleted by siRNAs (fig. S4, E and F). Because several kinases, including PKA, can phosphoryl- ate Parkin protein at five Ser residues (35), we next examined the extent to which Parkin phosphorylation was regulated by norepinephrine-induced PKA signaling in beige adipocytes. We found that norepinephrine treatment potently induced Parkin phosphorylation, whereas PKA inhibition by PKI greatly reduced norepinephrine-stimulated Parkin phosphorylation (Fig. 4C). Parkin phosphorylation mediated by PKA was inversely associated with Parkin recruitment to the depolarized mitochondria in beige adipocytes.
Last, to determine whether UCPl-mediated proton uncoupling altered Parkin recruitment to the mitochondria, we established an immortalized adipocyte line from the IngWAT of Ucp1 KO mice. We found that CCCP treatment potently induced Parkin recruitment to the mitochondria in Ucp1 KO adipocytes, an effect that was inhibited in Ucp1 KO and wild-type adipocytes by norepinephrine (Fig. 4D). Blockade of PKA signaling by PKI significantly blunted the inhibitory effect of norepinephrine on Parkin recruitment in Ucp1 KO adipocytes (Fig. 4E). These data suggest that the PKA signaling pathway controls Parkin recruitment to the mitochondria and subsequent activation of mitophagy in a UCPl-independent manner.
DISCUSSION
The role of Parkin in adipose tissue remodeling, especially during the beige-to-white adipocyte transition, has been unclear. Here, we showed that Parkin-mediated mitophagy played an essential role in beige adipocyte maintenance in vivo, such that genetic deletion of Park2 potently prevented the beige-to-white adipocyte transition. In contrast, proton uncoupling by UCP1 was not required for Parkin recruitment to the mitochondria and beige adipocyte maintenance. The data indicate that beige adipocytes distinctly sense UCPl-mediated proton uncoupling from depolarization signals in damaged mitochondria. Mechanistically, we found that activation of β3-AR signaling through the PKA pathway, an essential mediator of cold-induced thermogenesis in adipose tissue, led to Parkin protein phosphorylation and prevented Parkin recruitment to the depolarized mitochondria independently of UCP1 expression. These results are consistent with the ability of PKA-mediated phosphorylation of the mitochondrial inner membrane protein MIC60 (also known as mitofilin) to prevent Parkin recruitment to damaged mitochondria (36). Although the functional requirement of MIC60 for beige adipocyte maintenance remains unknown, temporal inhibition of the MIC60-Parkin axis in adipose tissues may lead to an effective approach to retain thermogenic beige adipocytes for a prolonged period even after the withdrawal of external stimuli.
Another intriguing observation may be found in the differential regulation of mitochondrial homeostasis between brown fat and beige fat. Consistent with our previous study using mice that were unable to induce autophagy specifically in brown fat and beige fat (Ucp1 -Cre-mediated deletion of Atg5 and Atg12) (22), we found that Park2 KO mice retained more thermogenic beige adipocytes in the IngWAT than did control mice for a prolonged period after β3-AR agonist withdrawal. In contrast, mitochondrial content in the iBAT did not obviously differ between Park2 KO mice and control mice, at least, within 15 days after β3-AR agonist withdrawal. Notably, mitochondrial biogenesis in the IngWAT (which occurs in beige adipocytes) is quickly decreased after the withdrawal of external cues, whereas mitochondrial biogenesis in the iBAT (which occurs in brown adipocytes) remains constitutively active (22). On the other hand, the present study using mt-Keima mice found higher basal mitophagic activity in the IngWAT relative to the iBAT. Accordingly, it is conceivable that the tissue-selective regulation of mitochondrial biogenesis and clearance contributes to the distinct mitochondrial homeostasis between brown fat and beige fat.
Temporal and cell-specific inhibition of mitophagy would be beneficial to maintain energy expenditure and systemic glucose homeostasis for a short period (22, 37, 38). Park2 KO mice exhibit higher energy expenditure than control mice and are protected from diet- induced body weight gain (29), likely due, in part, to prolonged retention of thermogenic beige adipocytes. However, long-term inhibition of autophagy may lead to the accumulation of damaged mitochondria in metabolically active tissues and cause deleterious effects, such as adult-onset insulin resistance and glucose intolerance. For instance, whole-body p62 KO mice develop adult-onset obesity, leptin resistance, and glucose intolerance (39). In addition, genetic ablation of p62 with aP2-Cre leads to impaired BAT thermogenesis, mitochondrial dysfunction, and inflammation (40), although the specific contribution of p62-mediated mitophagy to the BAT phenotype requires further investigation, given the multifunctional roles of p62 in signaling pathways in addition to autophagy (41, 42). Future studies will seek to critically determine the beneficial and detrimental effects of temporal and fat-specific mitophagy inhibition on whole-body energy homeostasis and glucose metabolism by using adipocyte-specific inducible KO mouse models.
MATERIALS AND METHODS
Animals
All the animal experiments were performed under the guidelines established by the University of California, San Francisco (UCSF) Institutional Animal Care and Use Committee. mt-Keima mice, Park2 KO mice, and Ucp1 KO mice were reported previously (19, 21, 26). These mice were all in the Bl6 background. Ucp1 KO mice and Park2 KO mice were first acclimated to thermoneutrality (30°C) for 7 days and subsequently treated with CL316,243 at a dose of 1 mg kg−1 body weight. The other experiments were performed under ambient temperature at 22°C. Adipose tissues were fixed in 4% paraformaldehyde, followed by 70% ethanol, and embedded in paraffin, sectioned at 7 μm, and stained with hematoxylin and eosin. Images were acquired with Leica DM2000 digital camera.
Cell culture
The stromal vascular fractions (SVFs) were isolated from the IngWAT of wild-type or Ucp1 KO mice. The SVFs were immortalized by infection of SV40 large T antigen, as previously reported (17). The immortalized SVFs were cultured in advanced Dulbecco’s minimum essential medium (DMEM)/F12 medium containing 10% fetal bovine serum (FBS). Beige adipocyte differentiation was induced by treating confluent preadipocytes with DMEM containing 10% FBS, 0.5 mM isobutylmethylxanthine, 125 nM indomethacin, dexamethasone (2 μg ml−1), 850 nM insulin, 1 nM T3, and 0.5 μM rosiglitazone, according to the method described previously (43, 44). Two days after induction, cells were switched to the maintenance medium containing 10% FBS, 850 nM insulin, 1 nM T3, and 0.5 μM rosiglitazone. To deplete the catalytic subunit of PKA (PKACA encoded by the Prkaca gene) in beige adipocytes, two independent siRNAs targeting Prkaca (catalog #SR411864, OriGene) or a scrambled control were transfected in immortalized beige preadipocytes, according to the protocol that we used previously (45). The transfected cells were differentiated under the aforementioned adipogenic medium.
Adipose tissue imaging of mt-Keima mouse
IngWAT and iBAT depots were dissected from mt-Keima mice and visualized immediately using Leica TCS SP5 microscopy (confocal and multiphoton). Fluorescence of mt-Keima mice was imaged in two channels through two sequential excitations (480 nm for green and 561 nm for red, respectively), with a scan speed of 600 lines per second, a pixel size of 30 to 50 nm (1024 × 1024 pixels), and four line averages. Figures were assembled using Adobe Photoshop CS3 software.
Flow cytometry
To isolate primary adipocytes, IngWAT depots from mt-Keima mice were digested to single cells using collagenase D (1.5 U ml−1) and dispase II (2.5 U ml−1). Cells were analyzed by FACS LSR II flow cytometer (BD Biosciences), as described previously (19). Cells (about 10,000 cells per tissue) were excited with both a violet (407 nm) and a green laser (532 nm) with emission assessed simultaneously using a 605 ± 20-nm (V605) and a 610 ± 10-nm (G610) detector. Adipocytes were first gated on the basis of size and granularity. Dead cells were removed on the basis of SYTOX Blue (1:400) staining. Fluorescence-positive cells were gated on the basis of primary adipocytes isolated from wild-type mouse as a negative control. FlowJo software was used for data analysis. Mitophagic flux was represented as histogram of red- to-green ratio, and y-axis was normalized to mode. Median of red- to-green ratio was used for quantification of mitophagy.
Immunobloting and immunoprecipitation
Protein lysates from adipose tissues were extracted using Qiagen TissueLyser LT and NP-40 lysis buffer containing 50 mM tris (pH 7.4), 150 mM NaCl, 5 mM EDTA, 1% NP-40, and cOmplete protease inhibitors (Roche). Conjugated β-actin (1:10,000; A3854, Sigma-Aldrich) was used as loading control for each sample. UCP1 antibody (1:1000; U6382, Sigma-Aldrich) was used to detect mouse UCP1 protein. Total OXPHOS rodent WB antibody cocktail (1:1000; ab110413, Abcam) was used to detect complex I subunit NDUFB8 (20 kDa), complex II subunit SDHB (30 kDa), complex III core protein 2 (48 kDa), complex IV subunit I-MTCO1 (40 kDa), and complex V alpha subunit- ATP5a (55 kDa). For immunoprecipitation, cell lysates were extracted by NP-40 lysis buffer containing 50 mM tris (pH 7.4), 150 mM NaCl, 5 mM EDTA, 1% NP-40, cOmplete protease inhibitors (Roche), and phosphatase inhibitor cocktail 2 and 3. Phosphorylated Parkin was detected by immunoprecipitation using the phospho-PKA substrate antibody (1:1000; 96221s, Cell Signaling Technology), followed by immunoblot using the Parkin (PRK8) antibody (1:1000; sc-32282, Santa Cruz Biotechnology).
Tissue immunohistochemistry
Tissues were fixed in 4% paraformaldehyde, embedded in paraffin, and sectioned into 7 μm. Antigen retrieval was processed after rehydration in citrate acid buffer (pH 6.0) at 95°C for 15 min. Methanol containing 0.3% H2O2 was used for peroxidase blocking for 15 min, followed by Avidin/Biotin (PK6100, Vector Labs) blocking for additional 15 min at room temperature. The sections were then blocked with phosphate-buffered saline (PBS) containing 10% goat serum for 1 hour at room temperature and incubated overnight with the anti- UCP1 primary antibody (1:200; ab10983, Abcam) at 4°C. The sections were subsequently stained with secondary antibody for 1 hour at room temperature. Images were acquired with Leica DM2000 digital camera.
Parkin localization assay
Complementary DNA (cDNA) encoding YFP-Parkin fusion protein was expressed in beige adipocytes that were derived from wild-type mice or Ucp1 KO mice. Differentiated adipocytes were pretreated with a PKA inhibitor (PKI 4–22 amide) at 2 μM or vehicle for 1 hour. Subsequently, the cells were treated with norepinephrine at 1 μM for 30 min and CCCP (10 μM) for 3 hours. The cells were fixed with 4% paraformaldehyde for 15 min at ambient temperature, rinsed with PBS, and exposed to 0.1% Triton X-100 for 15 min. After incubating with PBS containing 2% bovine serum albumin for 30 min, the cells were incubated with rabbit polyclonal antibody against Tom20 (1:200; FL-145, sc-11415, Santa Cruz Biotechnology) overnight at 4°C. The slides were then stained with secondary antibodies for 2 hours at ambient temperature and counterstained with DAPI (300 nM in PBS; D1306, Invitrogen,) for 30 min and mounted in Vectashield (Vector Labs). Imaging of the cell was visualized by using Leica TCS SP5 microscopy (multiphoton confocal microscopy). Nuclei were visualized by DAPI staining (405 nm). Parkin recruitment to the mitochondria was determined on the basis of the merged images of YFP-Parkin (488 nm) and Tom20 (594 nm) within a cell. For each experimental group, 10 pictures were randomly chosen from five independent culture wells. Parkin protein recruitment to the mitochondria was analyzed by examining at least 300 cells that were randomly selected from each experimental group. The number of cells counted in each experiment is described in the figure legends.
RNA preparation and quantitative RT-PCR
Total RNA was extracted from adipose tissues and adipocytes using TRIzol and the RNeasy Mini Kit (Qiagen). The cDNAs were synthesized by iScript (Bio-Rad) following the manufacturer’s protocol. Quantitative real-time polymerase chain reaction (RT-PCR) was performed using ABI ViiA7 PCR instrument. The primer sequences are listed in table S1.
OCR assay
OCR in the IngWAT and the iBAT was measured using the Seahorse XFe Extracellular Flux Analyzer (Agilent). Adipose tissues (0.5 mg for the iBAT and 1.5 mg for the IngWAT) were placed into XF24 Islet Capture Microplates and preincubated with assay media for 1 hour in the presence of 5 μM isoproterenol (I6504–500MG, Sigma-Aldrich) or vehicle. The XF assay medium was supplemented with 1 mM sodium pyruvate, 2 mM GlutaMAX-I, and 25 mM glucose. Tissues were subjected to mitochondrial stress tests by adding 10 μM oligomycin (9996, Cell Signaling Technology), followed by 20 μM FCCP (C2920–10MG, Sigma-Aldrich) and 20 μM antimycin (A8674–50MG, Sigma-Aldrich).
Statistics
Statistical analyses were performed using GraphPad Prism 5 (GraphPad Software Inc.) and SPSS (SPSS 18.0; IBM Japan). All the data were represented as mean ± SEM. A two-sample unpaired Student’s t test was used for two-group comparisons, as appropriate. One- or two-way ANOVA with post hoc comparisons by Tukey’s method, paired, or unpaired t test was used for the comparisons between multiple groups, as appropriate. P ≤ 0.05 was considered significant throughout the study.
Supplementary Material
Acknowledgments:
We are grateful to K. Nakamura (UCSF) for providing the Parkin KO mice,J. Debnath (UCSF) for YFP-Parkin constructs, and R. Kelly (UCSF) for his scientific input. We also thank M. Yoneshiro, O. Byakina, and Z. Brown for their technical support.
Funding: This work was funded by the NIH (DK97441 and DK108822), the Pew Charitable Trusts, and the Edward Mallinckrodt, Jr. Foundation (to S.K.). We also acknowledge supports from China Postdoctoral Council IPEFP and 2014M551176 (to X.L.) and UCSF Diabetes and Endocrinology Research Center (DK63720).
Footnotes
Competing interests: The authors declare that they have no competing interests.
Data and materials availability: All the reagents, including the cells and plasmids used in this study, are available upon a material transfer agreement with UCSF. All data needed to evaluate the conclusions in the paper are present in the paper or the Supplementary Materials.
REFERENCES AND NOTES
- 1.Kelly DP, Scarpulla RC, Transcriptional regulatory circuits controlling mitochondrial biogenesis and function. Genes Dev. 18, 357–368 (2004). [DOI] [PubMed] [Google Scholar]
- 2.Dominy JE, Puigserver P, Mitochondrial biogenesis through activation of nuclear signaling proteins. Cold Spring Harb. Perspect. Biol. 5, a015008 (2013). [DOI] [PMC free article] [PubMed] [Google Scholar]
- 3.Altshuler-Keylin S, Kajimura S, Mitochondrial homeostasis in adipose tissue remodeling. Sci. Signal. 10, eaai9248 (2017). [DOI] [PMC free article] [PubMed] [Google Scholar]
- 4.Evans TD, Sergin I, Zhang X, Razani B, Target acquired: Selective autophagy in cardiometabolic disease. Sci. Signal. 10, eaag2298 (2017). [DOI] [PMC free article] [PubMed] [Google Scholar]
- 5.Narendra DP, Min Jin S., Tanaka A, Suen D-F, Gautier CA, Shen J, Cookson MR, Youle RJ, PINK1 is selectively stabilized on impaired mitochondria to activate Parkin. PLOS Biol. 8, e1000298 (2010). [DOI] [PMC free article] [PubMed] [Google Scholar]
- 6.Narendra D, Tanaka A, Suen D-F, Youle RJ, Parkin is recruited selectively to impaired mitochondria and promotes their autophagy. J. Cell Biol. 183, 795–803 (2008). [DOI] [PMC free article] [PubMed] [Google Scholar]
- 7.Matsuda N, Sato S, Shiba K, Okatsu K, Saisho K, Gautier CA, Sou YS, Saiki S, Kawajiri S, Sato F, Kimura M, Komatsu M, Hattori N, Tanaka K, PINK1 stabilized by mitochondrial depolarization recruits Parkin to damaged mitochondria and activates latent Parkin for mitophagy. J. Cell Biol. 189, 211–221 (2010). [DOI] [PMC free article] [PubMed] [Google Scholar]
- 8.Sarraf SA, Raman M, Guarani-Pereira V, Sowa ME, Huttlin EL, Gygi SP, Harper JW, Landscape of the PARKIN-dependent ubiquitylome in response to mitochondrial depolarization. Nature 496, 372–376 (2013). [DOI] [PMC free article] [PubMed] [Google Scholar]
- 9.Lazarou M, Sliter DA, Kane LA, Sarraf SA, Wang C, Burman JL, Sideris DP, Fogel AI, Youle RJ, The ubiquitin kinase PINK1 recruits autophagy receptors to induce mitophagy. Nature 524, 309–314 (2015). [DOI] [PMC free article] [PubMed] [Google Scholar]
- 10.Heo JM,Ordureau A, Paulo JA, Rinehart J, Harper JW, The PINK1-PARKIN mitochondrial ubiquitylation pathway drives a program of OPTN/NDP52 recruitment and TBK1 activation to promote mitophagy. Mol. Cell 60, 7–20 (2015). [DOI] [PMC free article] [PubMed] [Google Scholar]
- 11.Kirkin V, Lamark T, Sou YS, Bjørkøy G, Nunn JL, Bruun JA, Shvets E, McEwan DG, Clausen TH, Wild P, Bilusic I, Theurillat JP, Øvervatn A, Ishii T, Elazar Z, Komatsu M, Dikic I, Johansen T, A role for NBR1 in autophagosomal degradation of ubiquitinated substrates. Mol. Cell 33, 505–516 (2009). [DOI] [PubMed] [Google Scholar]
- 12.Murakawa T, Yamaguchi O, Hashimoto A, Hikoso S, Takeda T, Oka T, Yasui H, Ueda H, Akazawa Y, Nakayama H, Taneike M, Misaka T, Omiya S, Shah AM, Yamamoto A, Nishida K, Ohsumi Y, Okamoto K, Sakata Y, Otsu K, Bcl-2-like protein 13 is a mammalian Atg32 homologue that mediates mitophagy and mitochondrial fragmentation. Nat. Commun. 6, 7527 (2015). [DOI] [PMC free article] [PubMed] [Google Scholar]
- 13.Hanna RA, Quinsay MN, Orogo AM, Giang K, Rikka S, Gustafsson AB, Microtubule- associated protein 1 light chain 3 (LC3) interacts with Bnip3 protein to selectively remove endoplasmic reticulum and mitochondria via autophagy. J. Biol. Chem. 287, 19094–19104 (2012). [DOI] [PMC free article] [PubMed] [Google Scholar]
- 14.Liu L, Feng D, Chen G, Chen M, Zheng Q, Song P, Ma Q, Zhu C, Wang R, Qi W, Huang L, Xue P, Li B, Wang X, Jin H, Wang J, Yang F, Liu P, Zhu Y, Sui S, Chen Q, Mitochondrial outer-membrane protein FUNDC1 mediates hypoxia-induced mitophagy in mammalian cells. Nat. Cell Biol. 14, 177–185 (2012). [DOI] [PubMed] [Google Scholar]
- 15.Kajimura S, Spiegelman BM, Seale P, Brown and beige fat: Physiological roles beyond heat generation. CellMetab. 22, 546–559 (2015). [DOI] [PMC free article] [PubMed] [Google Scholar]
- 16.Harms M, Seale P, Brown and beige fat: Development, function and therapeutic potential. Nat. Med. 19, 1252–1263 (2013). [DOI] [PubMed] [Google Scholar]
- 17.Ikeda K, Kang Q, Yoneshiro T, Camporez JP, Maki H, Homma M, Shinoda K, Chen Y, Lu X, Maretich P, Tajima K, Ajuwon KM, Soga T, Kajimura S, UCP1-independent signaling involving SERCA2b-mediated calcium cycling regulates beige fat thermogenesis and systemic glucose homeostasis. Nat. Med. 23, 1454–1465 (2017). [DOI] [PMC free article] [PubMed] [Google Scholar]
- 18.Young P, Arch JRS, Ashwell M, Brown adipose tissue in the parametrial fat pad of the mouse. FEBS Lett. 167, 10–14 (1984). [DOI] [PubMed] [Google Scholar]
- 19.Loncar D, Afzelius BA, Cannon B, Epididymal white adipose tissue after cold stress in rats. I. Nonmitochondrial changes. J. Ultrastruct. Mol. Struct. Res. 101, 109–122 (1988). [DOI] [PubMed] [Google Scholar]
- 20.Gospodarska E, Nowialis P, Kozak LP, Mitochondrial turnover: A phenotype distinguishing brown adipocytes from interscapular brown adipose tissue and white adipose tissue. J. Biol. Chem. 290, 8243–8255 (2015). [DOI] [PMC free article] [PubMed] [Google Scholar]
- 21.Rosenwald M, Perdikari A, Rulicke T, Wolfrum C, Bi-directional interconversion of brite and white adipocytes. Nat. Cell Biol. 15, 659–667 (2013). [DOI] [PubMed] [Google Scholar]
- 22.Altshuler-Keylin S, Shinoda K, Hasegawa Y, Ikeda K, Hong H, Kang Q, Yang Y, Perera RM, Debnath J, Kajimura S, Beige adipocyte maintenance is regulated by autophagy-induced mitochondrial clearance. Cell Metab. 24, 402–419 (2016). [DOI] [PMC free article] [PubMed] [Google Scholar]
- 23.Loncar D, Convertible adipose tissue in mice. Cell Tissue Res. 266, 149–161 (1991). [DOI] [PubMed] [Google Scholar]
- 24.Sun N, Yun J, Liu J, Malide D, Liu C, Rovira II, Holmström KM, Fergusson MM, Yoo YH, Combs CA, Finkel T, Measuring in vivo mitophagy. Mol. Cell 60, 685–696 (2015). [DOI] [PMC free article] [PubMed] [Google Scholar]
- 25.Martinez-Lopez N, Garcia-Macia M, Sahu S, Athonvarangkul D, Liebling E, Merlo P, Cecconi F, Schwartz GJ, Singh R, Autophagy in the CNS and periphery coordinate lipophagy and lipolysis in the brown adipose tissue and liver. Cell Metab. 23, 113–127 (2016). [DOI] [PMC free article] [PubMed] [Google Scholar]
- 26.Goldberg MS, Fleming SM, Palacino JJ, Cepeda C, Lam HA, Bhatnagar A, Meloni EG, Wu N, Ackerson LC, Klapstein GJ, Gajendiran M, Roth BL, Chesselet M-F, Maidment NT, Levine MS, Shen J, Parkin-deficient mice exhibit nigrostriatal deficits but not loss of dopaminergic neurons. J. Biol. Chem. 278, 43628–43635 (2003). [DOI] [PubMed] [Google Scholar]
- 27.Perez FA, Palmiter RD, Parkin-deficient mice are not a robust model of parkinsonism. Proc. Natl. Acad. Sci. U.S.A. 102, 2174–2179 (2005). [DOI] [PMC free article] [PubMed] [Google Scholar]
- 28.Palacino JJ, Sagi D, Goldberg MS, Krauss S, Motz C, Wacker M, Klose J, Shen J, Mitochondrial dysfunction and oxidative damage in parkin-deficient mice. J. Biol. Chem. 279, 18614–18622 (2004). [DOI] [PubMed] [Google Scholar]
- 29.Kim K-Y, Stevens MV, Akter MH, Rusk SE, Huang RJ, Cohen A, Noguchi A, Springer D, Bocharov AV, Eggerman TL, Suen D-F, Youle RJ, Amar M, Remaley AT, Sack MN, Parkin is a lipid-responsive regulator of fat uptake in mice and mutant human cells. J. Clin. Invest. 121, 3701–3712 (2011). [DOI] [PMC free article] [PubMed] [Google Scholar]
- 30.Taylor D, Gottlieb RA, Parkin-mediated mitophagy is downregulated in browning of white adipose tissue. Obesity 25, 704–712 (2017). [DOI] [PMC free article] [PubMed] [Google Scholar]
- 31.Enerbäck S, Jacobsson A, Simpson EM, Guerra C, Yamashita H, Harper M-E, Kozak LP, Mice lacking mitochondrial uncoupling protein are cold-sensitive but not obese. Nature 387, 90–94 (1997). [DOI] [PubMed] [Google Scholar]
- 32.Collins S, β-Adrenoceptor signaling networks in adipocytes for recruiting stored fat and energy expenditure. Front. Endocrinol. 2, 102 (2012). [DOI] [PMC free article] [PubMed] [Google Scholar]
- 33.Granneman JG, Burnazi M, Zhu Z, Schwamb LA, White adipose tissue contributes to UCP1-independent thermogenesis. Am. J. Physiol. 285, E1230–E1236 (2003). [DOI] [PubMed] [Google Scholar]
- 34.Kazak L, Chouchani ET, Jedrychowski MP, Erickson BK, Shinoda K, Cohen P, Vetrivelan R, Lu GZ, Laznik-Bogoslavski D, Hasenfuss SC, Kajimura S, Gygi SP, Spiegelman M, A creatine-driven substrate cycle enhances energy expenditure and thermogenesis in beige fat. Cell 163, 643–655 (2015). [DOI] [PMC free article] [PubMed] [Google Scholar]
- 35.Yamamoto A, Friedlein A, Imai Y, Takahashi R, Kahle PJ, Haass C, Parkin phosphorylation and modulation of its E3 ubiquitin ligase activity. J. Biol. Chem. 280, 3390–3399 (2005). [DOI] [PubMed] [Google Scholar]
- 36.Akabane S, Uno M, Tani N, Shimazaki S, Ebara N, Kato H, Kosako H, Oka T, PKA regulates PINK1 stability and Parkin recruitment to damaged mitochondria through phosphorylation of MIC60. Mol. Cell 62, 371–384 (2016). [DOI] [PubMed] [Google Scholar]
- 37.Zhang Y, Goldman S, Baerga R, Zhao Y, Komatsu M, Jin S, Adipose-specific deletion of autophagy-relatedgene 7 (atg7) in mice reveals a role in adipogenesis. Proc. Natl. Acad. Sci. U.S.A. 106, 19860–19865 (2009). [DOI] [PMC free article] [PubMed] [Google Scholar]
- 38.Singh R, Xiang Y, Wang Y, Baikati K, Cuervo AM, Luu YK, Tang Y, Pessin JE, Schwartz GJ, Czaja MJ, Autophagy regulates adipose mass and differentiation in mice. J. Clin. Invest. 119, 3329–3339 (2009). [DOI] [PMC free article] [PubMed] [Google Scholar]
- 39.Rodriguez A, Durán A, Selloum M, Champy MF, Diez-Guerra FJ, Flores JM, Serrano M, Auwerx J, Diaz-Meco MT, Moscat J, Mature-onset obesity and insulin resistance in mice deficient in the signaling adapter p62. Cell Metab. 3, 211–222 (2006). [DOI] [PubMed] [Google Scholar]
- 40.Müller TD, Lee SJ, Jastroch M, Kabra D, Stemmer K, Aichler M, Abplanalp B, Ananthakrishnan G, Bhardwaj N, Collins S, Divanovic S, Endele M, Finan B, Gao Y, Habegger KM, Hembree J, Heppner KM, Hofmann S, Holland J, Küchler D, Kutschke M, Krishna R, Lehti M, Oelkrug R, Ottaway N, Perez-Tilve D, Raver C, Walch AK, Schriever SC, Speakman J, Tseng Y-H, Diaz-Meco M, Pfluger PT, Moscat J, Tschöp MH, p62 links β-adrenergic input to mitochondrial function and thermogenesis. J. Clin. Invest. 123, 469–478 (2013). [DOI] [PMC free article] [PubMed] [Google Scholar]
- 41.Moscat J, Diaz-Meco MT, p62 at the crossroads of autophagy, apoptosis, and cancer. Cell 137, 1001–1004 (2009). [DOI] [PMC free article] [PubMed] [Google Scholar]
- 42.Moscat J, Karin M, Diaz-Meco MT, p62 in cancer: Signaling adaptor beyond autophagy. Cell 167, 606–609 (2016). [DOI] [PMC free article] [PubMed] [Google Scholar]
- 43.Ohno H, Shinoda K, Spiegelman BM, Kajimura S, PPARγ agonists induce a white-to-brown fat conversion through stabilization of PRDM16 protein. Cell Metab. 15, 395–404 (2012). [DOI] [PMC free article] [PubMed] [Google Scholar]
- 44.Liisberg Aune U, Ruiz L, Kajimura S, Isolation and differentiation of stromal vascular cells to beige/brite cells. J. Vis. Exp. 73, e50191 (2013). [DOI] [PMC free article] [PubMed] [Google Scholar]
- 45.Shinoda K, Luijten IH, Hasegawa Y, Hong H, Sonne SB, Kim M, Xue R, Chondronikola M, Cypess AM, Tseng YH, Nedergaard J, Sidossis LS, Kajimura S, Genetic and functional characterization of clonally derived adult human brown adipocytes. Nat. Med. 21, 389–394 (2015). [DOI] [PMC free article] [PubMed] [Google Scholar]
Associated Data
This section collects any data citations, data availability statements, or supplementary materials included in this article.