Descours and colleagues1 reported a marked enrichment for HIV among CD32a+ CD4 T cells in people receiving anti-retroviral therapy (ART). This tiny CD32a+ population (0.012% of all blood CD4 T cells) contained a median of 0.56 HIV DNA genomes per cell, and accounted for 26.8–86.3% of HIV DNA in CD4 T cells, thus suggesting that targeting CD32a+ CD4 T cells might help to clear HIV reservoirs in vivo. Here, we report our unsuccessful attempts to confirm these findings. There is a Reply to this Comment by Descours, B. et al. Nature 561, https://doi.org/10.1038/s41586-018-0496-1 (2018).
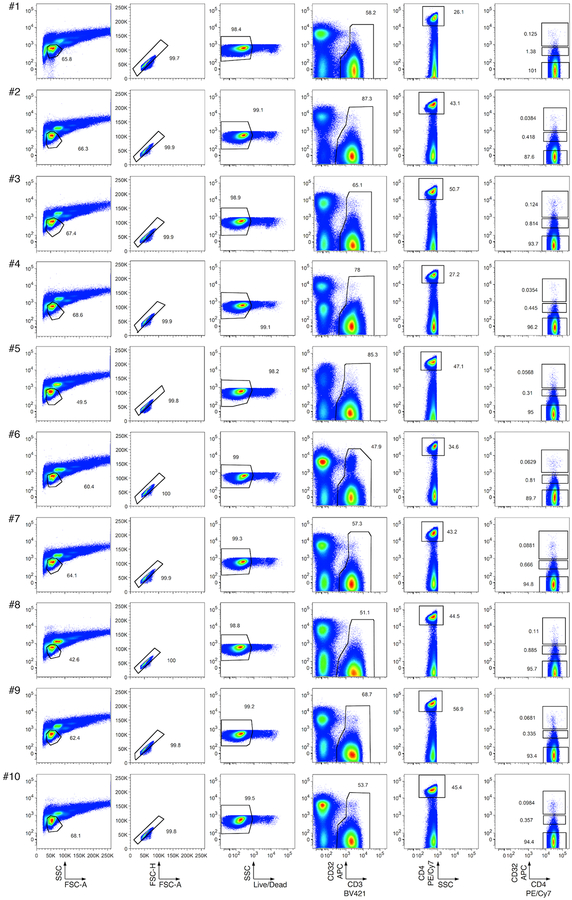
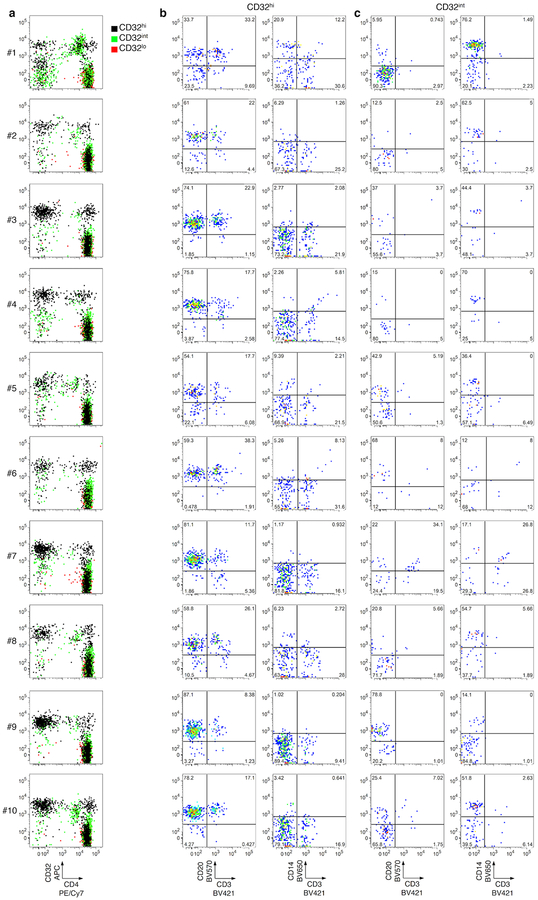
We first used fluorescence-activated cell sorting (FACS) to sort CD4 T cells with high, intermediate and low levels of CD32 staining (CD32hi, CD32int and CD32lo, respectively) from 10 individuals with chronic HIV infection who were receiving ART (mean duration, 8.8 years; range, 2.7–15). We used cell-staining reagents and gating techniques that matched those used by Descours et al.1 (see Supplementary Methods and Extended Data Fig. 1). As shown in Fig. 1a, we detected no enrichment for HIV DNA in the CD32hi or CD32int CD4 T cells. Moreover, the CD32hi and CD32int subsets combined accounted for no more than 3% of all HIV DNA copies within circulating CD4 T cells in any of the 10 study participants (Fig. 1b). Post-sort flow cytometry of CD32hi and CD32int populations showed heterogeneous patterns that suggested the formation of T cell–B cell or T cell–monocyte conjugates as the origin of most CD32hi or CD32int CD4 T cells, with separation of these conjugates during sorting (Extended Data Fig. 2).
Fig. 1. Levels of HIV DNA in CD32hi, CD32int and CD32lo CD4 T cells, sorted from PBMCs of 10 ART-treated participants, as in Descours et al.1.
a, Copies of HIV DNA per million sorted cells. b, Percentages of all HIV DNA copies detected in blood CD4 T cells that were detected within each subset, calculated by adjusting values in a for the relative proportions of these subsets in FACS data. In all figures, horizontal bars denote median values, and open symbols indicate detection limits for measurements in which HIV DNA was not detected.
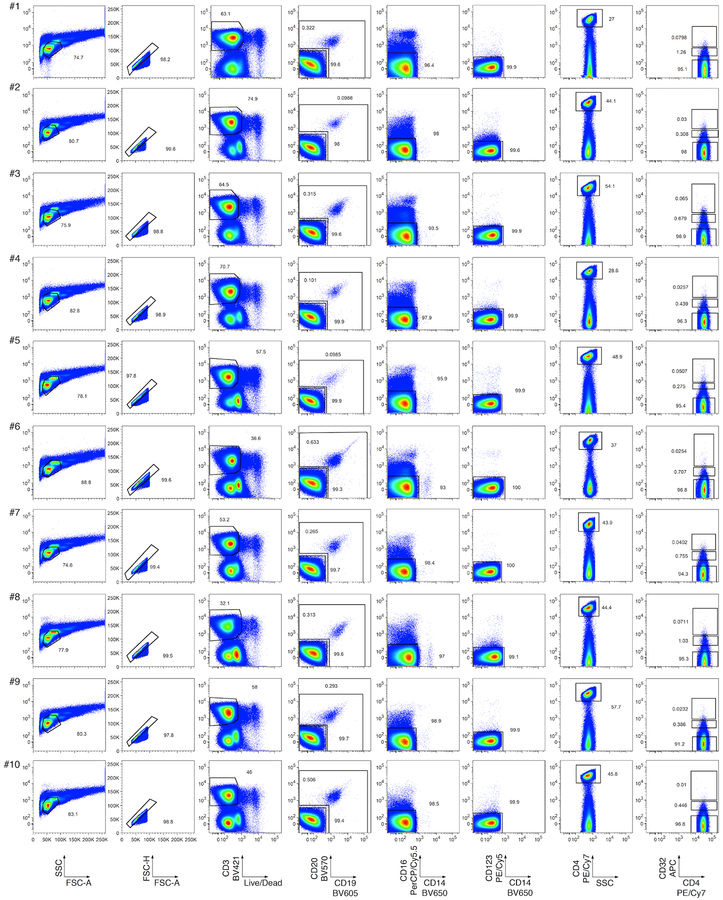
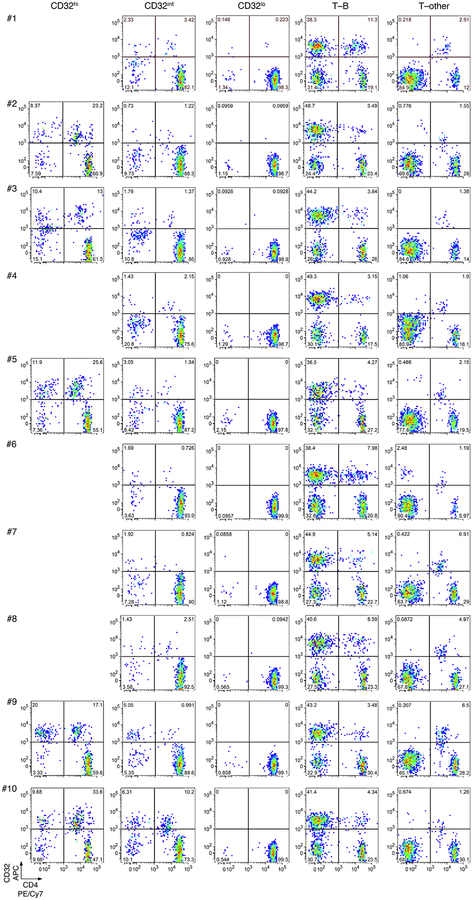
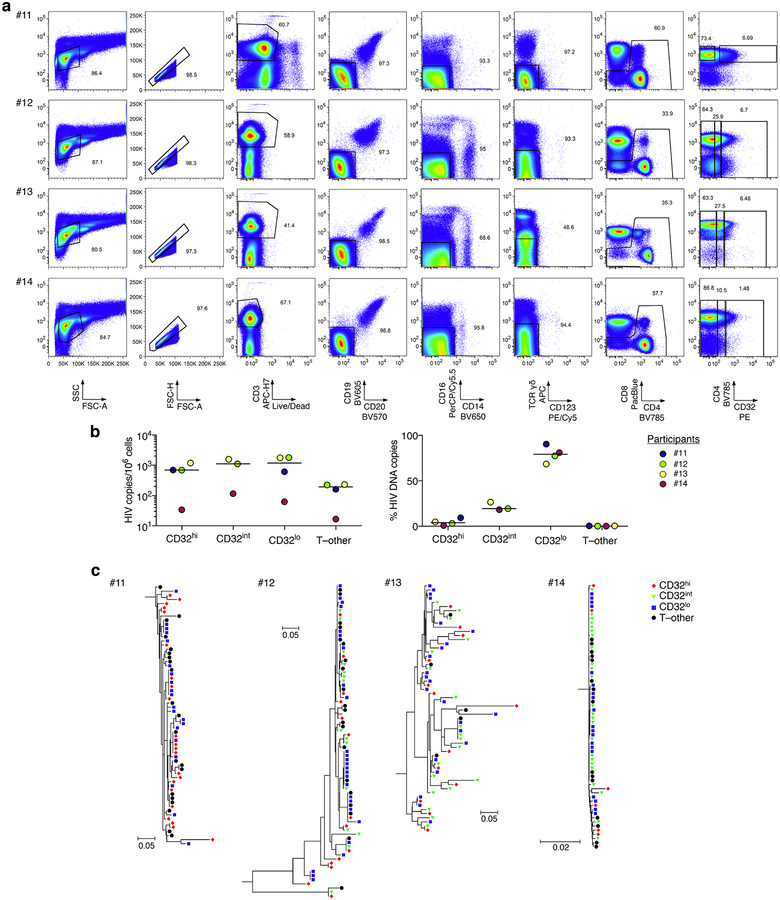
To rule out the possibility that we had inadvertently obtained false negative results either by excluding HIV-infected, CD32+ CD4 T cells using tight light scatter gates or by failing to exclude non-T-cell contaminants, we performed parallel sorts on the same 10 samples using an alternative gating scheme. We used a more inclusive light scatter gate as well as markers for B cells, monocytes, dendritic cells and natural killer cells (Extended Data Fig. 3). Events that were CD3+ were separated into fractions that were positive for B cell markers (T–B), positive for one or more other non-CD4-T-cell markers (T–other), or negative for all of these, positive for CD4, and CD32hi, CD32int or CD32lo. Neither CD32hi nor CD32int CD4 T cells were enriched for HIV DNA (Fig. 2a). Similarly, we detected no enrichment for HIV DNA in the T–B and T–other populations (Fig. 2a). In each of the 10 participants, at least 96% of all HIV DNA copies occurred in conventional CD32lo cells (Fig. 2b). Post-sort flow cytometry suggested that most events bearing both T-cell and non-CD4-T-cell markers again represented cell–cell conjugates, and also showed that most remaining CD32hi CD4 T cells did not reproducibly show a high CD32 signal after sorting (Extended Data Fig. 4). This was in contrast to conventional CD32lo cells, which were uniformly pure in post-sort analyses across participants. In a second group of four individuals whose peripheral blood mononuclear cells (PBMCs) were sorted without previous cryopreservation (Extended Data Fig. 5a), we again found no enrichment for HIV DNA based on CD32 expression (Extended Data Fig. 5b), and also observed that HIV DNA sequences in CD32+ CD4 T cells were genetically intermingled with HIV DNA sequences in other CD4 T cells (Extended Data Fig. 5c).
Fig. 2. Levels of HIV DNA in CD32hi, CD32int and CD32lo CD4 T cells, sorted using alternative gating.
The samples from Fig. 1 were sorted using alternative gating in which T cells bearing markers of B cells (T–B) or other non-CD4-T-cell lineages (T–other) were first collected in separate tubes. a, Copies of HIV DNA per million sorted cells. b, Percentages of all HIV DNA copies detected in blood cells that were detected within each subset, calculated by adjusting values in a for the relative proportions of these subsets in FACS data.
Overall, our studies showed no enrichment for HIV DNA in CD32+ CD4 T cells, and also raised questions about the source of the CD32 labelling on these cells. We propose that the CD32 expression associated previously with CD4 T cells could have arisen from adherent non-T-cells or cellular material bearing this marker, and that conjugates containing HIV-infected CD4 T cells could be differentially produced and/or recovered in different laboratories with different sample processing and FACS practices. It is important to acknowledge that these considerations do not explain the discrepancy between the Descours et al. study1 and ours in the quantities of HIV DNA detected within CD3+CD4+CD32+ sorted material. Nevertheless, we wish to emphasize that our findings do not support targeting CD32 molecules on CD4 T cells in emerging HIV cure strategies.
Methods
Participant recruitment and informed consent were performed under Institutional Review Board (IRB)-approved protocols at the US National Institutes of Health (NIH). For FACS, whole PBMCs were stained with monoclonal antibodies matching those used by Descours et al.1 (see Supplementary Methods) and sorted on a BD FACSAria. To evaluate purity, a portion of each population was re-analysed on the flow cytometer after sorting. Virus DNA copies in sorted cells were enumerated by fluorescence-assisted clonal amplification2. DNA recovery was quantified by albumin (ALB) quantitative PCR. Because the FUN-2 monoclonal antibody used by Descours et al.1 and in our study may recognize both CD32a and CD32b, we refer to cells staining with this monoclonal antibody as CD32+.
Extended Data
Extended Data Fig. 1. Flow cytometry of CD32hi, CD32int and CD32lo CD4 T cell populations from PBMCs.
Single lymphocytes (first two columns) that were viable (third column), CD3+ (fourth column), CD4+ (fifth column), and CD32hi, CD32int or CD32lo (sixth column) were sorted as described in Descours et al.1
Extended Data Fig. 2. Post-sort flow cytometry of CD3+CD4+ subsets that were CD32hi, CD32int or CD32lo.
Cells were sorted as in Extended Data Fig. 1. a, Overlay plots of CD32 and CD4 expression by cells in CD32hi, CD32int and CD32lo sorted populations. Note the heterogeneous pattern of cells from the CD32hi and CD32int populations. b, c, CD20, CD14 and CD3 staining in the CD32+ cells from the CD32hi (b) and the CD32int (c) subsets. Note the large proportions of all CD32+ cells bearing surface markers consistent with B cells (CD20+CD3−) or monocytes (CD14+CD3−) after sorting.
Extended Data Fig. 3. Flow cytometry of PBMCs sorted by alternative gating for CD32hi, CD32int and CD32lo CD4 T cell populations, as well as T cell populations bearing markers of B cells (T–B) or other non-CD4-T-cells (T–other).
Cells in an inclusive light scatter gate consistent with either small lymphocytes or larger cells (first column) were enriched for single cells (second column). Within these gates, viable CD3+ cells (third column) that were CD19− and CD20− (lower gate, fourth column), CD16− and CD14− (fifth column), CD123− (sixth column), CD4+ (seventh column), and CD32hi, CD32int or CD32lo were then collected. Cells that were CD3+ and bearing markers of B cells (T–B; upper gate, fourth column) or other non-CD4-T-cells (T–other; combined ungated events from fifth and sixth columns) were also collected in separate tubes.
Extended Data Fig. 4. Post-sort flow cytometry of CD32 and CD4 expression by CD32hi, CD32int, CD32lo, T–B and T–other cell subsets.
Cells were sorted as in Extended Data Fig. 3. Note the large proportions of all CD32+ cells that did not show high CD4 expression after sorting. Post-sort analyses of CD3+CD4+CD32hi populations were deferred in cases in which these populations were too small to permit both post-sort analysis and downstream HIV DNA quantification (that is, donors # 1, 4 and 6–8).
Extended Data Fig. 5. Flow cytometry, HIV DNA levels, and single-copy HIV DNA sequence analysis from CD32hi, CD32int and CD32lo CD4 T cell populations, and from T cells also bearing non-CD4-T-cell markers.
a, PBMCs from four additional study participants were collected from whole blood by venipuncture with immediate processing (without cryopreservation). The T–other population was collected as a combination of the ungated events from CD19/CD20, CD16/CD14 and γδ T cell receptor/CD123 exclusion plots (fourth, fifth and sixth columns). b, Left, copies of HIV DNA per million cells sorted from four additional study participants as in a. Right, percentages of all HIV DNA copies detected in blood cells deriving from CD32hi, CD32int, CD32lo and T–other subsets, calculated by adjusting values in the left panel for the relative proportions of these subsets determined using FACS data. c, Sequences of individual HIV DNA copies were determined by Sanger sequencing of products obtained by fluorescence-assisted clonal amplification, which amplifies a region of the HIV env gene. Phylogenetic trees were constructed as described in the Supplementary Methods. All Bonferroni-corrected Slatkin–Maddison P values for genetic compartmentalization between any two subsets were greater than 0.05 in all four participants.
Supplementary Material
Footnotes
Data availability
All DNA sequences in this manuscript (analysed in Extended Data Fig. 5) have been deposited in GenBank under accession numbers MH080310–MH080572.
Competing interests Declared none.
Extended data accompanies this Comment.
Supplementary information accompanies this Comment.
References
- 1.Descours B et al. CD32a is a marker of a CD4 T-cell HIV reservoir harbouring replication-competent proviruses. Nature 543, 564–567 (2017). [DOI] [PubMed] [Google Scholar]
- 2.Boritz EA et al. Multiple origins of virus persistence during natural control of HIV infection. Cell 166, 1004–1015 (2016). [DOI] [PMC free article] [PubMed] [Google Scholar]
Associated Data
This section collects any data citations, data availability statements, or supplementary materials included in this article.


