Abstract
Background:
There are strong links between obesity, diabetes and hepatocellular carcinoma (HCC), but molecular mechanisms remain unclear.
Aim:
We tested the proposed involvement of NF-κB, IL-6/STAT3 and Akt/mTORC1 before onset (at 3 months) and at onset (6 months) of accelerated hepatocarcinogenesis in DEN-injected obese and diabetic foz/foz compared to lean wildtype (Wt) mice, and also studied the hepatocyte proliferative response to DNA damage between the obese and lean lines.
Methods:
Male foz/foz and Wt littermates fed normal chow were DEN-injected (10mg/kg i.p.) at age 12-15 days. To test the effect of mTOR inhibitor on growth of dysplastic hepatocytes, a separate cohort of DEN-injected foz/foz mice was administered rapamycin (4 mg/kg body weight/day).
Results:
foz/foz mice developed obesity, hyperinsulinemia, diabetes, adipokine dysregulation and fatty liver, without increased serum or liver TNF-α or serum IL-6. All DEN-injected foz/foz mice developed HCC by 6 mths vs. 0/10 lean Wt. At 3 mths, there were more dysplastic hepatocytes in DEN-injected foz/foz than Wt, with increased liver injury (serum ALT), hepatocyte apoptosis (M30-positive cells) and proliferation (cyclin D1, cyclin E, PCNA), but neither NF-κB nor STAT3 activation. foz/foz livers exhibited upregulation of DNA damage sensors ATM and ATR, with inadequate cell cycle checkpoint controls (CHK1, CHK2, p53, p21). Akt and mTORC1 were highly activated in livers from foz/foz vs. Wt mice. Despite such activation, rapamycin failed to reduce growth of dysplastic hepatocytes.
Conclusions:
Accelerated DEN-induced HCC in obese/diabetic mice is linked to enhanced growth of dysplastic hepatocytes that cannot be attributed to NF-κB or IL-6/STAT3 activation, nor to sustained mTORC1 activation. The critical mechanism for obesity-enhanced hepatocarcinogenesis lies in the disconnection between hepatocellular injury with DNA damage, and an unrestrained proliferative response.
Relevance for patients:
This study supports the epidemiological data linking obesity, diabetes and fatty liver disease with increased risk for developing HCC. The findings also suggest that mTORC1 inhibition may not be beneficial in the prevention of obesity-related hepatocarcinogenesis.
Keywords: ataxia-telangiectasia mutated, glutathione-S-transferase pi, rapamycin, interleukin-6, signal transducer and activator of transcription 3
1. Introduction
Obesity increases hepatocellular carcinoma (HCC) risk up to 4-fold [1-3], but the molecular pathways driving such promotion of hepatocarcinogenesis remain unclear. Park et al. [4] produced evidence that tumor necrosis factor-α (TNF-α) signaling to enhance IL-6 production and could be correlated with HCC development in obese mice. However, not all obese models show increases in pro-inflammatory cytokines [5,6]. Further, although abrogation of IL-6 signaling by knockout of IL-6 receptor α (IL-6Rα) prevents DEN-induced HCC in lean mice, Il-6r α-/- mice fed a high-fat developed liver tumours to the same extent as Wt [7]. Thus, while IL-6-dependent signaling plays a role in diethylnitrosamine (DEN)-induced HCC in lean mice, obesity is more likely to promote hepatocarcinogenesis by a different mechanism.
Another potential link between obesity and HCC is hyperinsulinemia resulting from insulin resistance, which exerts growth effects either directly or via release of insulin-like growth factor-1 (IGF-1) [8,9]. In hepatocytes, protein kinase B (Akt) and mammalian target of rapamycin complex 1 (mTORC1) are important mediators of insulin action [10,11]; ~ 40-50% of HCCs demonstrate Akt activation, and/or mTOR activation [12,13]. A role for mTORC1 in hepatocarcinogenesis is further supported by findings in mice with liver-specific knockout of tuberous sclerosis protein 1 (Tsc1-/-). TSC1 constitutively suppresses mTORC1, and its inactivation leads to sustained mTORC1 activation [14]. mTORC1 activation also occurred in a dietary obesity model [4], but mTORC1 inhibition failed to suppress hepatocarcinogenesis. Instead, mTOR inhibition by rapamycin increased liver injury, IL-6 release and signal transducer and activator of transcription 3 (STAT3) activation [15].
In Mdr2-/- mice, hepatocarcinogenesis is associated with activation of the DNA damage-response machinery that increases genomic instability [16], a feature of human HCC [17]. Earlier, we used mice defective for the non-homologous end joining pathway of DNA strand break repair, Ku70-/- mice, to show how DEN injection caused chromosomal instability (CIN), with resultant loss of p53 function that facilitated accelerated onset of hepatocarcinogenesis [18]. Together, these findings indicate that cellular responses to DNA damage, an expected consequence of oxidative stress in non-alcoholic steatohepatitis (NASH) or cirrhosis, cause CIN, which in turn contributes to the multistep process of hepatocarcinogenesis. The present studies predicated that such a pathway may explain accelerated hepatocarcinogenesis in obesity and diabetes-related fatty liver disease.
To clarify the tumorigenic effects of obesity in hepatocarcinogenesis, we employed foz/foz mice, an obesity model in which key features of human metabolic obesity occur [19,20]: diabetes, metabolic syndrome and non-alcoholic fatty liver disease (NAFLD)/NASH. We first sought correlations between the rapid onset of HCC in obese foz/foz mice with serum cytokine changes and hepatocyte activation of NF-κB and STAT3 that others have suggested important. Having found no such associations, we clarified the strong associations between hyperinsulinemia and Akt/mTORC1 activation, then tested whether blockade of mTORC1 with rapamycin could slow onset of hepatocarcinogenesis. Finally, we characterized the DNA damage response in DEN-injected obese mice. This allowed us to identify defective signaling to cell cycle checkpoint regulators as the defect central to accelerated development of HCC in obese and diabetic mice.
2. Materials and Methods
2.1. Animals
Male Alms1 mutant (foz/foz) NOD.B10 mice and wild type (Wt) littermates were injected intraperitoneally (i.p) with DEN (10 mg/kg); saline to controls at 12-15 days of age (n = 11-12 mice/group). From weaning, they were fed chow diet (Specialty Feeds, Glen Forrest, Australia) to the times indicated in figure legends. All animal experiments were approved by the Australian National University Animal Ethics Committee (protocol A2011/40).
2.2. Rapamycin in vivo study
DEN-injected male foz/foz mice were fed a chow diet with or without rapamycin (4 mg/kg body weight/day, LC Laboratories, Woburn, MA, USA) (n = 9-10 mice/group) to 3 mths of age. Two weeks before sacrifice, glucose tolerance was measured after intraperitoneal glucose injection (2 g/kg body weight).
2.3. Serum and hepatic lipid analyses
Serum biochemistry was measured using automated techniques (ACT Pathology, the Canberra Hospital). Serum insulin (Millipore, Billerica, MA, USA), leptin, adiponectin, IL-6, TNF-α, IGF-1 and IGF-BP3 (R&D systems, Minneapolis, MN, USA) were measured by enzyme-linked immunosorbent assay (ELISA). Hepatic triglycerides and cholesterol ester were quantified using high-performance liquid chromatography (HPLC) as reported [21] and results were normalized to wet liver weight (g).
2.4. Liver histology and immunohistochemistry
Formalin-fixed, paraffin-embedded liver sections (4 µm) were stained with hematoxylin and eosin (H&E). Histological diagnosis for HCC was performed blindly by an experienced liver pathologist. Dysplastic hepatocytes were visualized by glutathione-S-transferase pi (GST-pi, gift from Philip Board, John Curtin School of Medical Research, Australia), immunohistochemistry (IHC), hepatocyte apoptosis by M30 (cytokeratin-18 [CK-18]-fragmentation peptide) IHC, and proliferation by proliferating cell nuclear antigen (PCNA) IHC, as described [18].
2.5. Analysis of hepatic genes and proteins
Gene and protein expression were assayed using semi-quantitative real time PCR and immunoblotting, respectively as previously reported [22]. Primer sequences and antibody conditions will be supplied upon request.
2.6. Statistical Analyses
Data (mean ± SEM) were analyzed by one-way or two-way analysis of variance (ANOVA) followed by post-hoc analysis using Bonferroni’s multiple comparison test. Statistical analyses were performed using GraphPad Prism 6.02 (GraphPad Software, CA, USA). P < 0.05 was considered significant.
3. Results
3.1. DEN-induced hepatocarcinogenesis is accelerated in foz/ foz mice in association with metabolic complications of obesity
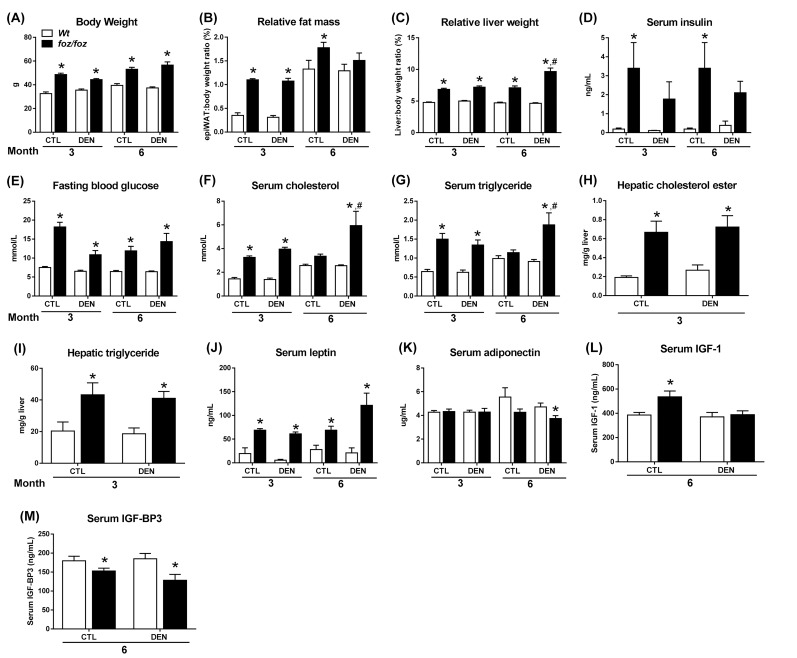
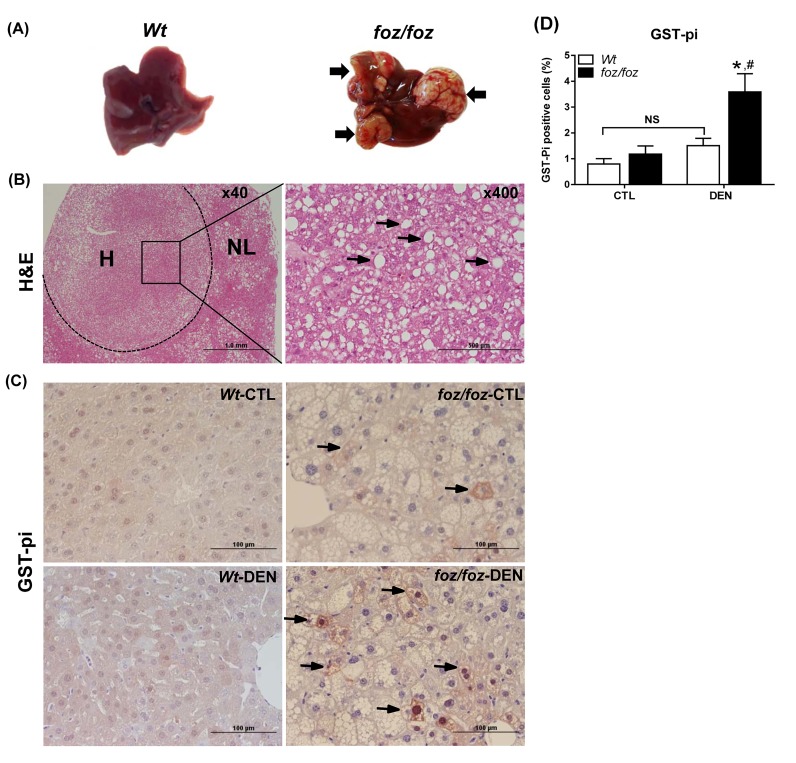
As reported [19,22], foz/foz mice were heavier than Wt at 3 and 6 mths (Figure 1A), with increased adiposity (peri-epi-didymal white adipose tissue (WAT) mass; Figure 1B) and hepatomegaly (Figure 1C). At 3 mths, there were no macroscopic liver nodules in DEN-injected foz/foz or Wt mice (Table 1), but all foz/foz mice developed HCC by 6 mths (Table 1; Figure 2A), with two mice bearing lung metastases. No Wt (lean) littermates had macroscopic liver tumours at this time (Table 1; Figure 2A). As shown in Figure 2B, histological examination of these tumors showed features described as the steatohepatitic variant of HCC, with large- droplet steatosis and mild inflammatory cell infiltration [23]. Relative liver weight was greater in DEN-injected obese mice at 6 mths (Figure 1C), which was attributable to large tumour burden (Figure 2A). In contrast, relative liver weight of Wt mice was unchanged (Figure 1C), consistent with only 1-2 pin point nodules observed in DEN-injected Wt mice at 6 mths (data not shown). At 9 mths, all mice developed HCC but lung metastases were more frequent in foz/foz mice, consistent with the earlier onset and more aggressive nature of HCC in obese/diabetic mice (Table 1). Since the focus of the present studies was on the molecular pathways that precede onset of obesity-related HCC, subsequent measurements were performed on tissues harvested at 3 and/or 6 mths.
Figure 1. Body weight, tissue weights, and metabolic parameters in foz/foz and Wt mice. (A) Body weight, (B) relative epididymal white adipose tissue (epiWAT) mass and (C) relative liver weight in saline (CTL) and DEN-injected foz/foz and Wt mice. (D) Serum insulin was quantified by enzyme-linked immunosorbent assay (ELISA) and (E) blood glucose was determined after fasting for 4 hrs. Serum (F) cholesterol and (G) triglyceride in foz/foz and Wt mice were measured using automated techniques (see Materials and Methods). Hepatic (H) cholesterol esters and (I) triglycerides levels at 3 mths were determined by high-performance liquid chromatography. Serum (J) leptin, (K) adiponectin, (L) IGF-1 and (M) IGF-BP3 were measured by ELISA. Data are mean ± SEM (n = 9-15) mice/group. *P < 0.05, vs. treatment-matched, genotype control, #P < 0.05, vs. genotype-matched, treatment control, by one way or two-way ANOVA with Bonferroni’s post hoc test.
Table 1. HCC incidence and frequency of lung metastases in foz/foz and Wt mice.
| Genotype | 3 mths | 6 mths | 9 mths | ||
|---|---|---|---|---|---|
| HCC | HCC | Metastases | HCC | Metastases | |
| Wt | 0 | 0/11 | – | 11/11 (100%) | 1/11 (9.1%) |
| foz/foz | 0 | 12/12 (100%) | 2/12 (17%) | 11/11 (100%) | 7/11 (64%) |
Abbreviations: mths, months; HCC, hepatocellular carcinoma; Wt, wild-type.
Figure 2. foz/foz mice display steatohepatitic HCC at 6 mths and increased number of dysplastic hepatocytes at 3 mths compared to Wt mice. (A) Gross appearance of livers from DEN-injected foz/foz and Wt mice at 6 mths. Arrows point to some of the tumours. (B) Representative H&E stained liver sections from a DEN-injected foz/foz mouse show HCC (H) and surrounding non-tumorous liver (NL) (x40 magnification), and a typical steatohepatitic HCC (x400 magnification). Arrows point to macrovesicular steatosis. (C) GST-pi IHC in liver sections from 3-mth-old foz/foz and Wt mice was used to determine dysplastic hepatocytes. Arrows indicate GST-pi-positive hepatocytes (x400 magnification). (D) Quantification of GST-pi-positive cells (see Materials and methods). Data are mean ± SEM from 9-10 mice/group. *P < 0.05, vs. treatment-matched, genotype control, #P < 0.05, vs. genotype-matched, treatment control.
foz/foz mice exhibited hyperleptinemia (Figure 1J), while serum adiponectin was lower than Wt only in 6-mth-old DEN-treated foz/foz mice (Figure 1K). At both 3 and 6 mths, serum insulin was higher in foz/foz than Wt, albeit the apparent difference was not significant in DEN-treated mice (Figure 1D). Fasting blood glucose (FBG) was also increased (Figure 1E), all foz/foz mice developed diabetes (FBG > 8 mml/L), and serum cholesterol and triglyceride were higher (Figure 1F,G). DEN injection exacerbated these changes in foz/foz but not Wt mice. Consistent with the metabolic changes, livers of foz/foz vs. Wt mice at 3 mths showed increased hepatic cholesterol ester and triglyceride content (Figure 1H,I).
3.2. Enhanced growth of dysplastic hepatocytes in obese, diabetic foz/foz mice is associated with increased liver injury and hepatocellular proliferation
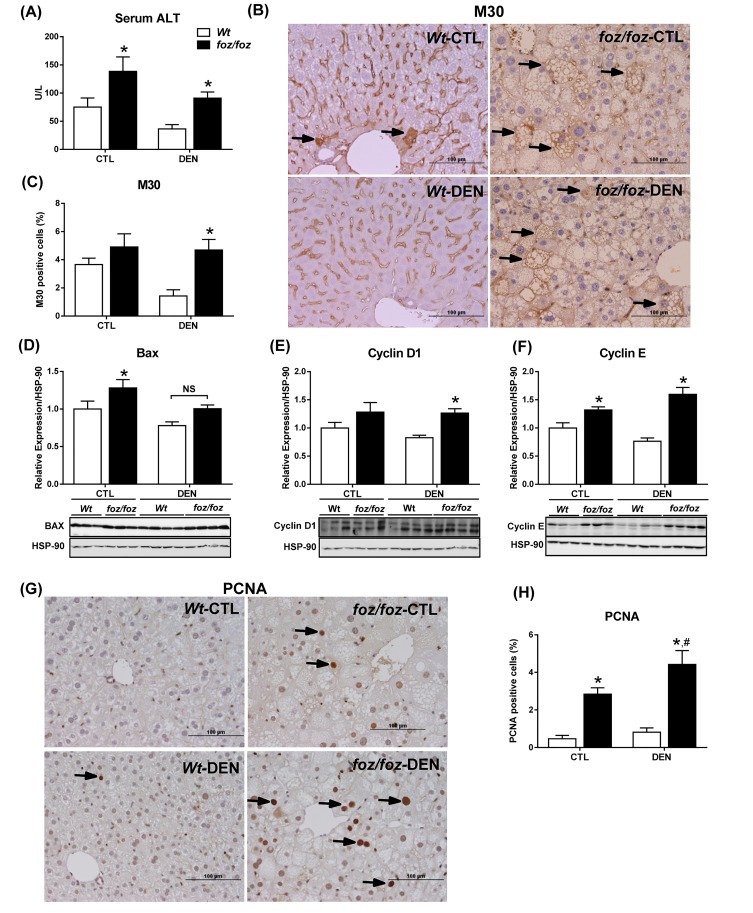
At 3 mths, saline-injected foz/foz mice exhibited a small number of GST-pi-positive hepatocytes. DEN injection significantly increased the number of GST-pi-positive hepatocytes in foz/foz mice, but not in corresponding Wt littermates (3.7 ± 0.6% vs. 1.6 ± 0.2 %, Figure 2C,D). Irrespective of DEN treatment, serum ALT was higher in foz/foz mice than Wt (Figure 3A), as was hepatocyte apoptosis by M30-immunostaining (Figure 3B,C), and pro-apoptotic Bax expression (Figure 3D). Persistently increased hepatocyte injury incites compensatory hepatocellular proliferation so as to maintain organ function. Consistent with this, hepatic expression of cyclin D1 and cyclin E were upregulated in foz/foz compared to Wt at 3 mths (Figure 3E,F), and there were abundant PCNA-positive cells in livers from obese compared to lean mice (Figure 3G,H).
Figure 3. foz/foz mice exhibit increased hepatocyte injury, apoptosis and proliferation compared to Wt mice at 3 mths. (A) Serum alanine amino transferase (ALT) in foz/foz and Wt mice at 3 mths. (B) Cytokeratin-18 fragmentation (M30) immunostaining was used to determine hepatocellular cell death in livers from foz/foz and Wt mice. (C) Quantification (ImageJ) of M30-positive hepatocytes in foz/foz and Wt mice. Hepatic expression of (D) pro-apoptotic Bax, (E) cyclin D1 and (F) cyclin E were determined using immunoblotting. HSP-90 was used as a loading control. (G) PCNA immunostaining of liver sections from foz/foz and Wt mice was used to (H) quantify hepatocytes in cell cycle. Arrows indicate positive staining (x400 magnification). Data are mean ± SEM from 9-11 mice/group. *P < 0.05, vs. treatment-matched, genotype control, #P < 0.05, vs. genotype-matched, treatment control.
3.3. ATM and ATR are induced in livers from foz/foz mice, but p53 and p21 fail to halt proliferation of damaged hepatocytes
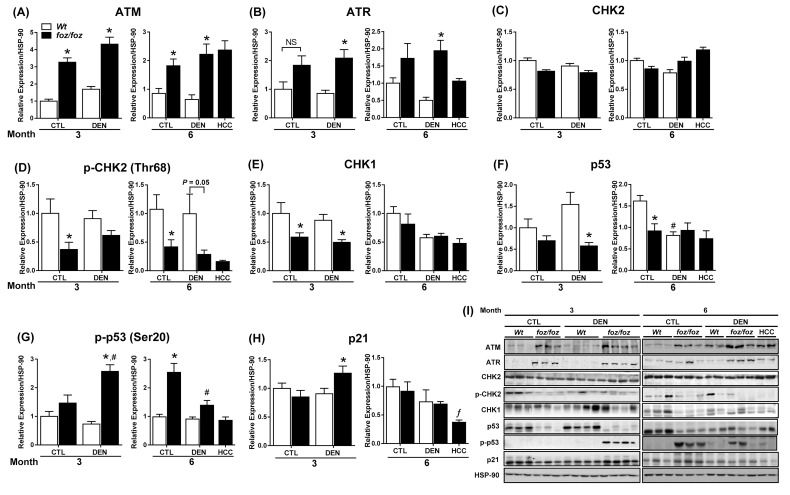
In the presence of DNA damage, cells sense DNA strand breaks via ataxia-telangiectasia mutated (ATM) and ataxia-telangiectasia Rad-3 related (ATR) proteins. In turn, these sensors coordinate cellular responses to DNA lesioning, such as induction of cell cycle checkpoint proteins that inhibit the proliferation of damaged, preneoplastic hepatocytes [24, 25]. Hepatic ATM expression increased markedly in foz/foz mice compared with Wt, regardless of DEN (Figure 4A). ATR was also significantly induced in livers from DEN-injected foz/foz (vs. Wt) at both times (Figure 4B). While total CHK2 did not differ across groups (Figure 4C) at 6 mths, phosphorylated CHK2 was lower in livers from foz/foz mice (and in HCC) than Wt after DEN (Figure 4D). At 3 mths, hepatic CHK1 expression was also lower in obese foz/foz than in lean Wt littermates (irrespective of DEN injection), but values were comparable at 6 mths (Figure 4E).
Figure 4. Differential up-regulation of ATM, ATR, and target proteins that are cell cycle regulators in foz/foz and Wt mice. Hepatic expression of (A) ATM, (B) ATR, (C) CHK2, (D) CHK2 phosphorylation, (E) CHK1, (F) total p53, (G) p53 Ser20 phosphorylation and (H) p21 in foz/foz and Wt mice at 3 and 6 mths were determined by immunoblotting. (I) Representative Western Blots for ATM, ATR, CHK2, p-CHK2, CHK1, p53, p-p53, p21 and HSP-90 (as loading control). Data are mean ± SEM from 10-12 mice/group. *P<0.05, vs. treatment-matched, genotype control, #P<0.05, vs. genotype-matched, treatment control.
p53 is modified post-translationally by phosphorylation at multiple sites, some of which activate p53 function in response to DNA damage [26]. At 3 mths, p53 expression levels were substantially reduced in livers from DEN-injected foz/foz than Wt mice (Figure 4F), but at 6 mths values were similar in the two lines. On the other hand, p53 Ser20 phosphorylation increased in livers from DEN-injected foz/foz vs. Wt animal at 3 mths, consistent with ATM induction (Figure 4G), but by 6 mths there was markedly less p53 phosphorylation in livers from DEN-injected foz/foz mice. As a result, p21, although upregulated at 3 mths in livers from foz/foz mice after DEN injection (vs. Wt littermates), was markedly decreased in HCC vs. dysplastic livers (Figure 4H).
3.4. NF-κB and STAT3 are not activated in livers from obese foz/foz mice
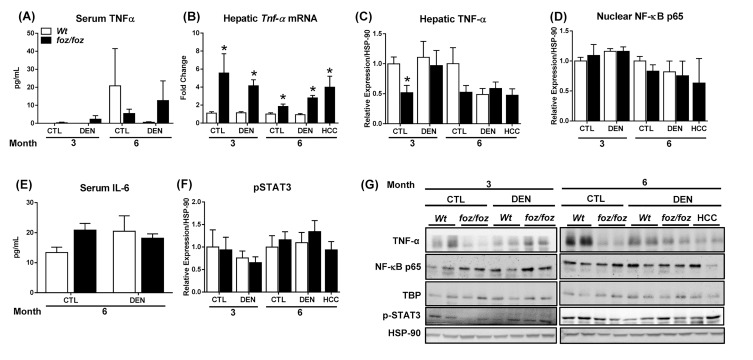
There was no increase in serum TNF-α in obese foz/foz mice; values were highly variable, being detected in < 10% foz/foz and Wt mice, and there was no correlation with HCC (Figure 5A). Within liver tissue, hepatic transcript levels of Tnf- α were persistently upregulated in obesity and HCC (Figure 5B), but this did not translate into increased expression of hepatic TNF-α (Figure 5C,G). Conversely, saline-injected foz/foz mice exhibited lower hepatic TNF-α compared to Wt counterparts at 3 mths. Accordingly, hepatic nuclear NF-κB p65 did not differ between obese foz/foz and lean Wt mice (Figure 5D,G). Levels of serum IL-6 (which is induced by TNF-α) were also comparable across all groups (Figure 5E). IL-6 has been implicated via the activation of Janus kinase (JAK) 2/STAT 3 pathway in hepatocarcinogenesis [4,27]. In the present work, consistent with the failure of serum IL-6 to increase, there was no activation of STAT3 in fatty livers of these obese diabetic mice (Figure 5F,G).
Figure 5. Despite increases in hepatic Tnf- α mRNA in foz/foz vs. Wt mice, serum IL-6, activation of NF-κB and STAT3 phosphorylation do not differ. (A) Serum TNF-α was measured by enzyme-linked immunosorbent assay. (B) TNF-α mRNA was determined by semi-quantitative real time polymerase chain reaction in livers from foz/foz and Wt mice. Hepatic expression of (C) TNF-α (whole lysates) and (D) NF-κB p65 (nuclear extracts) were examined by immunoblotting. (E) Serum IL-6 levels were measured by enzyme-linked immunosorbent assay in foz/foz and Wt at 6 mths. (D) Phospho (p)-STAT3 expression in livers from foz/foz and Wt mice was assessed by immunoblotting. (G) Representative Western Blots for TNF-α, NF-κB p65, p-STAT3, as well as TATA-binding protein (TBP) and heat shock protein (HSP)-90 (as respective loading controls for nuclear and whole liver extracts). Data are mean ± SEM from 7-10 mice/group. *P < 0.05, vs. treatment-matched, genotype control.
3.5. mTORC1 signaling is activated in livers and HCCs from obese mice
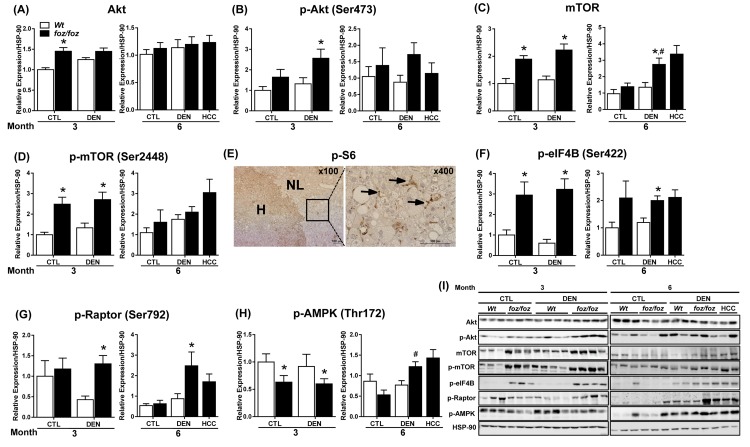
In contrast to the lack of correlation with serum leptin, TNF-α, IL-6, NF-κB and STAT3 activation, hyperinsulinemia (Figure 1D) in the foz/foz model remained a candidate enhancer of hepatocarcinogenesis [8,9]. In the present study, serum IGF-1 was higher, and serum IGF-binding protein (IGF-BP) 3 decreased in obese foz/foz compared to lean Wt, irrespective of DEN (Figure 1L,M). These changes are consistent with increased bioavailability of IGF-1. We therefore examined metabolic pathways known to be affected by hyperinsulinemia/IGF-1. At 3 but not 6 mths, total Akt was induced in livers from saline-injected obese foz/foz compared to lean Wt animals (Figure 6A). Likewise, Akt phosphorylation increased in livers from DEN-treated obese foz/foz mice at 3 but not 6 mths (Figure 6B). Akt activation can activate the master “switch” of growth regulation, mTOR. At 3 mths, mTOR was upregulated (Figure 6C) and mTOR phosphorylation increased in livers of obese foz/foz compared to lean Wt mice, irrespective of DEN. Such mTOR activation was no longer evident at 6 mths (Figure 6D).
Figure 6. Activation of Akt/mTORC1 signaling cascade occurs in livers and HCCs from foz/foz mice. Hepatic expression of (A) total Akt, (B) Akt phosphorylation, (C) total mTOR, (D) mTOR phosphorylation in foz/foz and Wt mice at 3 and 6 mths were examined by immunoblotting. (E) Representative phospho (p)-S6 immunostaining in HCC tissue (H) vs. surrounding non-tumorous liver (NL) from DEN-injected foz/foz mice at 6 mths. p-S6 positive staining localized to non-parenchymal cells and lipid-laden non-malignant hepatocytes (Arrows). Hepatic expression of (F) p-eIF4B, (G) p-raptor and (H) p-AMPK was determined by immunoblotting. (I) Representative Western blots for Akt, p-Akt, mTOR, p-mTOR, p-eIF4B, p-Raptor, p-AMPK and HSP-90 (as loading control). Data are mean ± SEM from 6-11 mice/group. *P < 0.05, vs. treatment-matched, genotype control, #P < 0.05, vs. genotype-matched, treatment control.
To establish whether mTOR activation reflected mTORC1 signaling, we examined known downstream targets [28]. As determined by IHC, we demonstrated an increased phosphorylation of ribosomal S6 (mediated by p70S6 kinase 1) in HCC arising in foz/foz mice relative to surrounding non-tumorous livers (Figure 6E). mTORC1 also regulates eukaryotic initiation factor 4B (eIF4B), an important regulator of protein translation [29]. At 3 mths, livers from foz/foz mice exhibited enhanced eIF4B phosphorylation compared to Wt, irrespective of DEN (Figure 6F). At 6 mths, DEN increased phosphorylation of eIF4B in livers from foz/foz but not Wt. Activation of these mTOR targets is consistent with the observed increase in phosphorylation of signaling intermediate raptor in livers from foz/foz but not Wt mice after DEN (Figure 6G). The AMP-activated protein kinase (AMPK), the main sensor of cellular energy status, inhibits mTORC1 [30,31]. Consistent with mTORC1 activation, AMPK phosphorylation decreased in livers from foz/foz compared to Wt mice (regardless of DEN) at 3 mths (Figure 6H), but by 6 mths AMPK was actually enhanced.
3.6. Rapamycin fails to inhibit growth and transformation of dysplastic hepatocytes in obese mice
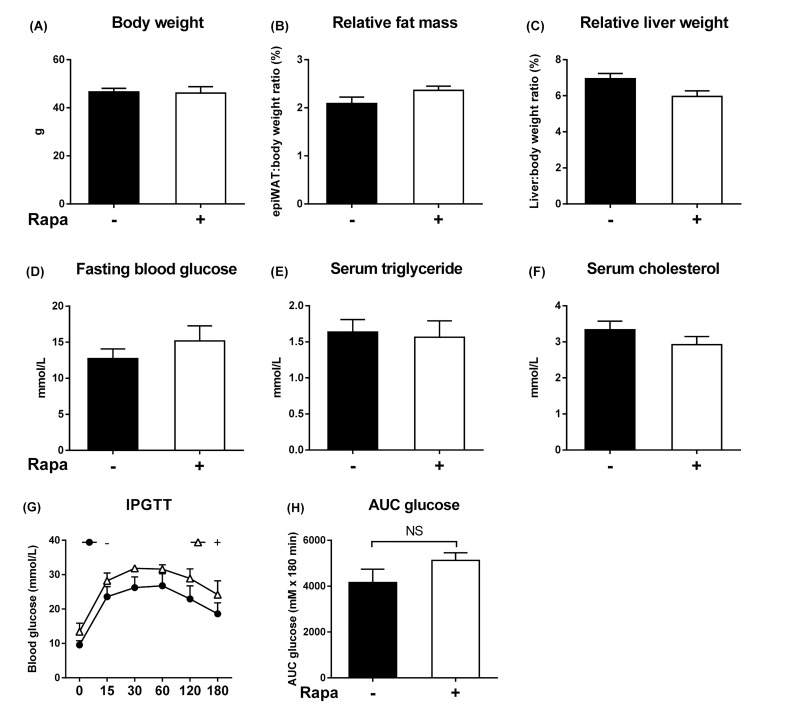
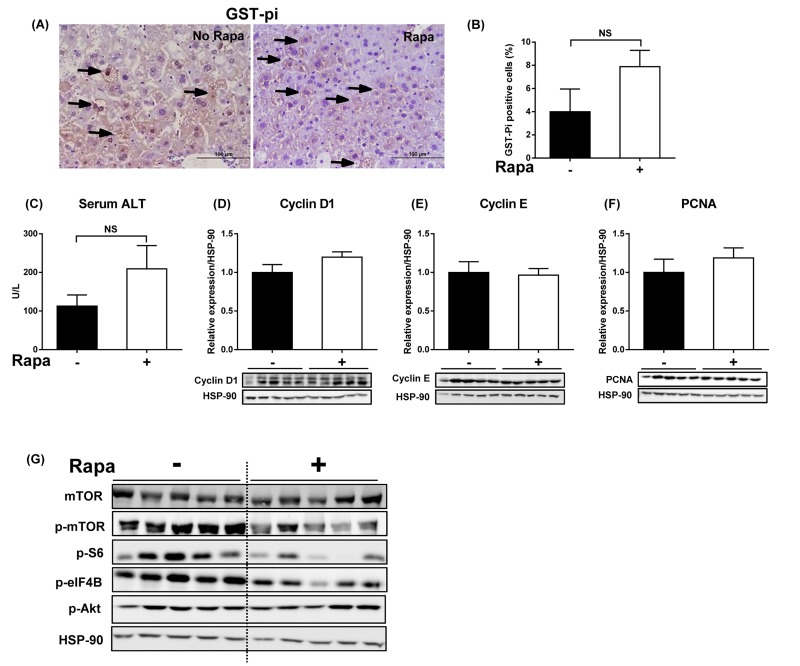
If mTORC1 is a critical node for progression to HCC, inhibition of mTOR signaling should delay hepatocarcinogenesis. Chronic rapamycin intake failed to alter body and tissue weights in foz/foz mice, and there was no change in hepatomegaly (Figure 7A-C). Similarly, the metabolic abnormalities, including glucose tolerance, were neither ameliorated nor exacerbated these changes significantly (Figure 7D-H). Despite the evidence of mTORC1 activation early in hepatocarcinogenesis in foz/foz mice, rapamycin administration failed to reduce the number of dysplastic hepatocytes at 3 mths (Figure 8A,B). In line with a recent study [15], chronic inhibition of mTORC1 signaling by rapamycin tended to increase serum ALT levels compared to untreated foz/foz mice (Figure 8C), but markers of hepatocyte proliferation were not altered (Figure 8D-F). As anticipated, rapamycin supplementation decreased mTOR phosphorylation, caused a slight reduction (NS) of S6 phosphorylation and decrease of eIF4B phosphorylation, but there was no change in Akt phosphorylation(Figure 8G).
Figure 7. Lack of effect of rapamycin on body weight, adiposity, hepatomegaly, dyslipidemia, and glucose metabolism in foz/foz mice. Rapamycin feeding (4 mg/kg body weight/day) did not affect (A) body weight, (B) adiposity, (C) hepatomegaly, (D) fasting blood glucose levels, serum (E) triglyceride, and (F) cholesterol in foz/foz mice at 3 mths. (G-H) The apparent slight impairment of glucose tolerance after rapamycin exposure was not significant. Data are mean ± SEM (n = 9-10/group).
Figure 8. Rapamycin administration in foz/foz mice suppresses activation of hepatic mTORC1-eIF4B, but fails to inhibit growth of dysplastic hepatocytes. DEN-injected foz/foz mice were fed with or without rapamycin (4 mg/kg body weight/day) until 3 mths of age. (A) Representative images of GST-pi-stained liver sections and (B) GST-pi quantification demonstrated a trend towards increased numbers of GST-pi positive cells after rapamycin administration in foz/foz mice. (C) Serum ALT levels appeared higher (NS) in rapamycin-fed mice, while (D) cyclin D1, (E) cyclin E, and (F) PCNA remained unaltered. Data are mean ± SEM from 9-10 mice/group. (G) Effects of rapamycin administration on Akt/mTORC1 signaling proteins were analyzed by immunoblotting.
4. Discussion
In the present study, we demonstrated that obese, diabetic foz/foz mice exhibit early onset (6 mths) DEN-induced HCC, whereas lean Wt mice do not develop HCC until 9 mths, a time course consistent with previous studies [18,32]. The earlier onset and more aggressive nature of DEN-induced HCC with obesity and diabetes were supported by the high rate of pulmonary metastases at 9 mths, 60% in obese vs. 10% in lean Wt mice. Others have used genetic (leptin or leptin receptor defective) and dietary models to show that obesity enhances DEN-induced hepatocarcinogenesis [4,33,34]. In foz/foz mice, such accelerated onset of HCC is associated with hyperinsulinemia, diabetes, hyperleptinemia, hypoadiponectinemia and fatty liver, all relevant to the metabolic complications of human obesity.
In the present studies, enhanced growth of dysplastic hepatocytes preceded development of HCC in obese foz/foz mice. Similar precancerous lesions are present in cirrhosis and/or chronically injured liver [35], and indicate the first change in the multistep process of hepatocarcinogenesis both in humans [17,36,37], and in DEN-injected mice [18,38-40]. In foz/foz mice, obesity appears to promote dysplastic change even in the absence of carcinogen, and with DEN, the number of dysplastic cells greatly exceeded that of lean mice. Enhanced growth of dysplastic hepatocytes in foz/foz mice was associated with more severe liver injury (serum ALT) and apoptosis, as well as increased proliferative activity, indicated by cyclin D1, E, and PCNA expression. Compensatory hepatocellular proliferation, an expected response to persistent hepatocyte cell death, contributes mechanistically to hepatocarcinogenesis animal models [41,42], and is also present in hepatitis C-cirrhosis before onset of human HCC [43].
Another striking and novel finding here is that DNA damage sensors (ATM and ATR) are upregulated in livers from obese compared to lean mice, even without DEN administration. However, such up-regulation failed to activate CHK1 or CHK2. CHK2 regulates stabilization and transcriptional activation of p53. Lack of CHK2 could at least partly explain our observation of low p53 expression in livers of obese mice. Consistent with defective transcriptional activation by p53 [44], p21, a critical cell cycle inhibitor, was upregulated during the early stage of hepatocarcinogenesis, but decreased in HCC compared to non-tumorous liver. These findings are consistent with the proposal that defective cell cycle checkpoint control exerted by p53 may be lost in obesity, and such loss could be pivotal to enhanced hepatocarcinogenesis.
A strength of the present work is the opportunity to examine the pre-malignant phase of hepatocarcinogenesis, allowing us to demonstrate alterations of molecular signaling that characterize the early development of obesity-associated HCC. At this stage, we found little evidence to support a key role of inflammation in obesity-related hepatocarcinogenesis. IL-6 was not changed, STAT3 was not activated, and hepatic TNF-α signaling was unlikely involved as NF-κB was also not activated. Instead, Akt and nutrient-sensing mTORC1 were activated early in fatty livers from obese and diabetic mice, attributable to hyperinsulinemia and increased circulating and free IGF-1. mTORC1 activates S6 and eIF4B, key regulators of cell growth that could promote growth of altered hepatocytes. The impaired activation of AMPK in livers from obese mice could further contribute to chronic activation of mTORC1 signaling by withdrawal of AMPK-mediated suppression. However, despite the capacity for persistent mTORC1 activation to facilitate growth and survival of altered cells, inhibition of mTORC1 with rapamycin over 3 mths failed to prevent growth of dysplastic hepatocytes. During the conduct of these experiments, Umemura et al. reported a similar finding [15]. Among potential explanations, increased liver injury in mice treated with rapamycin was also found in the present work.
In summary, the present studies using a mouse model that recapitulates all the metabolic complications of human obesity confirm that “metabolic obesity” enhances DEN-induced hepatocarcinogenesis. Onset of HCC was preceded by hepatocellular injury, resulting in apoptosis and compensatory hepatocellular proliferation, with increased survival and growth of dysplastic hepatocytes. It is evident, however, that mTORC1 is unlikely to be the critical pathway by which obesity and diabetes enhance development of HCC. The potential mechanism linking obesity to accelerated HCC is inadequate cell cycle checkpoint control by CHK2 and CHK1 in response to the increased DNA damage that occurs in fatty liver of obese/diabetic mice. This could affect the ability of p53 to inhibit proliferation of damaged and altered hepatocytes during the progression of dysplastic hepatocytes to HCC in obese mice. Tumor suppressor p53, and specifically lack of its appropriate function, is an “old player” in development of liver cancer, but it may still be a prime player in the link to obesity and metabolic liver disease.
Acknowledgements
This work was supported by Australian National Health and Medical Research Council (NHMRC) project grants #418100 and APP1059488. EA is an Australian Awards Scholar (AAS). CZL was supported by the NHMRC’s Doherty Post-doctoral Training Fellowship (525473). The authors wish to thank Déborah Heydet and Shao-Hua Chen for their assistance with the initial phase of this work, and the animal technicians at The Canberra Hospital for their dedication and humane care of our experimental animals. The authors are grateful to Dr. Phillip Board, John Curtin School of Medical Research, for providing GST-pi antibody.
Footnotes
The authors declare that there are no conflicts of interest present.
Disclosure
The authors have no conflict of interest to disclose.
References
- [1].Larsson SC, Wolk A. Overweight, obesity and risk of liver cancer: A meta-analysis of cohort studies. Br J Cancer. 2007;97:1005–1008. doi: 10.1038/sj.bjc.6603932. [DOI] [PMC free article] [PubMed] [Google Scholar]
- [2].Saunders D, Seidel D, Allison M, Lyratzopoulos G. Systematic review: The association between obesity and hepatocellular carcinoma-epidemiological evidence. Aliment Pharmacol Ther. 2010;31:1051–1063. doi: 10.1111/j.1365-2036.2010.04271.x. [DOI] [PubMed] [Google Scholar]
- [3].Tanaka K, Tsuji I, Tamakoshi A, Matsuo K, Ito H, Wakai K, Nagata C, Mizoue T, Sasazuki S, Inoue M, Tsugane S. Obesity and liver cancer risk: An evaluation based on a systematic review of epidemiologic evidence among the japanese population. Jpn J Clin Oncol. 2012 doi: 10.1093/jjco/hyr198. [DOI] [PubMed] [Google Scholar]
- [4].Park EJ, Lee JH, Yu GY, He G, Ali SR, Holzer RG, Osterreicher CH, Takahashi H, Karin M. Dietary and genetic obesity promote liver inflammation and tumorigenesis by enhancing il-6 and tnf expression. Cell. 2010;140:197–208. doi: 10.1016/j.cell.2009.12.052. [DOI] [PMC free article] [PubMed] [Google Scholar]
- [5].Griffin TM, Huebner JL, Kraus VB, Guilak F. Extreme obesity due to impaired leptin signaling in mice does not cause knee osteoarthritis. Arthritis Rheum. 2009;60:2935–2944. doi: 10.1002/art.24854. [DOI] [PMC free article] [PubMed] [Google Scholar]
- [6].Fantuzzi G, Faggioni R. Leptin in the regulation of immunity, inflammation, and hematopoiesis. J Leukoc Biol. 2000;68:437–446. [PubMed] [Google Scholar]
- [7].Gruber S, Straub BK, Ackermann PJ, Wunderlich CM, Mauer J, Seeger JM, Buning H, Heukamp L, Kashkar H, Schirmacher P, Bruning JC, Wunderlich FT. Obesity promotes liver carcinogenesis via mcl-1 stabilization independent of il-6ralpha signaling. Cell Rep. 2013;4:669–680. doi: 10.1016/j.celrep.2013.07.023. [DOI] [PubMed] [Google Scholar]
- [8].Chettouh H, Lequoy M, Fartoux L, Vigouroux C, Desbois-Mouthon C. Hyperinsulinemia and insulin signalling in the pathogenesis and the clinical course of hepatocellular carcinoma. Liver Int. 2015 doi: 10.1111/liv.12903. [DOI] [PubMed] [Google Scholar]
- [9].Khandekar MJ, Cohen P, Spiegelman BM. Molecular mechanisms of cancer development in obesity. Nat Rev Cancer. 2011;11:886–895. doi: 10.1038/nrc3174. [DOI] [PubMed] [Google Scholar]
- [10].Bhat M, Sonenberg N, Gores GJ. The mtor pathway in hepatic malignancies. Hepatology. 2013;58:810–818. doi: 10.1002/hep.26323. [DOI] [PMC free article] [PubMed] [Google Scholar]
- [11].Laplante M, Sabatini DM. Mtor signaling in growth control and disease. Cell. 2012;149:274–293. doi: 10.1016/j.cell.2012.03.017. [DOI] [PMC free article] [PubMed] [Google Scholar]
- [12].Villanueva A, Chiang DY, Newell P, Peix J, Thung S, Alsinet C, Tovar V, Roayaie S, Minguez B, Sole M, Battiston C, Van Laarhoven S, Fiel MI, Di Feo A, Hoshida Y, Yea S, Toffanin S, Ramos A, Martignetti JA, Mazzaferro V, Bruix J, Waxman S, Schwartz M, Meyerson M, Friedman SL, Llovet JM. Pivotal role of mtor signaling in hepatocellular carcinoma. Gastroenterology. 2008;135:1972–1983. doi: 10.1053/j.gastro.2008.08.008. 1983 e1971-1911. [DOI] [PMC free article] [PubMed] [Google Scholar]
- [13].Zucman-Rossi J. Molecular classification of hepatocellular carcinoma. Dig Liver Dis. 2010;42(Suppl 3):S235–241. doi: 10.1016/S1590-8658(10)60511-7. [DOI] [PubMed] [Google Scholar]
- [14].Menon S, Yecies JL, Zhang HH, Howell JJ, Nicholatos J, Harputlugil E, Bronson RT, Kwiatkowski DJ, Manning BD. Chronic activation of mtor complex 1 is sufficient to cause hepatocellular carcinoma in mice. Sci Signal. 2012;5:ra24. doi: 10.1126/scisignal.2002739. [DOI] [PMC free article] [PubMed] [Google Scholar]
- [15].Umemura A, Park EJ, Taniguchi K, Lee JH, Shalapour S, Valasek MA, Aghajan M, Nakagawa H, Seki E, Hall MN, Karin M. Liver damage, inflammation, and enhanced tumorigenesis after persistent mtorc1 inhibition. Cell Metab. 2014;20:133–144. doi: 10.1016/j.cmet.2014.05.001. [DOI] [PMC free article] [PubMed] [Google Scholar]
- [16].Barash H, Barash H, E RG, Edrei Y, Ella E, Israel A, Cohen I, Corchia N, Ben-Moshe T, Pappo O, Pikarsky E, Goldenberg D, Shiloh Y, Galun E, Abramovitch R. Accelerated carcinogenesis following liver regeneration is associated with chronic inflammation-induced double-strand DNA breaks. Proc Natl Acad Sci U S A. 2010;107:2207–2212. doi: 10.1073/pnas.0908867107. [DOI] [PMC free article] [PubMed] [Google Scholar]
- [17].Farazi PA, DePinho RA. Hepatocellular carcinoma pathogenesis: From genes to environment. Nat Rev Cancer. 2006;6:674–687. doi: 10.1038/nrc1934. [DOI] [PubMed] [Google Scholar]
- [18].Pok S, Wen V, Shackel N, Alsop A, Pyakurel P, Fahrer A, Farrell GC, Teoh NC. Cyclin e facilitates dysplastic hepatocytes to bypass g1/s checkpoint in hepatocarcinogenesis. J Gastroenterol Hepatol. 2013;28:1545–1554. doi: 10.1111/jgh.12216. [DOI] [PubMed] [Google Scholar]
- [19].Arsov T, Larter CZ, Nolan CJ, Petrovsky N, Goodnow CC, Teoh NC, Yeh MM, Farrell GC. Adaptive failure to high-fat diet characterizes steatohepatitis in alms1 mutant mice. Biochem Biophys Res Commun. 2006;342:1152–1159. doi: 10.1016/j.bbrc.2006.02.032. [DOI] [PubMed] [Google Scholar]
- [20].Heydet D, Chen LX, Larter CZ, Inglis C, Silverman MA, Farrell GC, Leroux MR. A truncating mutation of alms1 reduces the number of hypothalamic neuronal cilia in obese mice. Dev Neurobiol. 2013;73:1–13. doi: 10.1002/dneu.22031. [DOI] [PubMed] [Google Scholar]
- [21].Van Rooyen DM, Larter CZ, Haigh WG, Yeh MM, Ioannou G, Kuver R, Lee SP, Teoh NC, Farrell GC. Hepatic free cholesterol accumulates in obese, diabetic mice and causes nonalcoholic steatohepatitis. Gastroenterology. 2011;141:1393–1403. doi: 10.1053/j.gastro.2011.06.040. 1403 e1391-1395. [DOI] [PMC free article] [PubMed] [Google Scholar]
- [22].Larter CZ, Yeh MM, Van Rooyen DM, Teoh NC, Brooling J, Hou JY, Williams J, Clyne M, Nolan CJ, Farrell GC. Roles of adipose restriction and metabolic factors in progression of steatosis to steatohepatitis in obese, diabetic mice. J Gastroenterol Hepatol. 2009;24:1658–1668. doi: 10.1111/j.1440-1746.2009.05996.x. [DOI] [PubMed] [Google Scholar]
- [23].Salomao M, Yu WM, Brown RS, Jr, Emond JC, Lefkowitch JH. Steatohepatitic hepatocellular carcinoma (sh-hcc): A distinctive histological variant of hcc in hepatitis c virus-related cirrhosis with associated nafld/nash. Am J Surg Pathol. 2010;34:1630–1636. doi: 10.1097/PAS.0b013e3181f31caa. [DOI] [PubMed] [Google Scholar]
- [24].Ditch S, Paull TT. The atm protein kinase and cellular redox signaling: Beyond the DNA damage response. Trends Biochem Sci. 2012;37:15–22. doi: 10.1016/j.tibs.2011.10.002. [DOI] [PMC free article] [PubMed] [Google Scholar]
- [25].Bartek J, Lukas J. Chk1 and chk2 kinases in checkpoint control and cancer. Cancer Cell. 2003;3:421–429. doi: 10.1016/s1535-6108(03)00110-7. [DOI] [PubMed] [Google Scholar]
- [26].Jabbur JR, Huang P, Zhang W. DNA damage-induced phosphorylation of p53 at serine 20 correlates with p21 and mdm-2 induction in vivo. Oncogene. 2000;19:6203–6208. doi: 10.1038/sj.onc.1204017. [DOI] [PubMed] [Google Scholar]
- [27].He G, Karin M. Nf-kappab and stat3 - key players in liver inflammation and cancer. Cell Res. 2011;21:159–168. doi: 10.1038/cr.2010.183. [DOI] [PMC free article] [PubMed] [Google Scholar]
- [28].Bahrami BF, Ataie-Kachoie P, Pourgholami MH, Morris DL. P70 ribosomal protein s6 kinase (rps6kb1): An update. J Clin Pathol. 2014;67:1019–1025. doi: 10.1136/jclinpath-2014-202560. [DOI] [PubMed] [Google Scholar]
- [29].Shahbazian D, Parsyan A, Petroulakis E, Hershey J, Sonenberg N. Eif4b controls survival and proliferation and is regulated by proto-oncogenic signaling pathways. Cell Cycle. 2010;9:4106–4109. doi: 10.4161/cc.9.20.13630. [DOI] [PMC free article] [PubMed] [Google Scholar]
- [30].Inoki K, Zhu T, Guan KL. Tsc2 mediates cellular energy response to control cell growth and survival. Cell. 2003;115:577–590. doi: 10.1016/s0092-8674(03)00929-2. [DOI] [PubMed] [Google Scholar]
- [31].Gwinn DM, Shackelford DB, Egan DF, Mihaylova MM, Mery A, Vasquez DS, Turk BE, Shaw RJ. Ampk phosphorylation of raptor mediates a metabolic checkpoint. Mol Cell. 2008;30:214–226. doi: 10.1016/j.molcel.2008.03.003. [DOI] [PMC free article] [PubMed] [Google Scholar]
- [32].Teoh NC, Dan YY, Swisshelm K, Lehman S, Wright JH, Haque J, Gu Y, Fausto N. Defective DNA strand break repair causes chromosomal instability and accelerates liver carcinogenesis in mice. Hepatology. 2008;47:2078–2088. doi: 10.1002/hep.22194. [DOI] [PubMed] [Google Scholar]
- [33].Hill-Baskin AE, Markiewski MM, Buchner DA, Shao H, De-Santis D, Hsiao G, Subramaniam S, Berger NA, Croniger C, Lambris JD, Nadeau JH. Diet-induced hepatocellular carcinoma in genetically predisposed mice. Hum Mol Genet. 2009;18:2975–2988. doi: 10.1093/hmg/ddp236. [DOI] [PMC free article] [PubMed] [Google Scholar]
- [34].Dowman JK, Hopkins LJ, Reynolds GM, Nikolaou N, Armstrong MJ, Shaw JC, Houlihan DD, Lalor PF, Tomlinson JW, Hubscher SG, Newsome PN. Development of hepatocellular carcinoma in a murine model of nonalcoholic steatohepatitis induced by use of a high-fat/fructose diet and sedentary lifestyle. Am J Pathol. 2014;184:1550–1561. doi: 10.1016/j.ajpath.2014.01.034. [DOI] [PMC free article] [PubMed] [Google Scholar]
- [35].Plentz RR, Park YN, Lechel A, Kim H, Nellessen F, Langkopf BH, Wilkens L, Destro A, Fiamengo B, Manns MP, Roncalli M, Rudolph KL. Telomere shortening and inactivation of cell cycle checkpoints characterize human hepatocarcinogenesis. Hepatology. 2007;45:968–976. doi: 10.1002/hep.21552. [DOI] [PubMed] [Google Scholar]
- [36].Hytiroglou P, Park YN, Krinsky G, Theise ND. Hepatic precancerous lesions and small hepatocellular carcinoma. Gastroenterol Clin North Am. 2007;36:867–887. doi: 10.1016/j.gtc.2007.08.010. vii. [DOI] [PubMed] [Google Scholar]
- [37].Kim H, Park YN. Role of biopsy sampling for diagnosis of early and progressed hepatocellular carcinoma. Best Pract Res Clin Gastroenterol. 2014;28:813–829. doi: 10.1016/j.bpg.2014.08.012. [DOI] [PubMed] [Google Scholar]
- [38].Bakiri L, Wagner EF. Mouse models for liver cancer. Mol Oncol. 2013;7:206–223. doi: 10.1016/j.molonc.2013.01.005. [DOI] [PMC free article] [PubMed] [Google Scholar]
- [39].Bannasch P, Moore MA, Klimek F, Zerban H. Biological markers of preneoplastic foci and neoplastic nodules in rodent liver. Toxicologic Pathology. 1982;10:19–34. doi: 10.1177/019262338201000206. [DOI] [PubMed] [Google Scholar]
- [40].Wang Y, Ausman LM, Greenberg AS, Russell RM, Wang XD. Nonalcoholic steatohepatitis induced by a high-fat diet promotes diethylnitrosamine-initiated early hepatocarcinogenesis in rats. Int J Cancer. 2009;124:540–546. doi: 10.1002/ijc.23995. [DOI] [PMC free article] [PubMed] [Google Scholar]
- [41].Vucur M, Reisinger F, Gautheron J, Janssen J, Roderburg C, Cardenas DV, Kreggenwinkel K, Koppe C, Hammerich L, Hakem R, Unger K, Weber A, Gassler N, Luedde M, Frey N, Neumann UP, Tacke F, Trautwein C, Heikenwalder M, Luedde T. Rip3 inhibits inflammatory hepatocarcinogenesis but promotes cholestasis by controlling caspase-8- and jnk-dependent compensatory cell proliferation. Cell Rep. 2013;4:776–790. doi: 10.1016/j.celrep.2013.07.035. [DOI] [PubMed] [Google Scholar]
- [42].Maeda S, Kamata H, Luo JL, Leffert H, Karin M. Ikkbeta couples hepatocyte death to cytokine-driven compensatory proliferation that promotes chemical hepatocarcinogenesis. Cell. 2005;121:977–990. doi: 10.1016/j.cell.2005.04.014. [DOI] [PubMed] [Google Scholar]
- [43].Dutta U, Kench J, Byth K, Khan MH, Lin R, Liddle C, Farrell GC. Hepatocellular proliferation and development of hepatocellular carcinoma: A case-control study in chronic hepatitis c. Hum Pathol. 1998;29:1279–1284. doi: 10.1016/s0046-8177(98)90257-x. [DOI] [PubMed] [Google Scholar]
- [44].Takai H, Naka K, Okada Y, Watanabe M, Harada N, Saito S, Anderson CW, Appella E, Nakanishi M, Suzuki H, Nagashima K, Sawa H, Ikeda K, Motoyama N. Chk2-deficient mice exhibit radioresistance and defective p53-mediated transcription. EMBO J. 2002;21:5195–5205. doi: 10.1093/emboj/cdf506. [DOI] [PMC free article] [PubMed] [Google Scholar]


