Abstract
Objective
To investigate and compare occult damages in aquaporin-4 (AQP4)-rich periependymal regions in patients with neuromyelitis optica spectrum disorder (NMOSD) vs healthy controls (HCs) and patients with multiple sclerosis (MS) applying quantitative T1 mapping at 7 Tesla (T) in a cross-sectional study.
Methods
Eleven patients with NMOSD (median Expanded Disability Status Scale [EDSS] score 3.5, disease duration 9.3 years, age 43.7 years, and 11 female) seropositive for anti-AQP4 antibodies, 7 patients with MS (median EDSS score 1.5, disease duration 3.6, age 30.2 years, and 4 female), and 10 HCs underwent 7T MRI. The imaging protocol included T2*-weighted (w) imaging and an MP2RAGE sequence yielding 3D T1w images and quantitative T1 maps. We semiautomatically marked the lesion-free periependymal area around the cerebral aqueduct and the lateral, third, and fourth ventricles to finally measure and compare the T1 relaxation time within these areas.
Results
We did not observe any differences in the T1 relaxation time between patients with NMOSD and HCs (all p > 0.05). Contrarily, the T1 relaxation time was longer in patients with MS vs patients with NMOSD (lateral ventricle p = 0.056, third ventricle p = 0.173, fourth ventricle p = 0.016, and cerebral aqueduct p = 0.048) and vs HCs (third ventricle p = 0.027, fourth ventricle p = 0.013, lateral ventricle p = 0.043, and cerebral aqueduct p = 0.005).
Conclusion
Unlike in MS, we did not observe subtle T1 changes in lesion-free periependymal regions in NMOSD, which supports the hypothesis of a rather focal than diffuse brain pathology in NMOSD.
Neuromyelitis optica spectrum disorder (NMOSD) is a severe and often devastating autoimmune and inflammatory CNS disease frequently associated with autoantibodies targeting aquaporin-4 (AQP4) water channels leading to complement activation and focal lesions within AQP4-rich CNS areas such as the spinal cord, the optic nerves, and periependymal regions.1,2 In more detail, brain AQP4 water channels are predominantly located within astrocyte foot processes in the glial limiting membrane and in the basolateral cell plasma membrane of ependymal cells.3,4
Clinical,5 MRI,6 and optical coherence tomography findings mirror the anatomic distribution of AQP4 water channels within the CNS.7–9 MRI is used to rule out other disorders and to visualize optic neuritis and signs of myelitis.6 On top of that, brain lesion patterns typical for NMOSD have been described including extensive or tumefactive periventricular lesions around the lateral, third, and fourth ventricles and the cerebral aqueduct affecting, e.g., diencephalic structures, the area postrema, the thalamus, the hypothalamus, the corpus callosum, or the periventricular white matter.6 Nevertheless, NMOSD-specific brain MRI abnormalities are only detectable within a small proportion of patients,10 and many patients with NMOSD present with a normal brain MRI,11 which in the past has led to the inclusion of “negative brain MRI at onset” to the 2006 Wingerchuk diagnostic criteria.12
Quantitative MRI allows for the quantification of physical variables such as the T1 relaxation time that is sensitive to free-water protons and structural damage to finally compare those variables between tissue regions or participants. When combining quantitative MR techniques with ultra-high-field MRI at 7 Tesla that benefits from an increased signal-to-noise ratio, even subtle degenerative or inflammatory changes that are not obviously present on standard MR images can be assessed.13,14
On this background, we here prospectively performed quantitative T1 relaxometry at 7T to search for occult brain damage within the AQP4-rich, lesion-free and normal-appearing periependymal white or gray matter of patients with NMOSD. We compared our results with those in healthy controls (HCs) and patients with multiple sclerosis (MS).
Methods
Participants
Eleven patients with NMOSD as defined by the 2015 international consensus diagnostic criteria1 were prospectively recruited from the outpatient clinic of the department of neurology, Charité—Universitätsmedizin Berlin between January 2014 and December 2015. For comparison, 10 age-matched HCs and 7 patients with relapsing-remitting MS (RRMS), which were best comparable regarding age and sex, were selected from the NeuroCure neuroimaging database as controls. AQP4 antibody serostatus was assessed in patients with NMOSD using one of several established assays.15–17 Antibodies against AQP4 were present in all patients with NMOSD. Clinical disability was assessed using the Expanded Disability Status Scale (EDSS) in patients with MS and NMOSD.
Standard protocol approvals, registrations, and patient consents
The Ethics Committee of the Charité–Universitätsmedizin Berlin in conformity with the Declaration of Helsinki approved the study (EA 1/054/09). All participants provided written informed consent.
MRI acquisition
Ultra-high-field MR images were acquired using a 7T Siemens whole-body scanner (Magnetom; Siemens, Erlangen, Germany) and a 24-channel receive head coil (Nova Medical, Wilmington, MA) equipped with a birdcage volume coil for transmission. The imaging protocol included 2-dimensional T2*-weighted fast low angle shot (T2*w FLASH; echo time [TE] = 25.0ms, repetition time [TR] = 1,820 ms; spatial resolution = [0.5 × 0.5 × 2] mm3, supratentorial coverage) and 3-dimensional fluid-attenuated inversion recovery (FLAIR, TE = 90 ms; TR = 16,000 ms; inversion time [TI] = 2,925 ms, spatial resolution = [1.0 × 1.0 × 3.0] mm3).
A 3-dimensional T1-weighted magnetization-prepared rapid gradient-echo sequence with 2 TIs (T1w MP2RAGE, TE = 2.98 ms; TR = 2,300 ms; TI = 900 ms; spatial resolution = (1.0 × 1.0 × 1.0) mm3, whole-brain coverage) was used to generate bias-field corrected T1w images and quantitative T1 maps. Phantom experiments have shown that T1 relaxation times measured using the MP2RAGE approach are closely correlated in a linear fashion with true T1 physical values commonly observed within the brain.18
Image analysis
All images were analyzed and processed using 3D Slicer (Version 4.6.2 on MacOS 10.11.4, The Slicer Community), and fslmaths integrated in the FMRIB Software Library (FSL, version 5.0, FMRIB, Oxford, United Kingdom).
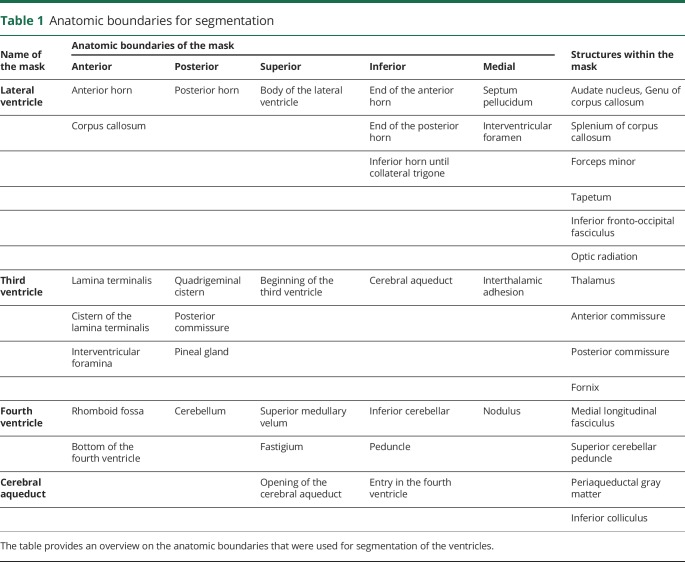
To semiautomatically segment periependymal regions, we defined regions of interest (table 1) and applied a 5-step procedure (figure 1).
Table 1.
Anatomic boundaries for segmentation
Figure 1. Segmentation of the normal-appearing periependymal white matter.
The figure demonstrates the procedure to segment the normal-appearing periependymal white matter. First, the ventricles were segmented (A) and dilated by 1 mm to avoid partial volume effects and 2 mm to include the periependymal white matter (B). Second, the 1-mm dilated ventricle mask was subtracted from the 1 + 2 mm dilated ventricle mask (C). Finally, the periependymal mask was manually edited for smaller errors, and the lesion mask was subtracted (D) to overlay the final mask with T1 maps (E).
First, the lateral, third, and fourth ventricles and the cerebral aqueducts were segmented in consensus reading by a trained and blinded investigator (B.P.) using a semiautomatic threshold-based approach with best visual correction on T1w images. Next, the border of all regions of interest was automatically dilated by 1 mm to avoid partial volume effects of the CSF on the final analysis. Third, the border of all regions of interest was automatically dilated by 2 mm, and the 1-mm dilated mask was then subtracted from the 3-mm dilated mask. This step hence creates a 2-mm-thick small rim around the ventricles, which represents the periependymal white matter. Fourth, T1 hypointense and FLAIR/T2*w hyperintense white matter lesions were manually segmented to subtract the lesion map from previously created region-specific periependymal masks. Finally, periependymal masks of the lateral ventricles were split into white and (cortical and deep) gray matter areas by applying T1-threshold-based approach with best visual correction.
The region-specific, CSF-free, lesion-free, and 2-mm-thick periependymal region masks were then used to calculate the mean T1 relaxation time per region and participant using the Label Statistics Module integrated in 3D Slicer (figure 2).
Figure 2. Exemplary masks of periependymal regions.
The figure demonstrates exemplary masks of segmented periependymal regions around the third ventricle (A), the lateral ventricles (B), the cerebral aqueduct (C), and the fourth ventricle (D).
In addition, the lesion count was assessed on T2*w images. Hereby, all T2*w hyperintense lesions larger than 2 mm were counted.
Statistical analysis
All analyses were performed using IBM SPSS Statistics (version 20, IBM, Somers, NY). Normal distribution was assessed visually and by using a Shapiro-Wilk test. T1 measures around the third ventricle, the fourth ventricle, the cerebral aqueduct, and the lateral ventricle (gray matter) were normally distributed. Thus, the Student t test was used to assess group differences in mean T1 between patients with NMOSD, MS, and HCs. T1 measures around the lateral ventricle were not normally distributed. Thus, Mann-Whitney U test was used to assess group differences in mean T1 (lateral ventricle) between patients with NMOSD, MS, and HCs. Sex differences were assessed using the chi-squared test, and differences in age were assessed using the Student t test. p-Values <0.05 were considered statistically significant. Given the exploratory nature of the study, no adjustments for multiple comparisons were made.
Data availability
This study was supported by a grant from the Guthy-Jackson Charitable Foundation, which supports the idea of data sharing to facilitate research in the field of NMOSD. Hence, deidentified 7T MRI data of patients with NMOSD included in this study will be shared by the corresponding author with qualified scientific collaborators for research projects on request.
Results
Cohort description
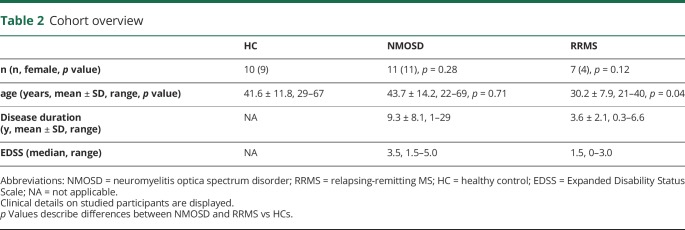
Eleven AQP4 antibody–positive patients with NMOSD and a mean ± SD age of 43.7 ± 7.12 years (range 22–69 years) were included. Ten HCs (mean ± SD age 41.6 ± 11.8 years, range 29–67 years) and 7 patients with RRMS (mean ± SD age 30.2 ± 7.9 years, range 21.4 years) served as controls.
Patients with NMOSD had a total number of 154 (mean ± SD 14 ± 16.5, range 0–55) lesions. A total number of 143 lesions (mean ± SD 20.4 ± 17.4, range 0–53) were detectable in patients with MS. More clinical details including the EDSS score and sex are presented in table 2.
Table 2.
Cohort overview
T1 relaxation time of periependymal regions in healthy controls
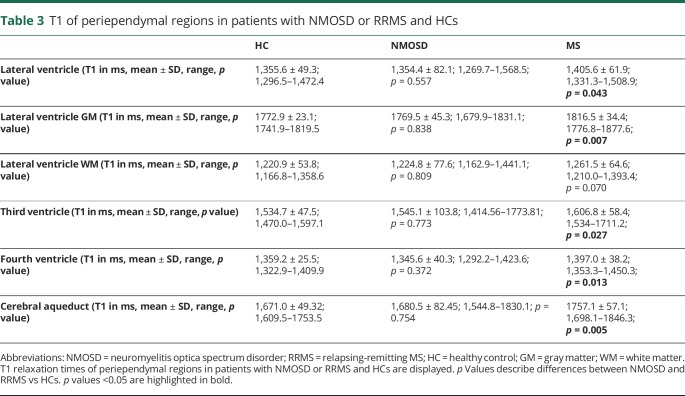
Table 3 gives an overview of all results. The mean T1 relaxation time of periependymal regions around the lateral ventricle in HCs was 1,355.6 ± 49.3 ms (range 1,296.5–1,472.4 ms). Gray matter areas had a mean T1 relaxation time of 1772.9 ± 23.1 ms (range 1741.9–1819.5 ms), whereas white matter areas had a mean T1 relaxation time of 1,220.9 ± 53.8 ms (range 1,166.8–1,358.6 ms).
Table 3.
T1 of periependymal regions in patients with NMOSD or RRMS and HCs
Furthermore, we observed a mean T1 relaxation time of 1,534.7 ± 47.5 ms (range 1,470.0–1,597.1 ms) of periependymal regions around the third ventricle, a mean T1 relaxation time of 1,359.2 ± 25.5 ms (range 1,322.9–1,409.9 ms) of periependymal regions around the fourth ventricle, and a mean T1 relaxation time of 1,671.0 ± 49.3 ms (range 1,609.5–1753.5 ms) of periependymal regions around the cerebral aqueduct.
T1 relaxation time of periependymal regions in patients with NMOSD
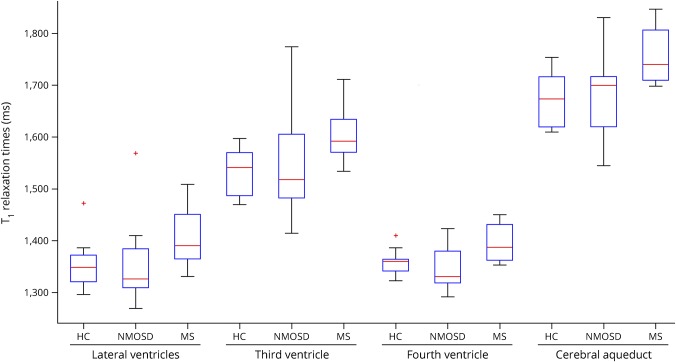
Table 3 and figure 3 give an overview of all results. In comparison to HCs, we observed comparable mean T1 relaxation time of periependymal regions around the lateral (p = 0.557), third (p = 0.773), and fourth ventricles (p = 0.372), as well as around the cerebral aqueduct (p = 0.754).
Figure 3. Box plots.
Box plots of mean T1 values within periependymal regions around the lateral ventricles, the third ventricle, the cerebral aqueduct, and the fourth ventricle are displayed.
T1 relaxation time of periependymal regions in patients with MS
Table 3 and figure 3 give an overview of all results. In comparison to HCs, we observed longer T1 relaxation times of periependymal regions around the lateral (p = 0.043), third (p = 0.027), and fourth ventricles (p = 0.013), as well as around the cerebral aqueduct (p = 0.005).
In comparison to NMOSD, we observed longer T1 relaxation times of periependymal regions around the lateral (p = 0.056), third (p = 0.173), and fourth ventricles (p = 0.016), as well as around the cerebral aqueduct (p = 0.048).
Discussion
In this study, we aimed to explore occult brain damage in normal-appearing periependymal regions that are characterized by a high expression of AQP4 water channels in patients with AQP4 antibody–positive NMOSD by quantitative MRI with a high signal-to-noise ratio at 7 Tesla. We found that T1 relaxation times in normal-appearing periependymal regions did not differ between patients with NMOSD and HCs.
The T1 relaxation time is predominantly influenced by structural changes or damage and free protons found in, e.g., inflammatory edema.19 In other words, both structural damage and edema lead to a prolonged T1 in comparison to healthy brain tissue. By applying quantitative T1 relaxometry at 7 Tesla, one benefits from a substantially increased signal-to-noise ratio and hence increased sensitivity for changes in T1. Thus, T1 relaxation times within the range of those found in HCs argue against the existence of structural damage or edema within the analyzed periependymal regions in patients with AQP4 antibody–positive NMOSD.
Indeed, most previous MRI studies have described no or more focal lesions within the NMOSD brain.6,8,9,20 Although NMOSD-specific lesions are often found in AQP4-rich periependymal regions of diencephalic structures, the area postrema, the thalamus, the hypothalamus, the corpus callosum, or the periventricular white matter,6 there is only little evidence on a more diffuse or occult damage in those regions.21
Several studies have investigated a diffuse or occult damage within the normal-appearing white matter (NAWM) of patients with NMOSD by applying different MRI techniques.
Proton MR spectroscopy (MRS) is a widely applied method used to assess metabolic alterations and the integrity of axonal and neuronal structures. In NMOSD, normal N-acetylaspartic acid (NAA), creatine, and choline levels were reported within the NAWM, arguing against occult axonal or neuronal damage, inflammation, and gliosis.22–24 A recent well-powered MRS study confirmed these findings by reporting normal NAA levels in NMOSD.25
Furthermore, diffusion tensor imaging (DTI)—that is sensitive to structural changes—has been performed in NMOSD. DTI data on the NAWM in NMOSD are inconclusive. On the one hand, no DTI abnormalities were reported within brain regions,26 except for the visual pathway where Wallerian degeneration may occur after optic neuritis.27,28 Contrarily, other research groups have observed fractional anisotropy changes—a marker of the structural integrity—within the NAWM of patients with NMOSD.29,30 Such DTI abnormalities were, however, rather mild and not as severe as in patients with MS.31
Another technique to analyze a more global brain pathology is structural volumetric imaging. Although some groups reported no26 or only mild brain volume changes in NMOSD,32,33 others observed white matter volume loss34 but not cortical gray matter volume loss, which contrast atrophy measures in MS.35
Finally, a 7T MRI study on the periventricular venous density in patients with NMOSD did not report changes in venous visibility on highly resolving T2*w images arguing against a widespread hypometabolism in NMOSD.36
All these studies indicate that occult or diffuse brain damage either is absent or only plays a minor role in the pathophysiology of NMOSD,21–31 which may result in less brain atrophy in comparison to MS.26,32–35 Of note, this assumption is well in line with the clinical presentation of NMOSD.2,5 The latter is often characterized by a relapsing-remitting or monophasic disease course. A (secondary) progressive disease course is rare in NMOSD.2,5
In contrast to NMOSD, we clearly observed prolonged T1 relaxation times in patients with MS, especially within the periependymal thalamus and caudate nuclei. Those results may either reflect diffuse normal-appearing white and gray matter damage in MS as indicated by MRS,25 DTI,31 volumetric37 or quantitative T1 studies,38 or is caused by small lesions within, e.g., the thalamus that are not obviously seen on conventional MRI.39
Our study is not free of limitations. Although all lesion masks and periependymal regions of interest (ROIs) were best visually corrected with high diligence, we cannot exclude minor misclassifications and partial volume effects. Periependymal ROIs were, however, created with a 1-mm “security” distance around the ventricles. Thus, partial volume effects should not have a relevant effect on this work. In addition, the number of analyzed patients with MS was relatively low.
Our findings of normal T1 relaxation times in normal-appearing lesion-free periependymal regions of patients with NMOSD argue against a severe diffuse or occult brain damage even in AQP4-rich brain regions, which is well in line with the literature, the clinical phenotype of NMOSD, and in contrast to MS. Future work needs to ask, what pathophysiologic processes exactly drive lesion formation in AQP4 antibody–positive human NMOSD.40
Glossary
- AQP4
aquaporin-4
- DTI
diffusion tensor imaging
- EDSS
Expanded Disability Status Scale
- FLAIR
fluid-attenuated inversion recovery
- HC
healthy control
- MRS
MR spectroscopy
- NAA
N-acetylaspartic acid
- NAWM
normal-appearing white matter
- NMOSD
neuromyelitis optica spectrum disorder
- RRMS
relapsing-remitting multiple sclerosis
- TE
echo time
- TI
inversion time
- TR
repetition time
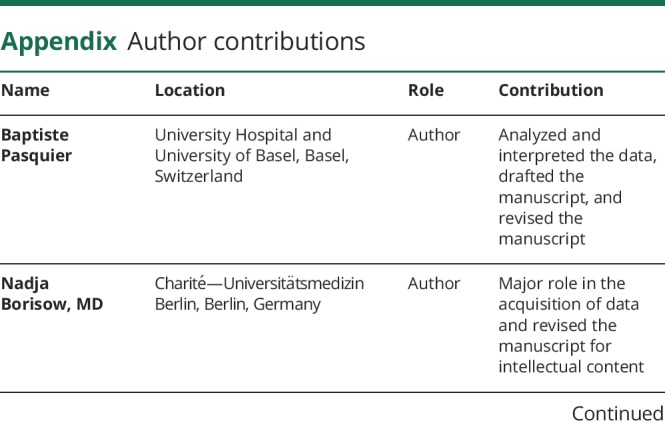
Appendix. Author contributions

Study funding
This study was supported by the Guthy-Jackson Charitable Foundation and Deutsche Forschungsgemeinschaft (DFG Exc 257).
Disclosure
B. Pasquier received travel funding from the ECTRIMS. N. Borisow and L. Rasche report no disclosures. J. Bellmann-Strobl received speaker honoraria and travel funding from Bayer, Sanofi-Aventis/Genzyme, Merck, and Teva. K. Ruprecht served on the scientific advisory boards of Sanofi-Aventis/Genzyme, Novartis, and Roche; received travel funding and/or speaker honoraria from Bayer, Biogen, Merck Serono, Sanofi-Aventis/Genzyme, Teva, Novartis, and Guthy-Jackson Charitable Foundation; served as academic editor of PLoS One; received publishing royalties from Elsevier; received research support from Novartis, Merck Serono, and German Ministry of Education and Research. T. Niendorf received travel funding from Siemens; served as guest editor for MR Materials in Physics, Biology and Medicine; is founder and CEO of MRI Tools; and received research support from Siemens. T.J. Derfuss served on the scientific advisory boards of Biogen, Novartis, Genzyme, Merck, Bayer, Octapharma, GeNeuro, Roche, Actelion, and Celgene; received travel and speaker honoraria from Bayer, Biogen, Merck, Novartis, Genzyme, and Roche; is a member of the editorial board of PLoS ONE; is a member of the steering committee of Mitsubishi Pharma and GeNeuro; is on the speaker bureau of Biogen, Novartis, and Merck; is on the executive board of ECTRIMS; and received research support from Novartis, Biogen, Swiss National Foundation, and Swiss MS Society; his spouse is an employee and holds stock options in Novartis. J. Wuerfel served on the scientific advisory boards of Novartis, Biogen, Genzyme, Teva, and Roche; received travel funding and/or speaker honoraria from Novartis, Bayer, and Biogen; has been employed as CEO at MIAC AG; and received research support from the German Ministry of Education and Research and German Ministry of Economy. F. Paul served on the scientific advisory boards of Novartis and MedImmune; received travel funding and/or speaker honoraria from Bayer, Novartis, Biogen, Teva, Sanofi-Aventis/Genzyme, Merck Serono, Alexion, Chugai, MedImmune, and Shire; is an associate editor of Neurology: Neuroimmunology & Neuroinflammation; is an academic editor of PLoS ONE; consulted for Sanofi Genzyme, Biogen, MedImmune, Shire, and Alexion; received research support from Bayer, Novartis, Biogen, Teva, Sanofi-Aventis/Geynzme, Alexion, and Merck Serono; and received research support from the German Research Council, Werth Stiftung of the City of Cologne, German Ministry of Education and Research, Arthur Arnstein Stiftung Berlin, EU FP7 Framework Program, Arthur Arnstein Foundation Berlin, Guthy-Jackson Charitable Foundation, and NMSS. T. Sinnecker received travel funding and/or speaker honoraria from Actelion, Roche, and Biogen and has been employed by MIAC. Go to Neurology.org/NN for full disclosures.
References
- 1.Wingerchuk DM, Banwell B, Bennett JL, et al. International consensus diagnostic criteria for neuromyelitis optica spectrum disorders. Neurology 2015;85:177–189. [DOI] [PMC free article] [PubMed] [Google Scholar]
- 2.Jarius S, Wildemann B, Paul F. Neuromyelitis optica: clinical features, immunopathogenesis and treatment. Clin Exp Immunol 2014;176:149–164. [DOI] [PMC free article] [PubMed] [Google Scholar]
- 3.Papadopoulos MC, Verkman AS. Aquaporin water channels in the nervous system. Nat Rev Neurosci 2013;14:265–277. [DOI] [PMC free article] [PubMed] [Google Scholar]
- 4.Jarius S, Paul F, Franciotta D, et al. Mechanisms of disease: aquaporin-4 antibodies in neuromyelitis optica. Nat Clin Pract Neurol 2008;4:202–214. [DOI] [PubMed] [Google Scholar]
- 5.Jarius S, Ruprecht K, Wildemann B, et al. Contrasting disease patterns in seropositive and seronegative neuromyelitis optica: a multicentre study of 175 patients. J Neuroinflammation 2012;9:14. [DOI] [PMC free article] [PubMed] [Google Scholar]
- 6.Kim HJ, Paul F, Lana-Peixoto MA, et al. MRI characteristics of neuromyelitis optica spectrum disorder: an international update. Neurology 2015;84:1165–1173. [DOI] [PMC free article] [PubMed] [Google Scholar]
- 7.Oertel FC, Kuchling J, Zimmermann H, et al. Microstructural visual system changes in AQP4-antibody-seropositive NMOSD. Neurol Neuroimmunol Neuroinflamm 2017;4:e334 doi: 10.1212/NXI.0000000000000541. [DOI] [PMC free article] [PubMed] [Google Scholar]
- 8.Popescu BFG, Lennon VA, Parisi JE, et al. Neuromyelitis optica unique area postrema lesions: nausea, vomiting, and pathogenic implications. Neurology 2011;76:1229–1237. [DOI] [PMC free article] [PubMed] [Google Scholar]
- 9.Pittock SJ, Weinshenker BG, Lucchinetti CF, Wingerchuk DM, Corboy JR, Lennon VA. Neuromyelitis optica brain lesions localized at sites of high aquaporin 4 expression. Arch Neurol 2006;63:964–968. [DOI] [PubMed] [Google Scholar]
- 10.Pittock SJ, Lennon VA, Krecke K, Wingerchuk DM, Lucchinetti CF, Weinshenker BG. Brain abnormalities in neuromyelitis optica. Arch Neurol 2006;63:390–396. [DOI] [PubMed] [Google Scholar]
- 11.Trebst C, Jarius S, Berthele A, et al. Update on the diagnosis and treatment of neuromyelitis optica: recommendations of the neuromyelitis optica study group (NEMOS). J Neurol 2014;261:1–16. [DOI] [PMC free article] [PubMed] [Google Scholar]
- 12.Wingerchuk DM, Lennon VA, Pittock SJ, Lucchinetti CF, Weinshenker BG. Revised diagnostic criteria for neuromyelitis optica. Neurology 2006;66:1485–1489. [DOI] [PubMed] [Google Scholar]
- 13.Kuchling J, Brandt AU, Paul F, Scheel M. Diffusion tensor imaging for multilevel assessment of the visual pathway: possibilities for personalized outcome prediction in autoimmune disorders of the central nervous system. EPMA J 2017;8:279–294. [DOI] [PMC free article] [PubMed] [Google Scholar]
- 14.Sinnecker T, Mittelstaedt P, Dörr J, et al. Multiple sclerosis lesions and irreversible brain tissue damage: a comparative ultrahigh-field strength magnetic resonance imaging study. Arch Neurol 2012;69:739–745. [DOI] [PubMed] [Google Scholar]
- 15.Kalluri SR, Illes Z, Srivastava R, et al. Quantification and functional characterization of antibodies to native aquaporin 4 in neuromyelitis optica. Arch Neurol 2010;67:1201–1208. [DOI] [PubMed] [Google Scholar]
- 16.Jarius S, Probst C, Borowski K, et al. Standardized method for the detection of antibodies to aquaporin-4 based on a highly sensitive immunofluorescence assay employing recombinant target antigen. J Neurol Sci 2010;291:52–56. [DOI] [PubMed] [Google Scholar]
- 17.Waters P, Reindl M, Saiz A, et al. Multicentre comparison of a diagnostic assay: aquaporin-4 antibodies in neuromyelitis optica. J Neurol Neurosurg Psychiatry 2016;87:1005–1015. [DOI] [PMC free article] [PubMed] [Google Scholar]
- 18.Marques JP, Kober T, Krueger G, van der Zwaag W, Van de Moortele PF, Gruetter R. MP2RAGE, a self bias-field corrected sequence for improved segmentation and T1-mapping at high field. Neuroimage 2010;49:1271–1281. [DOI] [PubMed] [Google Scholar]
- 19.Sinnecker T, Granziera C, Wuerfel J, Schlaeger R. Future brain and spinal cord volumetric imaging in the clinic for monitoring treatment response in MS. Curr Treat Options Neurol 2018;20:17. [DOI] [PubMed] [Google Scholar]
- 20.Jarius S, Ruprecht K, Kleiter I, et al. MOG-IgG in NMO and related disorders: a multicenter study of 50 patients. Part 2: epidemiology, clinical presentation, radiological and laboratory features, treatment responses, and long-term outcome. J Neuroinflammation 2016;13:280. [DOI] [PMC free article] [PubMed] [Google Scholar]
- 21.Kremer S, Renard F, Achard S, et al. Use of advanced magnetic resonance imaging techniques in neuromyelitis optica spectrum disorder. JAMA Neurol 2015;72:815–822. [DOI] [PMC free article] [PubMed] [Google Scholar]
- 22.Aboul-Enein F, Krssák M, Höftberger R, Prayer D, Kristoferitsch W. Diffuse white matter damage is absent in neuromyelitis optica. AJNR Am J Neuroradiol 2010;31:76–79. [DOI] [PMC free article] [PubMed] [Google Scholar]
- 23.Bichuetti DB, Rivero RL, de Oliveira EM, et al. White matter spectroscopy in neuromyelitis optica: a case control study. J Neurol 2008;255:1895–1899. [DOI] [PubMed] [Google Scholar]
- 24.de Seze J, Blanc F, Kremer S, et al. Magnetic resonance spectroscopy evaluation in patients with neuromyelitis optica. J Neurol Neurosurg Psychiatry 2010;81:409–411. [DOI] [PubMed] [Google Scholar]
- 25.Duan Y, Liu Z, Liu Y, et al. Metabolic changes in normal-appearing white matter in patients with neuromyelitis optica and multiple sclerosis: a comparative magnetic resonance spectroscopy study. Acta Radiol 2017;58:1132–1137. [DOI] [PubMed] [Google Scholar]
- 26.Finke C, Heine J, Pache F, et al. Normal volumes and microstructural integrity of deep gray matter structures in AQP4+ NMOSD. Neurol Neuroimmunol Neuroinflamm 2016;3:e229 doi: 10.1212/NXI.0000000000000541. [DOI] [PMC free article] [PubMed] [Google Scholar]
- 27.Pache F, Zimmermann H, Finke C, et al. Brain parenchymal damage in neuromyelitis optica spectrum disorder—a multimodal MRI study. Eur Radiol 2016;26:4413–4422. [DOI] [PubMed] [Google Scholar]
- 28.Kuchling J, Backner Y, Oertel FC, et al. Comparison of probabilistic tractography and tract-based spatial statistics for assessing optic radiation damage in patients with autoimmune inflammatory disorders of the central nervous system. Neuroimage Clin 2018;19:538–550. [DOI] [PMC free article] [PubMed] [Google Scholar]
- 29.Kimura MCG, Doring TM, Rueda FC, Tukamoto G, Gasparetto EL. In vivo assessment of white matter damage in neuromyelitis optica: a diffusion tensor and diffusion kurtosis MR imaging study. J Neurol Sci 2014;345:172–175. [DOI] [PubMed] [Google Scholar]
- 30.Liu Y, Duan Y, He Y, et al. A tract-based diffusion study of cerebral white matter in neuromyelitis optica reveals widespread pathological alterations. Mult Scler 2012;18:1013–1021. [DOI] [PubMed] [Google Scholar]
- 31.Kim SH, Kwak K, Hyun JW, et al. Diffusion tensor imaging of normal-appearing white matter in patients with neuromyelitis optica spectrum disorder and multiple sclerosis. Eur J Neurol 2017;24:966–973. [DOI] [PubMed] [Google Scholar]
- 32.Liu Y, Wang J, Daams M, et al. Differential patterns of spinal cord and brain atrophy in NMO and MS. Neurology 2015;84:1465–1472. [DOI] [PubMed] [Google Scholar]
- 33.Hyun JW, Park G, Kwak K, et al. Deep gray matter atrophy in neuromyelitis optica spectrum disorder and multiple sclerosis. Eur J Neurol 2017;24:437–445. [DOI] [PubMed] [Google Scholar]
- 34.Blanc F, Noblet V, Jung B, et al. White matter atrophy and cognitive dysfunctions in neuromyelitis optica. PLoS One 2012;7:e33878. [DOI] [PMC free article] [PubMed] [Google Scholar]
- 35.Chanson JB, Lamy J, Rousseau F, et al. White matter volume is decreased in the brain of patients with neuromyelitis optica. Eur J Neurol 2013;20:361–367. [DOI] [PubMed] [Google Scholar]
- 36.Schumacher S, Pache F, Bellmann-Strobl J, et al. Neuromyelitis optica does not impact periventricular venous density versus healthy controls: a 7.0 Tesla MRI clinical study. MAGMA 2016;29:535–541. [DOI] [PubMed] [Google Scholar]
- 37.Solomon AJ, Watts R, Dewey BE, Reich DS. MRI evaluation of thalamic volume differentiates MS from common mimics. Neurol Neuroimmunol Neuroinflamm 2017;4:e387 doi: 10.1212/NXI.0000000000000541. [DOI] [PMC free article] [PubMed] [Google Scholar]
- 38.Vrenken H, Geurts JJG, Knol DL, et al. Whole-brain T1 mapping in multiple sclerosis: global changes of normal-appearing gray and white matter. Radiology 2006;240:811–820. [DOI] [PubMed] [Google Scholar]
- 39.Harrison DM, Oh J, Roy S, et al. Thalamic lesions in multiple sclerosis by 7T MRI: clinical implications and relationship to cortical pathology. Mult Scler 2015;21:1139–1150. [DOI] [PMC free article] [PubMed] [Google Scholar]
- 40.Takeshita Y, Obermeier B, Cotleur AC, et al. Effects of neuromyelitis optica–IgG at the blood–brain barrier in vitro. Neurol Neuroimmunol Neuroinflamm 2016;4:e311 doi: 10.1212/NXI.0000000000000541. [DOI] [PMC free article] [PubMed] [Google Scholar]
Associated Data
This section collects any data citations, data availability statements, or supplementary materials included in this article.
Data Availability Statement
This study was supported by a grant from the Guthy-Jackson Charitable Foundation, which supports the idea of data sharing to facilitate research in the field of NMOSD. Hence, deidentified 7T MRI data of patients with NMOSD included in this study will be shared by the corresponding author with qualified scientific collaborators for research projects on request.


