Abstract
Background
Recurrence following androgen-deprivation therapy is associated with adverse clinical outcomes in prostate cancer, but the cellular origins and molecular mechanisms underlying this process are poorly defined. We previously identified a population of castration-resistant luminal progenitor cells expressing Bmi1 in the normal mouse prostate that can serve as a cancer cell-of-origin. Here, we investigate the potential of Bmi1-expressing tumor cells that survive castration to initiate recurrence in vivo.
Methods
We employed lineage retracing in Bmi1-CreER; R26R-confetti; Ptenf/f transgenic mice to mark and follow the fate of emerging recurrent tumor clones after castration. A tissue recombination strategy was used to rescue transgenic mouse prostates by regeneration as grafts in immunodeficient hosts. We also used a small molecule Bmi1 inhibitor, PTC-209, to directly test the role of Bmi1 in recurrence.
Results
Transgenic prostate tumors (n = 17) regressed upon castration but uniformly recurred within 3 months. Residual regressed tumor lesions exhibited a transient luminal-to-basal phenotypic switch and marked cellular heterogeneity. Additionally, in these lesions, a subpopulation of Bmi1-expressing castration-resistant tumor cells overexpressed the stem cell reprogramming factor Sox2 (mean [SD] = 41.1 [3.8]%, n = 10, P < .001). Bmi1+Sox2+ cells were quiescent (BrdU+Bmi1+Sox2+ at 3.4 [1.5]% vs BrdU+Bmi1+Sox2- at 18.8 [3.4]%, n = 10, P = .009), consistent with a cancer stem cell phenotype. By lineage retracing, we established that recurrence emerges from the Bmi1+ tumor cells in regressed tumors. Furthermore, treatment with the small molecule Bmi1 inhibitor PTC-209 reduced Bmi1+Sox2+ cells (6.1 [1.4]% PTC-209 vs 38.8 [2.3]% vehicle, n = 10, P < .001) and potently suppressed recurrence (retraced clone size = 2.6 [0.5] PTC-209 vs 15.7 [5.9] vehicle, n = 12, P = .04).
Conclusions
These results illustrate the utility of lineage retracing to define the cellular origins of recurrent prostate cancer and identify Bmi1+Sox2+ cells as a source of recurrence that could be targeted therapeutically.
Most advanced prostate cancers are initially dependent on androgen signaling for survival at the time of initial diagnosis (1), making androgen deprivation therapy (ADT) the standard treatment option for these patients (2). However, failure of ADT is common, resulting in tumor recurrence as castration resistant prostate cancer (CRPC) (3,4). An emerging model of resistance to ADT in prostate cancer, particularly to the more potent newer antiandrogen drugs such as enzalutamide and abiraterone, involves lineage plasticity or transdifferentiation (5–8). Epigenetic regulators and stem cell reprogramming factors including Sox2 and Ezh2 appear to play important roles in this process (5,6). However, there has been a paucity of studies that attempt to specifically follow the fate of malignant prostate cells in regressed tumors following castration in order to understand the cellular processes associated with the emergence of CRPC.
In prostate cancer, the polycomb repressor complex 1 protein Bmi1 has been implicated in promoting tumor progression, stemness, and chemoresistance (9–13). We recently identified a population of luminal progenitors termed castration-resistant Bmi1-expressing cells (CARBs) in the mouse prostate that serve as a prostate cancer cell of origin (14). We hypothesized that analogous castration-resistant Bmi1-expressing tumor cells (tumor CARBs) may exist in prostate cancer that could seed recurrence after ADT. We reasoned that use of an inducible Bmi1-CreER driver and lineage retracing with a multicolor reporter allele (R26R-confetti) could make lineage-marking of tumor CARBs in castrated tumors feasible.
Methods
Mouse Strains and Procedures
The following mouse strains were from Jackson Laboratory (Bar Harbor, ME): Bmi1CreER (15), R26R-Confetti (16), and Ptenf/f(17). General procedures for tamoxifen administration and surgical castration have been described previously (14). All mouse studies were approved by the Northwestern University Institutional Animal Care and Use Committee. Additional details are in the Supplementary Methods (available online).
Tissue Recombination and Renal Capsule Grafting
Dissociation of prostate glands and renal capsule grafting were performed as described previously (14), and additional details are in the Supplementary Methods (available online). For the PTC-209 (Selleckchem, Houston, TX) treatment, mice (n = 6 per group) were administrated vehicle (5% DMSO in corn oil) or PTC-209 (60 mg/kg) by intraperitoneal injection daily for 7 or 21 consecutive days.
Histology and Immunofluorescence Staining
Prostates and grafts were processed and stained as described previously (14). Additional details are in the Supplementary Methods (available online).
Human Prostate Cancer Data
Human prostate cancer data for benign prostate tissues (n = 28), localized prostate cancers (n = 59), metastatic CRPCs (n = 35), CRPC-Adeno (n = 25), and CRPC-NE (n = 10) were obtained from previously published datasets (18,19). Gene expression data were downloaded from NCBI Geo (GEO accession no. GSE35988) (18) and cBioPortal (19). Patient groups were classified as high Bmi1/Sox2 and low Bmi1/Sox2 expression by the median of both Bmi1 and Sox2 mRNA expression values of the study population. Patients whose tumors had both Bmi1 and Sox2 expressions above and below the median value were defined as a high Bmi1/Sox2 expression and low Bmi1/Sox2 expression, respectively. Patient survivals were assessed by the Kaplan–Meier method. P values were determined by log-rank test. P values for the frequency of patient samples with high Bmi1/Sox2 expression were determined by χ2 test.
Additional details on experimental methods and materials are in the Supplementary Methods (available online).
Statistical Analysis
Data are shown as mean (SD). Statistical significance was evaluated using a two-tailed Student t test, χ2 test, or Fisher’s exact test. Survival plots were depicted as Kaplan-Meier curves. P < .05 was considered statistically significant.
Results
Evaluation of Recurrence in BC-Pten Transgenic Prostate Tumors
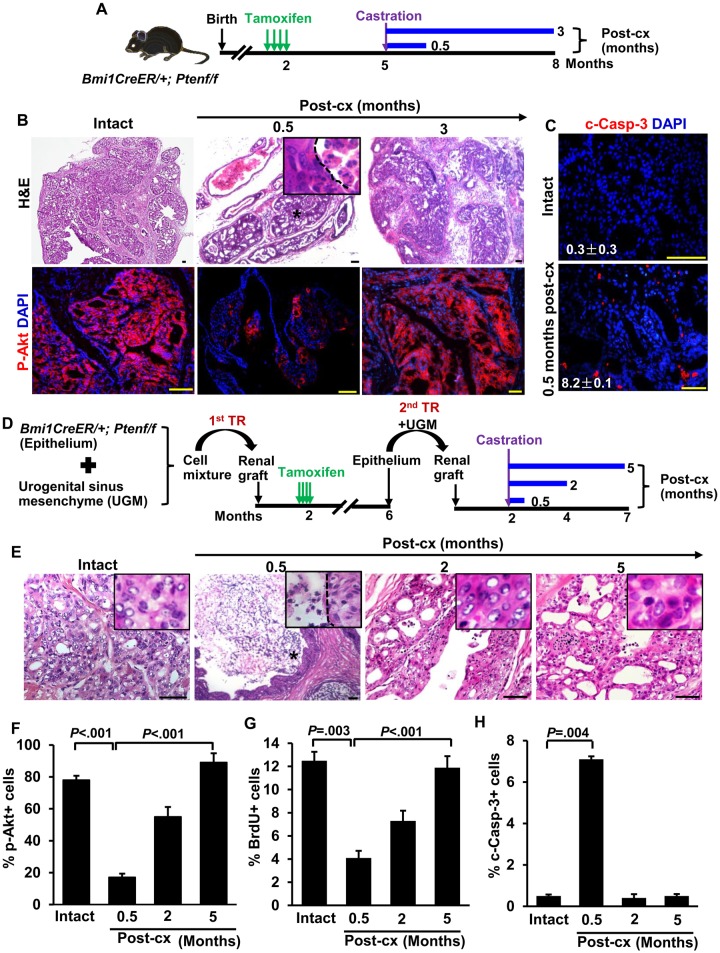
We first sought to determine if prostate tumors contain analogous “tumor CARBs” and their potential role in recurrence. To this end, we first examined the response of tumors in transgenic Bmi1-CreER; Ptenf/f mice (hereafter referred to as BC-Pten mice) to castration. In BC-Pten mice, Pten is specifically deleted in Bmi1-expressing cells by tamoxifen administration. Three months after tamoxifen treatment, mice were castrated and then serially analyzed at various time points for evidence of tumor regression and recurrence (Figure 1A). In intact mice 3 months post-tamoxifen induction, mice exhibited diffuse HGPIN/carcinoma with uniform upregulation of p-Akt, indicating Pten loss (Figure 1B). At 0.5 months after castration, tumors were noticeably shrunken accompanied by a substantial increase in apoptosis (Figure 1, B and C). Nonetheless, these regressed tumors retained foci of p-Akt+ tumor cells. Transgenic prostate tumors (n = 17) regressed upon castration but uniformly recurred within 3 months. By 3 months postcastration, tumors had regrown with strong p-Akt expression indistinguishable from that in pre-castrate mice. These results indicate that althouh BC-Pten tumors respond to castration, they do retain a population of tumor cells that survive castration and drive recurrence.
Figure 1.
Bmi1-CreER; Ptenf/f(BC-Pten) mice as model of castration-resistant prostate cancer. A) Scheme for prostate cancer initiation, castration-induced regression, and recurrence in BC-Pten mice. B) H&E and immunofluorescence (IF) staining for p-Akt before and during castration. C) IF staining of cleaved caspase-3 (c-Casp-3) to assess the percentage of cells undergoing apoptosis in mice before (n = 24 of 7323 total epithelial cells, 3 mice) and 0.5 months after castration (n = 374 of 4573 total epithelial cells, 3 mice). D) Scheme for prostate cancer initiation, castration-induced regression, and recurrence in rescued BC-Pten mice prostate grafts by tissue recombination. E) H&E images of prostate grafts before and during castration, demonstrating that castration-resistant cells remain after castration and repopulated recurrent tumors during long term castration. F) Graph showing percentage of p-Akt+ cells among total epithelial cells in the grafts before and during castration. G and H) Quantification of BrdU (intact, n = 602 of 4818; 0.5 months post-cx, n = 189 of 4632; 2 months post-cx, n = 1994 of 3627; 5 months post-cx, n = 502 of 4224, G) and c-Casp3 (intact, n = 25 of 5032; 0.5 months post-cx, n = 342 of 4818; 2 months post-cx, n = 12 of 3774; 5 months post-cx, n = 23 of 4615. H) Indices in p-Akt positive lesions of the grafts before and during castration. The number of prostate grafts evaluated in each group is as follows: intact = 12; 0.5 months post-cx =8; 2 months post-cx =10; 5 months post-cx =10. Data represent the mean ± SD. Two-sided Student t test. Post-cx: post-castration. H&E: hematoxylin and eosin staining. Scale bar, 50 μm.
As Bmi1 is not exclusively expressed in the prostate epithelium, Pten deletion in non-prostate Bmi1-expressing cells in BC-Pten mice may confound our results, in addition to the increased morbidity in the mice due to tumors arising from other sites. To get around this limitation and to amplify the prostate samples, we used a tissue recombination strategy to rescue transgenic BC-Pten mouse prostates by regeneration as grafts in host mice (Figure 1D). As expected, castration resulted in regression of rescued BC-Pten prostate tumor grafts with a statistically significant increase in apoptotic cell death (14.2-fold, P = .004) and a decrease in proliferation (0.33-fold, P = .003) (Figure 1, E–H). However, at 2 to 5 months postcastration, most grafts contained multifocal HGPIN/carcinoma with a progressive increase in p-Akt positive lesions and proliferation (Figure 1, E–H), which show several distinct molecular and biological features including p16Ink4a protein levels and cellular senescence from primary tumors of intact mice (Supplementary Figure 1, available online). Therefore, in this model, we designated tumors from mice at 0.5 months postcastration as “regressed tumors” and tumors from mice 2 months or later postcastration as “relapsed” or “recurrent.”
Assessment of Cellular Heterogeneity in BC-Pten Tumors
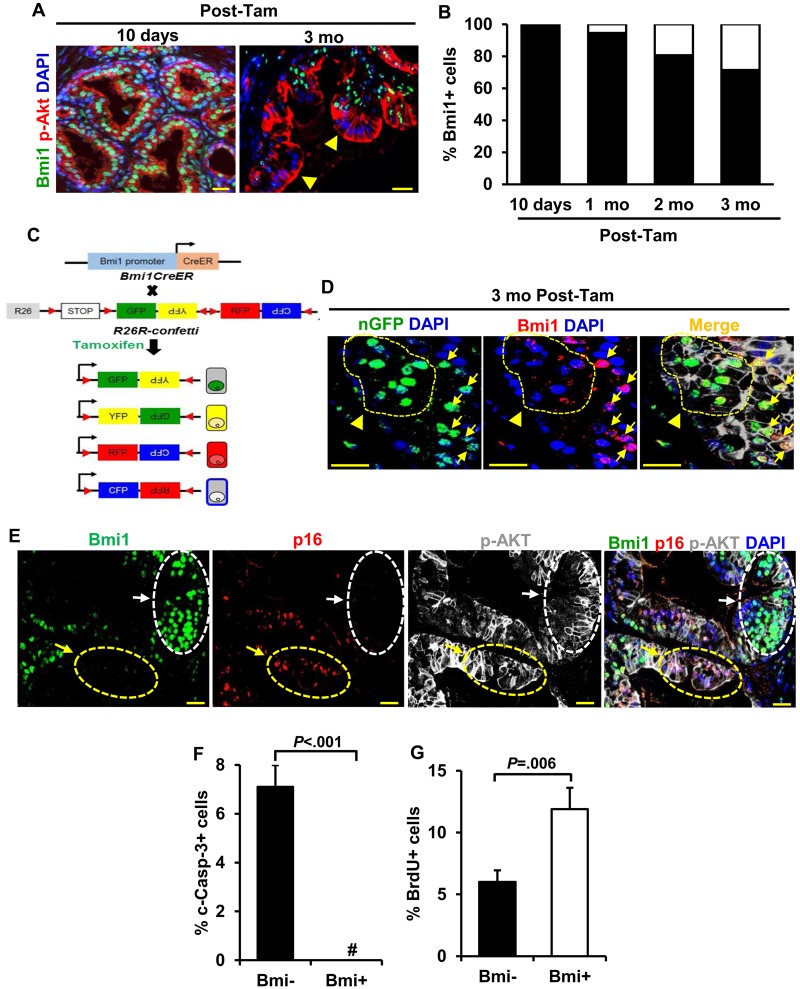
Surprisingly, we noted that established tumors in BC-Pten mice were heterogeneous for Bmi1 expression, although all tumors are expected to have originated from Bmi1+ cells (Figure 2A). This was not a consequence of spurious Pten deletion in Bmi1- cells due to lack of fidelity of the Bmi1CreER driver, as no Bmi1- cells were observed in p-Akt+ lesions 10 days posttamoxifen, while the number of Bmi1-pAkt+ cells progressively increased from 1 to 3 months post-tamoxifen (Figure 2B). Furthermore, analysis of tumors in BC-Pten mice carrying the R26R-confetti allele, in which tamoxifen induction labels isolated Bmi1+ cells randomly with one of four Confetti colors encoded by the R26R-Confetti allele (Figure 2C), revealed the existence of both Bmi1+ and Bmi1- cells within single color Confetti-labeled p-Akt+ tumor clones (Figure 2D). These results indicate that that Bmi1- tumor cells arose from Bmi1+ cells. We next examined the expression of a validated target of Bmi1 repression, p16Ink4a (20,21), and noted a striking mutually exclusive pattern of expression between Bmi1 and p16Ink4a in in BC-Pten prostate tumors (Figure 2E). The heterogeneity in Bmi1 expression extended to the p-Akt+ lesions of regressed tumors (Supplementary Figure 1A, available online), and the Bmi1+ and Bmi1- tumor cells showed functional differences as well. While 7.0% of Bmi1- tumor cells co-stained with cleaved caspase-3, no Bmi1+ tumor cells coexpressing cleaved caspase-3 were observed in the p-Akt+ lesions of the regressed tumors (Figure 2F; Supplementary Figure 2A, available online). By contrast, Bmi1+ tumor cells incorporated higher levels of BrdU than Bmi1- tumor cells in regressed lesions (11.9 [1.7]% in Bmi1+ cells vs 6 [1.0]% in Bmi1- cells, n = 8 grafts, P = .006) (Figure 2G; Supplementary Figure 2B, available online).
Figure 2.
Heterogeneity in Bmi1 expression in BC-Pten tumors. A and B) IF images and quantitation of Bmi1+ and Bmi1- cells (arrowheads) within p-Akt+ lesions show a progressive increase in p-Akt+Bmi1- cells from 10 days through 1, 2, and 3 months (mo) post-tamoxifen treatment (post-tam) in BC-Pten mice (2 or 3 mice per group). C) Schematic of lineage-tracing strategy and color distribution of proteins expressed from the R26R-Confetti locus. Upon induction of Cre recombinase, cells are randomly labelled with one of the four fluorescent proteins (cyan fluorescent protein [CFP], green fluorescent protein [GFP], yellow fluorescent protein [YFP], or red fluorescent protein [RFP]). D) IF staining shows the presence of both Bmi1+ and Bmi1- cells within nuclear GFP+ Confetti clones of p-Akt+ tumor lesions at 3 months posttamoxifen. Arrows and arrowheads indicate nuclear GFP Confetti cells that are positive or negative for Bmi1, respectively. E) IF staining showing that p16 expression was mutually exclusive with Bmi1 expression (arrows) in hormonally intact tumors. White and yellow arrows indicate p16- and p16+ cells that are positive and negative for Bmi1 within p-Akt+ lesions, respectively. F and G) Quantitation of Bmi1+ and Bmi1- cells coexpressing with c-Casp-3 (0.0% vs 7.0%) or BrdU (11.9% vs 6.0%) within p-Akt+ lesions of the regressed tumors (n = 8 prostate grafts). # No Bmi1+c-Casp-3+ cells was observed. Data represent the mean ± SD, two-sided Student t test. Scale bar, 25 μm.
The Impact of Androgen Deprivation on Lineage Plasticity in BC-Pten Tumor Cells
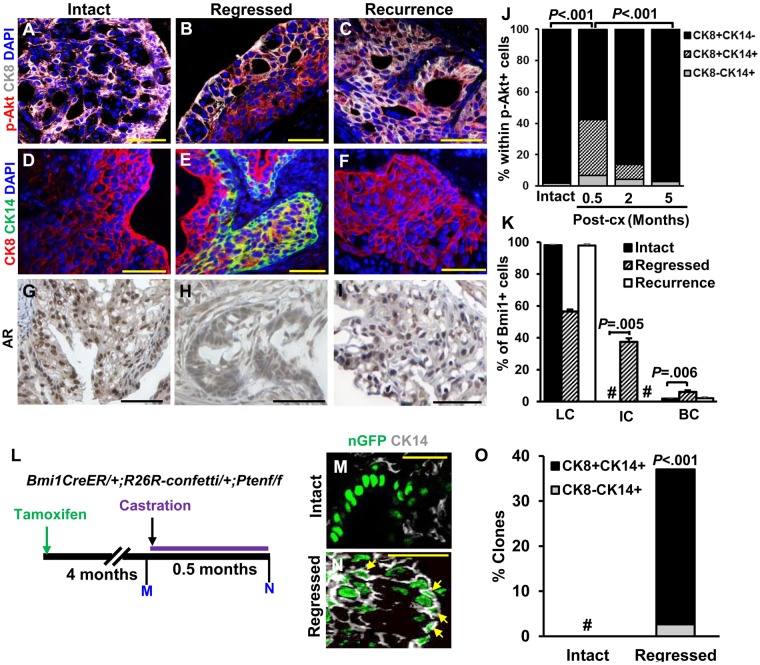
Like most human prostate cancer, all BC-Pten tumors before castration were luminal (CK8+CK14-AR+; Figure 3, A, D and G). Interestingly, we observed an increase in tumor cells expressing basal cell markers CK14+ (Figure 3, B and E) and p63+ (Supplementary Figure 3A, available online) in regressed tumors after castration. Regressed tumors showed a dramatic increase in CK14+CK8+ tumors cells expressing p-Akt+ (35.7%, Figure 3J). However, all lesions reverted to a full luminal phenotype by 5 months postcastration when tumor recurrence is established. Bmi1+ tumor CARBs within p-Akt+ lesions in regressed tumors also expressed basal cell markers. Up to 37.5% of Bmi1+ cells in regressed tumors consisted of CK8+CK14+ intermediate cells, while no Bmi1+ cells coexpressing CK8+ and CK14+ could be identified in tumor lesions from intact mice (Figure 3K). This transient increase in basal marker-expressing tumor cells in castrated BC-Pten mice could be explained by phenotypic plasticity or by a selective enrichment of preexisting basal-like p-Akt+ tumor cells because of loss of luminal tumor cells after castration. To distinguish between these possibilities, we determined the origin of CK14+ cells in the regressed tumors after castration using lineage tracing with the R26R-Confetti allele (Figure 3L). No CK14+ or CK8+CK14+ Confetti-labeled cells (Figure 3, M and O; Supplementary Figure 3, B and C, available online) were observed in tumors from hormonally intact mice, whereas we could easily detect them (36.1% and 34.4%, Figure 3, N and O) in regressed tumors. Similar results were obtained for the basal cell marker, p63 (Supplementary Figure 3, D–F, available online). These results indicate that basal cell marker-expressing cells observed in the regressed tumors are derived from preexisting luminal tumor cells in intact tumors before castration.
Figure 3.
The effect of androgen deprivation on lineage plasticity in BC-Pten mice. A–F) Representative images of CK8+ or CK14+ and p-Akt+ cells in intact (A and D), regressed (B and E), or recurrent tumors (C and F) from tissue recombinant prostate grafts. G–I) Immunohistochemistry staining for AR. Scale bar, 50 μm. J) Cell type distribution in the p-Akt+ lesions of prostate grafts before and after castration (intact = 12; 0.5 months post-cx =8; 2 months post-cx =10; 5 months post-cx =10). K) Graph shows distribution of luminal cells (LC), intermediate cells (IC), and basal cells (BC) within Bmi1+ tumor cells. No Bmi1+ tumor cells that were double positive for CK8 and CK14 were observed. L) Scheme for analysis of lineage distribution in Confetti-labeled tumor clones. Confetti tumor clones were defined by a cluster of over 5 similar-colored cells within p-Akt+ lesions. M and N) Representative images showing nuclear GFP Confetti tumor clones that co-stained for CK14 in intact (M) and regressed tumors (N). Arrows indicate nuclear GFP Confetti cells that are positive for CK14. Scale bar, 25 μm. O) Percentage of the Confetti tumor clones containing CK8-CK14+ or CK8+CK14+ cells in intact (n = 12) and regressed tumors (n = 8) of prostate grafts. # No Confetti tumor cells that are CK14+ or CK14+CK8+ were observed. Data represent the mean ± SD, two-sided Student t test. Post-cx = post-castration.
Assessment of Sox2 in Regressed Tumors following Castration
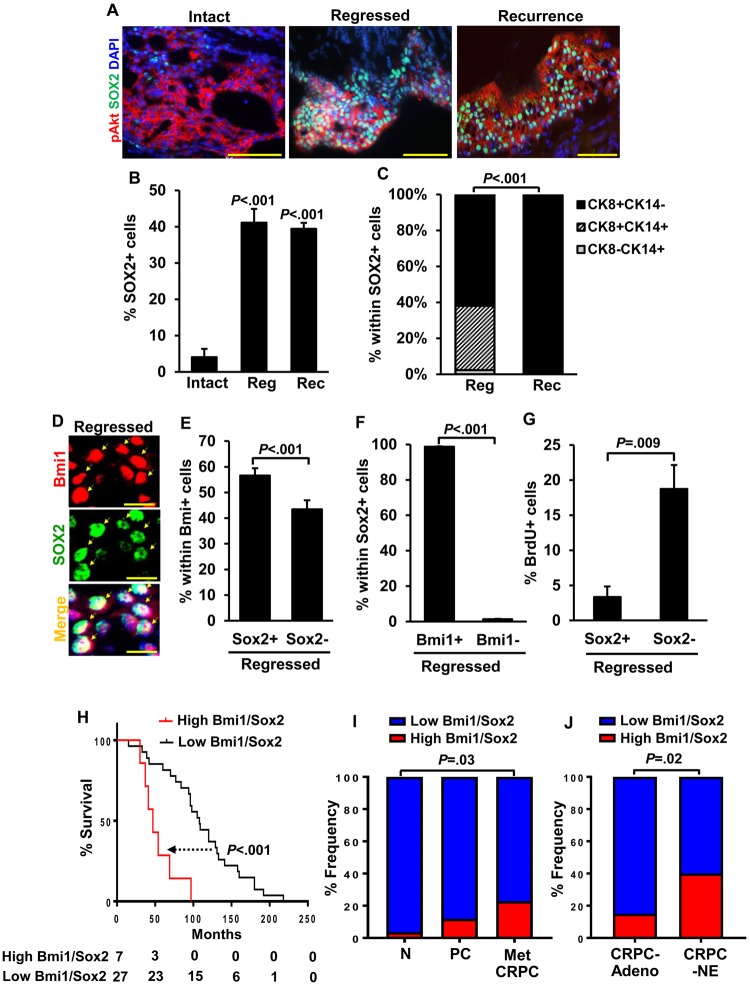
Given previous findings that prostate cancer lineage plasticity in the context of Tp53 and Rb loss could be mediated by epigenetic reprogramming factors Ezh2 and Sox2 (5,6), we evaluated Sox2 and Ezh2 expression in our model following castration using immunofluorescence staining. Notably, Sox2+ cells increased dramatically in the regressed tumors compared with intact tumors and remained at high levels in recurrent tumors (4.1 [2.3]% from 12 intact grafts, 41.1 [3.8]% from 10 regressed grafts, and 39.4 [1.6]% from 12 recurrent grafts; P < .001 regressed or recurrent vs intact) (Figure 4, A and B), but no changes were observed in the expression of Ezh2 (Supplementary Figure 4A, available online). Similarly, we observed increased Sox2 protein when LNCaP human prostate cancer cells were grown in androgen-depleted medium for 72 hours and DHT suppressed Sox2 (Supplementary Figure 4, B and C, available online). These observations suggest that androgen deprivation in this model leads to upregulation of Sox2, but Sox2 expression per se is not sufficient for driving basal phenotype, because all recurrent tumors were luminal despite retaining high levels of Sox2 (Figure 4, A–C). Coexpression analyses of Bmi1 and Sox2 in regressed tumors showed that 55.6% of Bmi1+ cells coexpressed Sox2; conversely, nearly all Sox2+ cells were positive for Bmi1 (Figure 4, D–F). Sox2- expression was associated with low BrdU incorporation (3.4 [1.5]% in Bmi1+Sox2- cells vs 18.8 [3.4]% in Bmi1+Sox2+cells, n = 10 grafts, P = .009) (Figure 4G), suggesting that the Bmi1+Sox2+ fraction in regressed lesions may represent a slow-cycling cancer stem cell pool from which recurrence arises. Finally, in metastatic CRPC patients pretreated with hormone therapy (18), high expression of BMI1 and SOX2 was associated with poor outcome (Figure 4H), and the frequency of samples with high BMI1/SOX2 expression progressively increased from normal to primary cancer to metastatic CRPC (Figure 4I) (18) and was higher still in CRPC-NE relative to CRPC-Adeno (Figure 4J) (19). Altogether, these observations support the notion that upregulation of both BMI1 and SOX2 could be key contributing factors to recurrence after ADT.
Figure 4.
Analysis of castration-resistant Bmi1+Sox2+ cells in regressed BC-Pten tumor lesions. A) Representative images of Sox2+ cells in p-Akt+ lesions of intact, regressed, and recurrent tumors of prostate grafts. Scale bar, 50 μm. B) Quantitation of Sox2+ cells from A. C) Each distribution of CK8+ luminal cells, CK8+CK14+intermediate cells, and CK14+ basal cells within Sox2+ tumor cells. D) Coexpression of Sox2 with Bmi1 in the regressed tumors of prostate grafts. Arrows indicate Sox2+ cells that are positive for Bmi1. Scale bar, 10 μm. E) Percentage of Sox2+ cells within Bmi1+ cells from “D”. F and G) Graphs showed that most of Sox2+ cells coexpressed with Bmi1 (98.7% from 8 grafts, F) and have low BrdU incorporation rate (G). B–G) Data represent the mean ± SD, two-sided Student t test. H) Survival analysis of a cohort of metastatic CRPC patients pretreated with hormone therapy shows that the patients with high expression in both Bmi1 and Sox2 (high Bmi1/Sox2, n = 7) have poorer prognosis than patients with low expression in both genes (low Bmi1/Sox2, n = 27). Data for this analysis were used from the Grasso prostate cancer dataset (NCBI GEO Database #: GSE35988) (18). P values were determined by log-rank test. I) Frequency of cases with high Bmi1/Sox2 expression in benign prostate tissues (N, n = 28), localized primary cancers (PC, n = 59), and metastatic CRPC (Met CRPC, n = 35) from the Grasso prostate cancer dataset. J) Comparision of the cases with high Bmi1/Sox2 expression in CRPC with adenocarcinoma (CRPC-Adeno, n = 40) and CRPC with neuroendocrine (CRPC-NE, n = 25) from the Beltran dataset (19). Cut-off values for every analysis were determined by the median both Bmi1 and Sox2 mRNA expression value. χ2 test. CRPC: castration-resistant prostate cancer.
Targeting Bmi1+Sox2+ Cells for Suppressing Tumor Recurrence by Small Molecule Inhibitor PTC-209
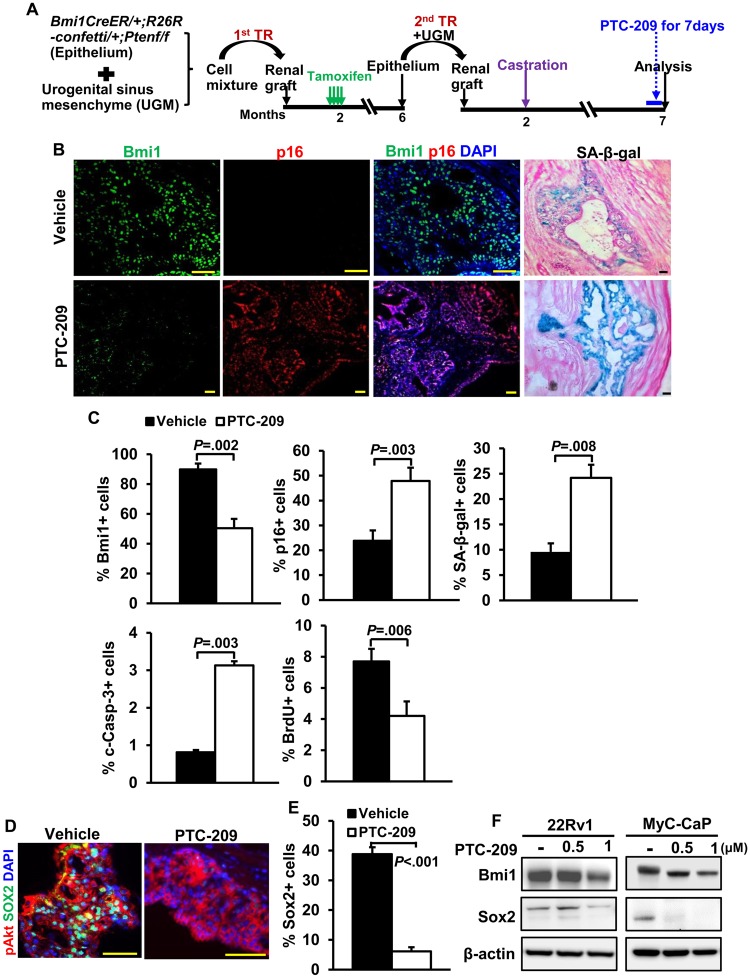
To determine the functional role of Bmi1 in tumor CARBs and recurrence, we exploited the availability of the small molecule Bmi1 inhibitor PTC-209 (22). We confirmed the ability of PTC-209 to reduce BMI1 protein levels and cell viability in human prostate cancer cell lines (Supplementary Figure 5, A and B, available online) and in recurrent BC-Pten mice in vivo after 7 days treatment (Figure 5, A and B). Additionally, reduced expression of Bmi1 by PTC-209 was accompanied by an increase in the fraction of p16+ and SA-β-gal+ cells (Figure 5, B and C). We also noted a profound reduction in Sox2 expression in p-Akt+ tumor lesions of PTC-209-treated mice (38.8 [2.3]% from 10 grafts in vehicle vs 6.1 [1.4]% from 10 grafts in PTC-209, P < .001) as well as human and mouse prostate cancer cell lines (Figure 5, D–F). Because there are currently no available small molecule inhibitors for Sox2, PTC-209 permits us to examine the effects of co-targeting Bmi1 and Sox2 on recurrence in our model.
Figure 5.
Targeting Bmi1 and Sox2 with small-molecule inhibitor PTC-209 in vitro and in vivo.A) Scheme for assessing the effects of PTC-209 on Bmi1 expression and cell proliferation in BC-Pten mice. Mice received vehicle or PTC-209 treatment daily for 7 days before they were killed. B) Immunofluorescence images for Bmi1 and p16 and SA-β-galactosidase assay (SA-β-gal) of frozen sections from either vehicle- or PTC-209-treated recurrence tumors. Scale bar, 50 μm. C) Quantitation of Bmi1+, p16+, SA-β-gal+, cleaved caspase-3+, or BrdU index in p-Akt+ tumor lesions of either vehicle (n = 10)- or PTC-209 (n = 10)-treated recurrence tumors. PTC-209 treatment decreased Bmi1 expression and proliferation in p-Akt positive tumor cells of recurrence tumors while concomitantly increasing p16 expression, apoptosis, and senescence. N = 10 grafts each. Data represent the mean ± SD, P**<.01, two-sided Student t test. D) IF staining reveals that Sox2 levels are statistically significantly reduced in recurrence tumors treated with PTC-209 compared with vehicle. E) Quantitation of Sox2+ cells from E. Data represent the mean ± SD, two-tailed Student t test. F) Immunoblot analysis of showing the protein levels of Bmi1 and Sox2 in 22Rv1 human and MyC-CaP mouse prostate cancer cells treated with vehicle or indicated concentration of PTC-209.
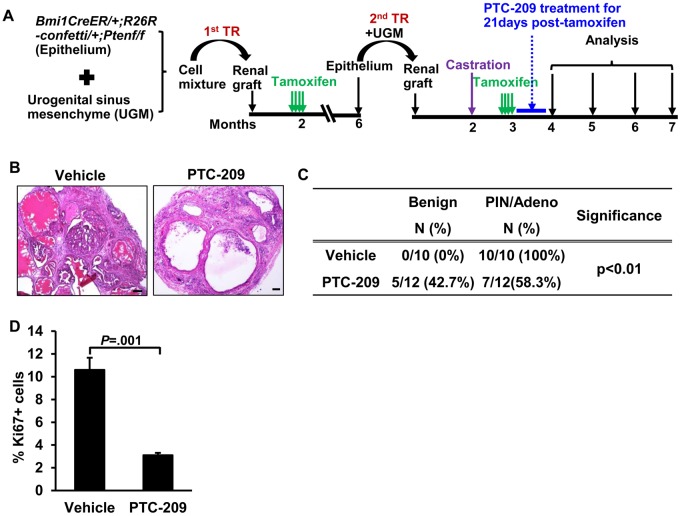
To test the effects of targeting Bmi1 and Sox2 on tumor recurrence, we conducted a trial of PTC-209 in SCID mice harboring BC-Pten grafts in which mice were treated with PTC-209 for 21 days beginning a month after castration (Figure 6A). Mice were followed-up to the endpoint of 5 months after castration for this experiment. We first confirmed downregulation of Bmi1 and Sox2 as well as upregulation of p16 in PTC-209-treated grafts as pharmacodynamic measures of the drug (Supplementary Figure 5C, available online). Pathological analysis of H&E-stained sections showed a statistically significant reduction in PIN/cancer incidence in PTC-209-treated grafts (100% in vehicle-treated grafts vs 58.3% in PTC-209-treated grafts, P < .001) concomitant with a reduction in proliferation (10.6 [1.1]% in vehicle-treated grafts vs 3.1 [0.2]% in PTC-209-treated grafts, P=.001) (Figure 6, B–D), indicating that targeting Bmi1+Sox2+ cells with PTC-209 impairs prostate cancer recurrence after castration in this model.
Figure 6.
The therapeutic effect of PTC-209 on BC-Pten tumor recurrence. A) Scheme for evaluating the capacity of PTC-209 to inhibit recurrence by tissue recombination strategy. B) H&E images showing the effects of PTC-209 on the growth of recurrent tumors. C) Disease distribution in either vehicle or PTC-209-treated recurrence tumors as assessed by a pathologist. Adeno: Adenocarcinoma, Fisher's exact test. D) Ki67 index in PTC-209 (n = 12)- or vehicle (n = 10)-treated grafts. Data represent the mean ± SD, two-sided Student t test. Scale bar, 50 μm. H&E: hematoxylin and eosin staining.
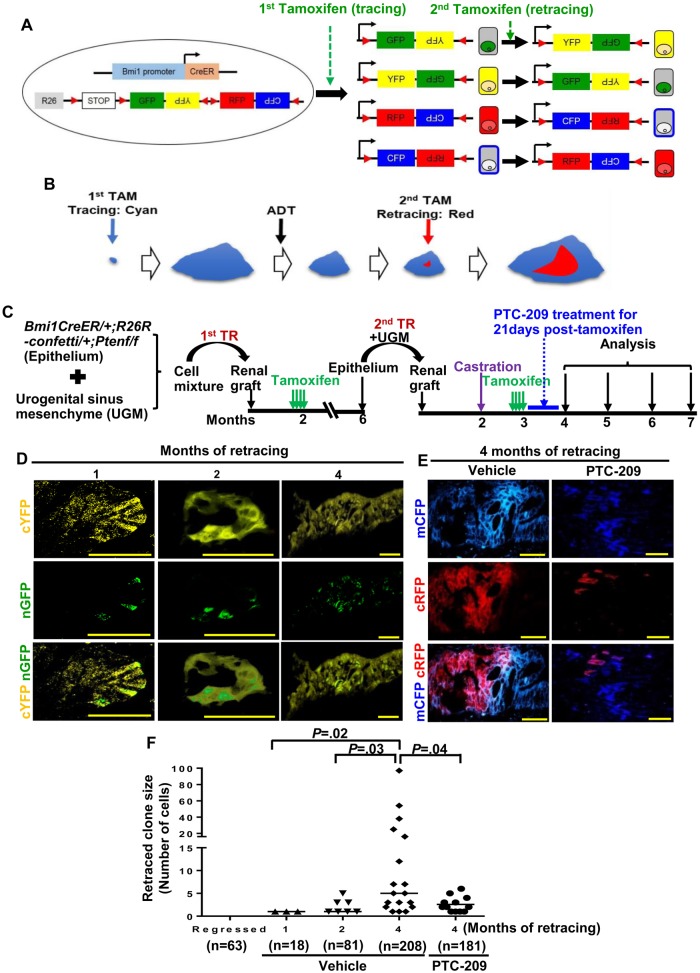
To more directly examine the cells that initiate tumor recurrence after castration, we employed lineage retracing in transgenic BC-Pten-R26R-confetti mice following the scheme shown in Supplementary Figure 6A (available online). The confetti allele allows “retracing” that could be used to monitor tumor recurrence in situ, because a second tamoxifen treatment can lead to switching of colors (ie, retracing) exclusively between red and cyan or yellow and green (Figure 7A). In this model, a second tamoxifen treatment was provided a month after castration to label Bmi1+ tumor cells, which can be retraced by a switch in the confetti color of an emerging subclone (Figure 7B) and followed by a quantification of clone size of retraced cells over time. Importantly, no spontaneously retraced cells were observed in p-Akt+ lesions of regressed prostate tumors in BC-Pten transgenic mice not treated with a second tamoxifen, but multiple retraced cells/clones of a distinct color were observed within parental clones in animals subjected to retracing for 2 months (Supplementary Figure 6, B and C, available online). Comorbidity in transgenic BC-Pten mice in which Pten is deleted in Bmi1+ cells throughout the body precluded analysis of retraced cells/clones in larger numbers and at longer periods posttamoxifen. We therefore turned to our model of BC-Pten prostate grafts rescued by tissue recombination as renal grafts in SCID mice as shown in Figure 7C. It is crucial for proper interpretation of the retracing experiment that PTC-209 treatment starts after tamoxifen has been cleared from the body so that any observed effects on the expansion of retraced clones are not due to suppression of Bmi1-CreER recombination activity by PTC-209. A control experiment using Bmi1-CreER; R26R-YFP transgenic mice showed that 1 day is enough for tamoxifen to be cleared to levels below which is sufficient to activate Bmi1-CreER activation (Supplementary Figure 7, available online). We therefore started PTC-209 3 days after the last tamoxifen treatment in the aforementioned retracing experiment. In grafts from vehicle-treated animals, we observed 9.1% retracing events in p-Akt+ lesions (n = 28 retracing events observed in 307 confetti tumor clones from 24 grafts). At 1 month after retracing, we observed only singly labeled retraced cells within tumor clones that switched colors (Figure 7D). The size of retraced subclones within parental clones progressively increased from 2 months through 4 months (Figure 7, D and F). At 4 months after retracing, subclones of emerging tumor cells that have switched their colors relative to the parent clone indicating initiation of recurrence from Bmi1+ tumor cells became more apparent (Figure 7, D and F). Furthermore, PTC-209 treatment suppressed the expansion of retraced subclones (retraced clone size = 2.6 [0.5] PTC-209 vs 15.7 [5.9] vehicle, n = 12, P = .04) (Figure 7, E and F).
Figure 7.
The role of tumor castration-resistant Bmi1+ cells (CARBs) in initiating recurrence after castration using lineage retracing. A and B) Scheme for tracing and retracing. Tamoxifen-activated CreER is expressed from the Bmi1 locus without disrupting the endogenous Bmi1 gene in Bmi1CreER mice. With the R26R-Confetti knock-in allele, induction of Cre recombinase randomly labels Bmi1+ cells with red, cyan, green, or yellow fluorescent protein. A second tamoxifen pulse will result in infrequent random “flipping” of the remaining reporter cassette and switching the color (as shown in B: cyan→red) of a Bmi1+ cell within a clone which can expand (retracing). C) Experimental design for lineage retracing of Bmi1+ tumor cells. D-F) Representative images (D and E) and quantification (F) of retraced cells before and at the different times after second tamoxifen induction in p-Akt+ lesions of PTC-209 (n = 12)- or vehicle (n = 12)-treated grafts. Clone size of retraced cells within parental clones increased progressively over time in vehicle treated mice while PTC-209 administration suppressed the expansion of retraced clones. n = the number of clones analyzed (clone size shown as number of cells per clone). Two-sided Student t test. Scale bar, 50 μm.
Discussion
This study provides direct evidence for the existence of tumor CARBs that can serve as a source for prostate tumor recurrence. One surprising finding from our study is our observation that BC-Pten tumors displayed a high degree of heterogeneity in Bmi1 expression in hormonally intact, regressed, and recurrent tumors despite that tumors were derived from Bmi1+ cells using the Bmi1-CreER driver. Notably, Bmi1+ tumor cells in castrated mice (ie, tumor CARBs) had lower rates of apoptosis than Bmi1- tumor cells, making them excellent candidates for the source of recurrent tumors that emerge. Nevertheless, how or why some tumor cells that start out as Bmi1+ subsequently downregulate Bmi1 expression in the course of tumor evolution is not clear at the moment.
Importantly, there was a clear phenotypic transition as intact tumors regressed following castration and then subsequently grew out as CRPC. In regressed tumors, a statistically significant fraction of malignant cells express the basal cell markers CK14 and p63. However, recurrent tumors return to being fully luminal. This transient phenotypic switch to basal-like cells in the regressed tumor is not due to the expansion of preexisting basal-like tumor cells as shown by our lineage-tracing studies and analysis of tumor cell proliferation and apoptosis. Adoption of a basal-like phenotype may be a strategy to survive androgen-deprivation as shown recently in other advanced prostate cancer models (5,6). Nouri et al. (8) have recently reported transient neuroendocrine differentiation in prostate cancer cells as a mechanism of therapy resistance.
We found increased Sox2 expression in BC-Pten prostate tumors following castration, concomitant with a phenotypic switch from luminal to basal-like cells in response to antiandrogen therapy. However, despite the reversion of recurrent tumors to a luminal phenotype, they retained high levels of Sox2 expression, indicating that this level of Sox2 expression is not sufficient to drive lineage plasticity. Nonetheless, these observations, together with reports of Sox2 upregulation in other models of antiandrogen therapy-resistant CRPC (23–25), are consistent with a role for Sox2 in establishing recurrence. Most strikingly, almost all Sox2+ cells were detected within the Bmi1+ tumor CARBs fraction, and pharmacologic inhibition of the small molecule Bmi1 inhibitor PTC-209 effectively targeted both Bmi1+Sox2+ cells and impaired castration-resistant tumor growth. Because both Sox2 and Bmi1 play important roles in cancer stem cells to maintain self-renewal and promote tumor drug resistance in multiple tumor types, simultaneous perturbation of Bmi1 and Sox2 could provide a potential therapeutic advantage leading to eradication of tumor-reinitiating cells. Previous studies have shown that targeting stem-cell-specific antigens by immune response may be important in tumor progression (26,27). Thus, exploiting the immune response against stem-cell antigens, such as Sox2 or Bmi1, may provide a therapy to prevent recurrence.
Because PTC-209 resulted in a marked decrease in Bmi1 expression, which was accompanied by a reduction in Sox2, we examined whether the ability of PTC-209 to downregulate Sox2 is mediated through Bmi1 inhibition. However, Bmi1 knockdown by small interfering RNA in human prostate cancer cell lines had no effects on Sox2 protein levels, suggesting that the effects of PTC-209 on Sox2 expression were not related to its repressive activity on Bmi1 (unpublished data YA Yoo and SA Abdulkadir). Because PTC-209 was identified as a compound targeting Bmi1 expression under posttranscriptional control of 5’ and 3’ untranslated regions, it is possible that PTC-209 may elicit its effect on Sox2 by directly regulating Sox2 translation through untranslated region-regulatory regions.
The R26R-confetti allele was successfully used to monitor the ability of tumor CARBs to initiate recurrence. A caveat of the R26R-confetti allele strategy is that spontaneous color conversion might occur even in the absence of tamoxifen induction, particularly in the setting of cancer with genomic instability. However, retraced cells were never observed in regressed prostate tumors without a second tamoxifen, indicating that there was no spontaneous color conversion in our cohort. We observed retraced cells coexpressing two colors, however, such as cyan and red, consistent with polyploidy of tumor cells, making it possible for a retracing recombination event to occur at one allele to express a new color while other allele(s) maintain the original color.
A limitation of our study is that we have not defined the relative roles of Bmi1 vs Sox2 in driving recurrence in this model. This will require further studies. Our results provide strong evidence to support the notion that castration-resistant Bmi1+Sox2+ cells serve as the cells of origin for prostate tumor recurrence and that targeting Bmi1/Sox2-expressing tumor-reinitiating cells with PTC-209 could be an efficacious treatment for recurrent tumors with Pten loss.
Funding
This work was supported by National Cancer Institute grants (R01CA167966 and R01CA123484).
Notes
Affiliations of authors: Department of Urology (YAY, RV, BL, HM, SAA) and Department of Pathology (SAA), Northwestern University Feinberg School of Medicine, Chicago, IL; Department of Pathology, Microbiology and Immunology, Vanderbilt University School of Medicine, Nashville, TN (MMD); The Robert H. Lurie Comprehensive Cancer Center, Northwestern University Feinberg School of Medicine, Chicago, IL (SAA).
The authors declare no competing financial interests. The study sponsor had no role in the design of the study; the collection, analysis, and interpretation of the data; the writing of the manuscript; or the decision to submit the manuscript for publication.
Author contributions: SAA and YAY conceived the study, analyzed the data and wrote the manuscript. YAY and HM performed the experiments. RV analyzed the genomic data. BL helped in performing the experiments and writing the manuscript. MMD conducted evaluation of disease.
Supplementary Material
References
- 1. Toledo-Pereyra LH. Discovery in surgical investigation: the essence of Charles Brenton Huggins. J Invest Surg. 2001;14(5):251–252. [DOI] [PubMed] [Google Scholar]
- 2. Assikis VJ, Simons JW.. Novel therapeutic strategies for androgen-independent prostate cancer: an update. Semin Oncol. 2004;31(2 Suppl 4):26–32. [DOI] [PubMed] [Google Scholar]
- 3. Scher HI, Sawyers CL.. Biology of progressive, castration-resistant prostate cancer: directed therapies targeting the androgen-receptor signaling axis. J Clin Oncol. 2005;23(32):8253–8261. [DOI] [PubMed] [Google Scholar]
- 4. Watson PA, Arora VK, Sawyers CL.. Emerging mechanisms of resistance to androgen receptor inhibitors in prostate cancer. Nat Rev Cancer. 2015;15(12):701–711. [DOI] [PMC free article] [PubMed] [Google Scholar]
- 5. Mu P, Zhang Z, Benelli M, et al. SOX2 promotes lineage plasticity and antiandrogen resistance in TP53- and RB1-deficient prostate cancer. Science. 2017;355(6320):84–88. [DOI] [PMC free article] [PubMed] [Google Scholar]
- 6. Ku SY, Rosario S, Wang Y, et al. Rb1 and Trp53 cooperate to suppress prostate cancer lineage plasticity, metastasis, and antiandrogen resistance. Science. 2017;355(6320):78–83. [DOI] [PMC free article] [PubMed] [Google Scholar]
- 7. Zou M, Toivanen R, Mitrofanova A, et al. Transdifferentiation as a mechanism of treatment resistance in a mouse model of castration-resistant prostate cancer. Cancer Discov. 2017;7(7):736–749. [DOI] [PMC free article] [PubMed] [Google Scholar]
- 8. Nouri M, Caradec J, Lubik AA, et al. Therapy-induced developmental reprogramming of prostate cancer cells and acquired therapy resistance. Oncotarget. 2017;8(12):18949–18967. [DOI] [PMC free article] [PubMed] [Google Scholar]
- 9. Glinsky GV, Berezovska O, Glinskii AB.. Microarray analysis identifies a death-from-cancer signature predicting therapy failure in patients with multiple types of cancer. J Clin Invest. 2005;115(6):1503–1521. [DOI] [PMC free article] [PubMed] [Google Scholar]
- 10. van Leenders GJ, Dukers D, Hessels D, et al. Polycomb-group oncogenes EZH2, BMI1, and RING1 are overexpressed in prostate cancer with adverse pathologic and clinical features. Eur Urol. 2007;52(2):455–463. [DOI] [PubMed] [Google Scholar]
- 11. Nacerddine K, Beaudry JB, Ginjala V, et al. Akt-mediated phosphorylation of Bmi1 modulates its oncogenic potential, E3 ligase activity, and DNA damage repair activity in mouse prostate cancer. J Clin Invest. 2012;122(5):1920–1932. [DOI] [PMC free article] [PubMed] [Google Scholar]
- 12. Fan C, He L, Kapoor A, et al. Bmi1 promotes prostate tumorigenesis via inhibiting p16(INK4A) and p14(ARF) expression. Biochim Biophys Acta. 2008;1782(11):642–648. [DOI] [PubMed] [Google Scholar]
- 13. Bansal N, Bartucci M, Yusuff S, et al. BMI-1 targeting interferes with patient-derived tumor-initiating cell survival and tumor growth in prostate cancer. Clin Cancer Res. 2016;22(24):6176–6191. [DOI] [PMC free article] [PubMed] [Google Scholar]
- 14. Yoo YA, Roh M, Naseem AF, et al. Bmi1 marks distinct castration-resistant luminal progenitor cells competent for prostate regeneration and tumour initiation. Nat Commun. 2016;7:12943.. [DOI] [PMC free article] [PubMed] [Google Scholar]
- 15. Sangiorgi E, Capecchi MR.. Bmi1 is expressed in vivo in intestinal stem cells. Nat Genet. 2008;40(7):915–920. [DOI] [PMC free article] [PubMed] [Google Scholar]
- 16. Snippert HJ, van der Flier LG, Sato T, et al. Intestinal crypt homeostasis results from neutral competition between symmetrically dividing Lgr5 stem cells. Cell. 2010;143(1):134–144. [DOI] [PubMed] [Google Scholar]
- 17. Wang S, Gao J, Lei Q, et al. Prostate-specific deletion of the murine Pten tumor suppressor gene leads to metastatic prostate cancer. Cancer Cell. 2003;4(3):209–221. [DOI] [PubMed] [Google Scholar]
- 18. Grasso CS, Wu YM, Robinson DR, et al. The mutational landscape of lethal castration-resistant prostate cancer. Nature. 2012;487(7406):239–243. [DOI] [PMC free article] [PubMed] [Google Scholar]
- 19. Beltran H, Prandi D, Mosquera JM, et al. Divergent clonal evolution of castration-resistant neuroendocrine prostate cancer. Nat Med. 2016;22(3):298–305. [DOI] [PMC free article] [PubMed] [Google Scholar]
- 20. Chiba T, Seki A, Aoki R, et al. Bmi1 promotes hepatic stem cell expansion and tumorigenicity in both Ink4a/Arf-dependent and -independent manners in mice. Hepatology. 2010;52(3):1111–1123. [DOI] [PubMed] [Google Scholar]
- 21. Park IK, Morrison SJ, Clarke MF.. Bmi1, stem cells, and senescence regulation. J Clin Invest. 2004;113(2):175–179. [DOI] [PMC free article] [PubMed] [Google Scholar]
- 22. Kreso A, van Galen P, Pedley NM, et al. Self-renewal as a therapeutic target in human colorectal cancer. Nat Med. 2014;20(1):29–36. [DOI] [PubMed] [Google Scholar]
- 23. De Velasco MA, Tanaka M, Yamamoto Y, et al. Androgen deprivation induces phenotypic plasticity and promotes resistance to molecular targeted therapy in a PTEN-deficient mouse model of prostate cancer. Carcin. 2014;35(9):2142–2153. [DOI] [PMC free article] [PubMed] [Google Scholar]
- 24. Jia X, Li X, Xu Y, et al. SOX2 promotes tumorigenesis and increases the anti-apoptotic property of human prostate cancer cell. J Mol Cell Biol. 2011;3(4):230–238. [DOI] [PubMed] [Google Scholar]
- 25. Markert EK, Mizuno H, Vazquez A, et al. Molecular classification of prostate cancer using curated expression signatures. Proc Natl Acad Sci USA. 2011;108(52):21276–21281. [DOI] [PMC free article] [PubMed] [Google Scholar]
- 26. Dhodapkar MV, Sexton R, Das R, et al. Prospective analysis of antigen-specific immunity, stem-cell antigens, and immune checkpoints in monoclonal gammopathy. Blood. 2015;126(22):2475–2478. [DOI] [PMC free article] [PubMed] [Google Scholar]
- 27. Schmitz M, Temme A, Senner V, et al. Identification of SOX2 as a novel glioma-associated antigen and potential target for T cell-based immunotherapy. Br J Cancer. 2007;96(8):1293–1301. [DOI] [PMC free article] [PubMed] [Google Scholar]
Associated Data
This section collects any data citations, data availability statements, or supplementary materials included in this article.


