

Abstract
Introduction:
The aim of this article is to investigate the determinants of sleeping patterns in children up to age 9 on a large and geographically homogeneous sample of British children and parents, focusing in particular on the role of economic and social factors, specifically on income.
Aims and Methods:
The data of this study come from the Avon Longitudinal Study of Parents and Children, a long-term health research project that recruited over 14000 pregnant women who were due to give birth between April 1991 and December 1992 in Bristol and its surrounding areas, including some of Somerset and Gloucestershire. Logistic regression models for the sleep problem dummies and log-linear models for the sleep quantity.
Results:
One additional item in the material deprivation index is associated to an increase of around 10–20% in the odds of having at least 1 sleep problem. Similarly, children from the richest families are less likely to have any sleep problem up to 115 months (around 20% reduction in the odds). Mother’s characteristics (i.e., education and mental health in the pregnancy period) are also significant predictors. Sleep quantity does not vary much and is not sensitive to socioeconomic factors.
Conclusion:
Exposure to income-related inequalities affects child sleep. Further research is needed to understand if sleep in early life influences future health and economic trajectories.
Keywords: ALSPAC, child sleep, family socioeconomic status, material deprivation.
Statement of Significance
The extent to which socioeconomics factors can affect sleep in children is still an open question. Results of this study show that material deprivation of the households is one of the strongest predictors of the quality of sleep in children. Similarly, the relative position of the household in the income distribution matters. However, none of these factors influences child sleep length. Results can be interpreted also as additional evidence of the existence of a health gradient at an early stage of life. Future research should investigate further the mechanisms through which socioeconomic conditions of the parents can affect the sleep of the children.
INTRODUCTION
The importance of early life development has long been recognized in the literature. A prominent study on the relation between socioeconomic factors and child development concluded that “virtually every aspect of early human development, from the brain’s evolving circuitry to the child’ capacity of empathy, is affected by the environments and the experiences that are encountered in a cumulative fashion, beginning in the prenatal period and extending throughout the early childhood.”1
Childhood conditions can predict adult diseases, as well as their economic and cognitive performances.2–4 The psychological literature shows that early life stress associated to low socioeconomic status (SES) and early family environment affects the biological and the neurological regulatory systems. This can in turn initiate a vicious circle, altering the behavioral, autonomic neuroendocrine, and immune responses to later life challenges, ultimately affecting physical and mental health.5 The economic literature has shown that bad early family environments influence the cognitive and noncognitive abilities of the children, reducing their chances to cumulate the level of human capital required to achieve economic, social, and emotional fulfillment at later stages.6 Consequently, educational and health-related childhood interventions are commonly advocated for to counterbalance the negative enduring impact of a low family SES.6,7
Despite the abundance of evidence regarding the socioeconomic health gradient, the mechanisms through which poverty and deprivation can affect health outcomes have not been precisely identified. Following an emerging area of analysis in the child development literature,8 one can reasonably think that sleep in children can represent a possible mediator for such a relation. If sleeping patterns were influenced by the family SES and could in turn be linked to bad health and cognitive outcomes, sleep could represent one credible factor through which social and economic dimensions affect child development and future achievements.
Indeed, sleeping problems in children have been found to be associated with important contemporaneous and longitudinal effects. For example, we know that children that do not sleep well have lower cognitive performances and riskier health behaviors.9 Small sample laboratory studies also detect a longitudinal relation between poor sleep in children and both academic results and behavioral problems 2 years later.10,11 Accordingly, sleep health has become the focus for interventions such as screening in schools.12
Given the impact of children’s sleep on their present and future life, it then becomes crucial to identify the main determinants of sleeping patterns in children, testing if and to what extent the family SES could be included among them. The scientific evidence on the this is sparse and varies substantially depending on the data set used and the country taken as a reference.13 In a meta-analysis conducted on all the observational studies on sleep in children, authors show that while there are some clear developmental trends in sleep across age groups, there are still several aspects of sleep that have limited documentation.14 In particular, sleep patterns seem to be significantly affected by the country and the culture of the parents. No explicit mention is made in the meta-analysis to the SES of the parents. However, the family social and economic background, like culture, is likely to affect parents’ behaviours and attitudes toward child sleep. It is thus important to look more in depth at the role of the socioeconomic environment in affecting children sleeping patterns.
Focusing in particular on the family SES, the evidence of a link between income and sleeping patterns (i.e., “sleep gradient”) has been reported thoroughly across many age groups in adulthood.15–17 Among children, however, this association is not yet conclusive. Although US studies on children aged between 1 and 17 years have reported that children from poorer families have more sleep problems,18,19 a notable study of Parisian children aged 8.5–11.5 years came to a different conclusion.20 Importantly, these studies rely on relatively small samples (<200). Given the high variability of income and the importance of its distribution in defining SES categories, large scale studies can give a further contribution to study the heterogeneity in SES conditions and their relation to child sleep, and strengthen the robustness and the validity of the existing evidence.
The aim of this article is to investigate the determinants of sleeping patterns in children up to age 9 on a large and geographically homogeneous sample of British children and parents, focusing on the role of economic and social factors, and specifically on income. The focus of the analysis is on the parents’ socioeconomics characteristics.
Data are from a prospective observational and longitudinal survey, the Avon Longitudinal Study of Parents and Children (ALSPAC). This data set has already been used for describing sleep patterns in children. Many of the studies focus on specific subgroups of children.21–24 One recent study, however, uses ALSPAC to identify the associations between sleep duration in children and the demographic characteristics of the parents, an objective that is closely related to the aim of this analysis.25
In this work, we extend the above-mentioned study in 2 ways. First, since our focus is explicitly on family SES, we introduce more relevant SES-related dimensions. The problem here is that the mentioned study relies on the social class of the child, defining it broadly as the education and the employment of the parents. This is useful in most analyses because these variables are easily accessible and clearly interpretable. A weak association between education/employment and child sleep, however, is not enough to discard altogether the socioeconomic argument. Other SES dimensions might as well play a role, such as income and material living conditions. If observable, such determinants should then be directly investigated. This is indeed the focus of this analysis, where the SES of the child is assessed by considering also the absolute income and material deprivation of the family. A second improvement over the previous evidence based on ALSPAC is related to the objective of analysis. The focus of this study is indeed not limited to sleep quantity but extends to sleep quality, a dimension that is also potentially susceptible to environmental characteristics (as shown in Results). This approach thus allows producing a more conclusive evidence regarding the relevant association between sleep in children and their SES.
The analysis will follow the standard structure. After methodology and data are described, results will be provided. Given the stated focus of the study, main tables will show only the most relevant covariates, keeping full tables in the Supplementary Material. A full discussion of the findings and their relation with the existing scientific evidence will end the article.
METHODS
The data of this study come from the ALSPAC, a long-term health research project that recruited over 14000 pregnant women resident in Avon, UK, with expected dates of delivery on April 1, 1991 to December 31, 1992. These women and their families have been interviewed regularly ever since. The initial sample was composed of 14541 pregnancies, resulting in a total of 14062 live births. Excluding information from children who died within 1 year of birth and children from triplet and quadruplet pregnancies for which data are not available, we have a total sample of 13978 children. A full description of the cohort profile has been published elsewhere.26 Please note that the study website contains details of all data that is available through a fully searchable data dictionary.27 Ethical approval for the study was obtained from the ALSPAC Ethics and Law Committee and the Local Research Ethics Committee.
Participants
The children of ALSPAC sample are very similar to the UK average in terms of height and weight at birth, and also at 1 and 2 years old. The sample is equally divided between males and females (52% are males). One third of them are first-born (33%), 5% have a birthweight below 2500 g, and 6% were born before week 37 of gestation. The sample is rather homogeneous in the ethnicity of the children (95% are white—Caucasian), but there is a marked variability in the SES of the families (parental education, family income, and material deprivation). About 13% of mothers have a degree and most of them have a job. Only a small fraction of children (9%) lives in a single-adult household, or has divorced or separated parents (6%). Average age of mothers’ at birth is 28 years.
Measures of Child Sleep
Child sleeping problems are reported by the carer (who is most often the mother) at several ages during childhood. Information on both sleep quality and quantity of the child is available. Child sleep quality is reported by the mother through the following question related to 6 sleep problems: “In the past year has your child regularly: refused to go to bed; woken up very early; had difficulty going to sleep; had nightmares; continued to get up after being put to bed; got up after only a few hours sleep.” For each of the 6 sleep problems, the possible answers are “Yes, but did not worry me; Yes, worried me somewhat; Yes, worried me greatly; No, did not happen regularly.” In the following analyses, we create dichotomous variables for the child having a sleep problem whenever the mother answered everything but “No” to the question. The key focus of our analyses will be a variable for the child having at least 1 of the 6 problems. Child sleep quantity refers to the length of sleep (in hours) during the night and the day, measured as the difference between the time the child goes to sleep and the time they wake up plus the number of hours slept during the day. We consider the following child’s ages: 18, 30, 42, 57, 69, and 115 months.
Measures of Family Economic Status
Family SES is assessed by the mother’s highest educational level and household income. Mother’s education level takes 5 values reflecting the UK education system: cse/none education represents the lowest educational attainment, followed by vocational education, O-level, A-level, and university degree. Family income is measured around child’s 3, 4, 7, and 8 years old in the form of categorical variable of 5 bands, representing net household income per week. For each wave, we convert these bands to income figures using the income distribution of Southwest region taken from the Family Resource Survey. We then average the resulting income figures over the 4 waves to have a measure of permanent income over childhood and divide it into 4 quartiles. The average income for the first quartile is £150 per week, £282 for the second quartile, £453 for the third, and £660 for the fourth upper quartile.
We also consider an index of material deprivation, defined in terms of quality of the house and of the neighborhood where the child lives. The index is assessed at several ages during childhood (at child’s age 2, 3, 5, 7, and 10 years), and it is composed of 8 items: whether the house has an indoor toilet, a bath or shower at sole use of the household, a working phone, damps; whether the house is adequately warm during the winter; whether the neighborhood has problems of noise in the streets, vandalism, or rubbish. These are commonly used items in indexes of material deprivation.28,29 The material deprivation index can take values from 0 (family deprived in none item) to 8 (family deprived in all the items). However, none of the families is deprived in all the items, and the maximum value of the index we observe in the sample is 7. More than one third of the families are not deprived at all in any item (37%), about one third are deprived in 1 of the 8 items (33%) and less than one third of families are deprived in 2 or more items (29%). The correlation between household income and material deprivation is, as expected, negative, but not very high (−0.27), suggesting that these measures capture different aspects of family economic conditions.
Other Covariates
In every model, we include the following controls: mother’s age at birth, in 3 bands of age (<21, 21–34, ≥35 years), child gender, child ethnicity (white vs. others), a dummy for the child being first born, a dummy for the mother working, a dummy for parents being divorced or separated, father’s highest education level, a dummy for the child living in a single-adult household, the total number of children in the household, a dummy for low birthweight (<2500 g), and a dummy for preterm birth (gestation week <37). Importantly, we control for mother’s mental health during pregnancy, measured by mother’s quality of sleep, anxiety, and depression at week 18 and 32 of gestation (we take the average of the 2 weeks). Sleep is assessed by a dummy variable for whether the mother reports to sleep alright. Maternal anxiety is captured by the anxiety component of the Crown-Crisp Experiential Index (CCEI), while maternal depression is assessed through the Edinburgh Post-Natal Depression Scale (EPDS). CCEI and EPDS range 0–16 and 0–30, respectively, with higher values indicating more anxiety and depression.
Data Analysis
Throughout the article, we report the incidence of the sleep problems in percentages when we use dummy variables and the mean when we refer to sleep quantity or total number of sleep problems. We estimate the odds ratios (OR) and corresponding 95% confidence intervals (CIs) using logistic regression models for the sleep problem dummies and log-linear models for the sleep quantity. For each model, we report also the p-value of the estimated coefficients to indicate their significance. When p-value > .10, we indicate it as “NS” (Not significant). We estimate the models for overall childhood and separately according to 4 bands of child age: 18–30, 24–57, 69, and 115 months.
RESULTS
Sleep Quality
Table 1 shows the behavior of the 7 quality-related items along different age groups. The most common problem at the very early stage of the childhood is early wakening. Once the child grows, difficulty in going to sleep is indicated as the most common problem by the mothers in the sample. One third of the children have nightmares at night, with the number increasing in age up to 69 months. The percentage of children continuously waking up after being put to bed is almost stable in the first years and then drops at 115 months. Altogether, most mothers report their children to have at least 1 sleep problem, with the percentage being higher in older than earlier ages. In terms of sleep quantity, the total number of hours slept per day is decreasing over time, from 12.4 h at 18–30 months to 10.4 h at 115 months, with an average of 11.6 h.
Table 1.
Sleep Quality and Quantity Over Child’s Age.
| 18-30 Months | 42–57 Months | 69 Months | 115 Months | |||||||||
|---|---|---|---|---|---|---|---|---|---|---|---|---|
| N | % [95% CI] | N | % [95% CI] | N | % [95% CI] | N | % [95% CI] | |||||
| At least 1 sleep problem | 21292 | 72.7 | [72.1–73.3] | 19477 | 79.7 | [79.1–80.2] | 8639 | 79.5 | [78.6–80.3] | 7790 | 75.1 | [74.1–76.1] |
| Refuse going to bed | 21242 | 35.9 | [35.3–36.6] | 19438 | 41.9 | [41.2–42.5] | 8621 | 37.8 | [36.8–38.8] | 7733 | 36.2 | [35.2–37.3] |
| Woken up early | 21223 | 52.2 | [51.6–52.9] | 19430 | 52.8 | [52.1–53.5] | 8580 | 45.7 | [44.6–46.7] | 7768 | 33.7 | [32.6–34.8] |
| Difficulty going to sleep | 21155 | 35.4 | [34.7–36.0] | 19413 | 38.7 | [38.0–39.3] | 8591 | 46.1 | [45.1–47.2] | 7741 | 52.5 | [51.4–53.6] |
| Nightmares | 21194 | 17.8 | [17.3–18.4] | 19330 | 35.5 | [34.9–36.2] | 8516 | 42.2 | [41.2–43.3] | 7626 | 29.1 | [28.1–30.1] |
| Continusously wakes up | 21173 | 33.4 | [32.8–34.1] | 19397 | 35.7 | [35.0–36.4] | 8570 | 32.3 | [31.3–33.3] | 7727 | 22.2 | [21.3–23.2] |
| Waken up after few hours | 21190 | 21.9 | [21.4–22.5] | 19385 | 14.8 | [14.3–15.3] | 8576 | 11.1 | [10.5–11.8] | 7722 | 6.5 | [6.0–7.1] |
| Sleep quantity (mean hours) | 20716 | 12.4 | [12.4–12.4] | 19129 | 11.5 | [11.5–11.5] | 8422 | 11.3 | [11.3–11.3] | 7801 | 10.4 | [10.3–10.4] |
Table 2 shows the incidence of sleep problems and average sleep duration by family socioeconomic characteristics (average across all ages of childhood). The percentage of children having at least 1 of the 6 sleep problems is decreasing in income: among children in the poorest quartile, 83.5% have sleep problems, while 74.1% among children in the richest quartile. A similar income gap appears for each of the 6 sleep problems, while no big differences emerge in terms of sleep quantity. Using an absolute indicator of poverty, i.e., material deprivation, we observe similarly that the incidence of sleep problems is higher among children from more deprived families (“Deprived in 2 or more items”) for all the sleep problems, with the only exception of nightmares. Children from highly educated mothers are much less likely to have sleep problems, but they sleep a bit less.
Table 2.
Percentage of Sleep Problems According to Family’s Socio-economic Status.
| At least 1 sleep problem | Refuse going to bed | Woken up early | Difficulty going to sleep | Nightmares | Continusously wakes up | Waken up after few hours | Sleep length (mean) | |
|---|---|---|---|---|---|---|---|---|
| Income quartile | ||||||||
| Q1 (< £250 p/w) | 83.5 | 49.4 | 56.7 | 46.3 | 34.2 | 38.4 | 21.2 | 11.6 |
| Q2 (£250–£400 p/w) | 79.3 | 41.7 | 51.1 | 44.2 | 31.2 | 33.4 | 15.5 | 11.6 |
| Q3 (£400–£600 p/w) | 76.3 | 36.4 | 46.0 | 42.7 | 31.2 | 31.5 | 13.1 | 11.6 |
| Q4 (> £600 p/w) | 74.1 | 32.4 | 44.2 | 41.3 | 31.6 | 30.6 | 10.9 | 11.5 |
| Material deprivation | ||||||||
| No deprived | 76.2 | 37.2 | 46.9 | 42.4 | 31.1 | 30.6 | 13.6 | 11.6 |
| Deprived in 1 item | 77.1 | 37.6 | 49.5 | 42.7 | 30.6 | 33.4 | 14.9 | 11.7 |
| Deprived in 2 or more items | 80.7 | 44.4 | 54.9 | 44.0 | 29.7 | 38.3 | 21.3 | 11.9 |
| Mother’s education | ||||||||
| Cse/None | 84.0 | 50.9 | 58.1 | 43.8 | 30.6 | 36.5 | 22.1 | 11.7 |
| Vocational | 82.5 | 48.3 | 54.0 | 46.1 | 32.6 | 36.2 | 19.4 | 11.7 |
| O-level | 78.4 | 40.8 | 50.0 | 44.0 | 31.3 | 33.3 | 15.5 | 11.6 |
| A-level | 75.4 | 34.9 | 46.1 | 42.6 | 32.1 | 32.5 | 12.6 | 11.5 |
| Degree | 72.7 | 28.3 | 41.2 | 41.2 | 32.8 | 29.6 | 9.2 | 11.4 |
Figure 1 shows graphically the gap in the total number of sleep problems by material deprivation and family income for each age of the child. For representation purposes, the material deprivation index is split in 3 categories: families not deprived (material deprivation = 0), families deprived in only 1 out of the 8 items (material deprivation = 1), and families deprived in 2 or more items (material deprivation ≥2). In relation to income, we show the sleep gap between the poorest and richest quartile, i.e., quartile 1 (household income lower than £250 per week) and quartile 4 (more than £660 per week). The figure shows a clear gap in child sleep between children from deprived and low-income families and those from no deprived or high-income families. The gap starts already in early years of life, at 18 months, and is constantly maintained over the childhood.
Figure 1.
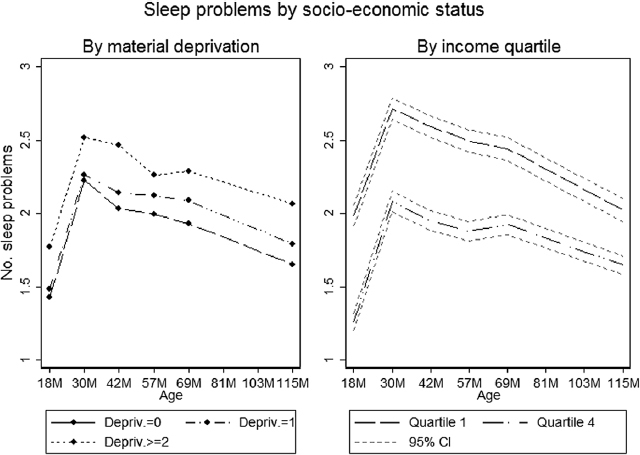
This shows the average number of sleep problems over child’s age according to the level of material deprivation and family income. The material deprivation index is split into 3 categories: families not deprived (“Depriv. = 0”), families deprived in only 1 of the 8 items (“Depriv. = 1”), and families deprived in 2 or more items (“Depriv. ≥ 2”). In relation to income, the figure shows the gap between the first poorest quartile (household income lower than £250 per week) and the upper richest quartile (household income higher than £660 per week).
Table 3 displays the results of the multivariate logistic regressions in relation to child sleep quality. The table reports the ORs and the CIs for the main variables, and corresponding p-values of the estimated coefficients. Results show that, conditional on all the other covariates, material deprivation appears to significantly affect sleep quality at all ages of the child: one additional item in the material deprivation index is associated to an increase of around 10–20% in the odds of having at least 1 sleep problem. Similarly, household income plays a significant role. Since the reference category is the bottom quartile, Table 3 shows that children from the richest families are less likely to have any sleep problem up to 115 months (around 20% reduction in the odds).
Table 3.
Odd Ratios for Child Having at Least 1 Sleep Problem According to Child Age (95% Confidence Interval): Main Variables.
| 18–30 Months | 42–57 Months | 69 Months | 115 Months | |||||
|---|---|---|---|---|---|---|---|---|
| OR [95% CI] | P-value | OR [95% CI] | P-value | OR [95% CI] | P-value | OR [95% CI] | P-value | |
| Mother’s education | ||||||||
| Cse/none | 1.00 | 1.00 | 1.00 | 1.00 | ||||
| Vocational | 0.78 [0.66–0.92] | .004 | 0.87 [0.70–1.08] | NS | 1.03 [0.72–1.46] | NS | 0.88 [0.64–1.21] | NS |
| O-level | 0.64 [0.57–0.74] | <.001 | 0.69 [0.59–0.82] | <.001 | 0.59 [0.45–0.76] | < 0.001 | 0.85 [0.66–1.09] | NS |
| A-level | 0.58 [0.50–0.66] | <.001 | 0.59 [0.49–0.70] | <.001 | 0.57 [0.44–0.75] | < 0.001 | 0.78 [0.60–1.02] | .070 |
| Degree | 0.57 [0.48–0.67] | <.001 | 0.53 [0.43–0.64] | <.001 | 0.44 [0.32–0.59] | < 0.001 | 0.72 [0.53–0.97] | .032 |
| Material deprivation | 1.06 [1.02–1.10] | .007 | 1.14 [1.08–1.21] | <.001 | 1.17 [1.06–1.28] | 0.001 | 1.2 [1.08–1.33] | <.001 |
| Income quartile | ||||||||
| First quartile | 1.00 | 1.00 | 1.00 | 1.00 | ||||
| Second quartile | 0.94 [0.83–1.05] | NS | 0.88 [0.75–1.02] | .096 | 0.66 [0.52–0.84] | 0.001 | 0.88 [0.70–1.11] | NS |
| Third quartile | 0.82 [0.73–0.93] | .001 | 0.78 [0.67–0.91] | .002 | 0.67 [0.53–0.86] | 0.001 | 0.87 [0.69–1.11] | NS |
| Fourth quartile | 0.80 [0.70–0.91] | .001 | 0.88 [0.75–1.04] | NS | 0.74 [0.57–0.96] | 0.024 | 0.87 [0.68–1.12] | NS |
| Maternal sleep | 0.90 [0.80–1.02] | .089 | 0.85 [0.73–0.98] | .028 | 0.68 [0.54–0.85] | 0.001 | 0.92 [0.74–1.15] | NS |
| Maternal anxiety | 1.04 [1.02–1.06] | <.001 | 1.05 [1.02–1.07] | <.001 | 1.06 [1.02–1.10] | 0.002 | 1.03 [0.99–1.07] | NS |
| Maternal depression | 1.04 [1.02–1.05] | <.001 | 1.05 [1.03–1.07] | <.001 | 1.03 [1.00–1.06] | 0.036 | 1.06 [1.03–1.09] | <.001 |
| N | 15712 | 13184 | 5913 | 5011 | ||||
Notes: Logistic regression models. Maternal sleep, anxiety, and depression refer to values during pregnancy. Other controls: mother’s age, child gender, child ethnicity, first born, mother’s employment, parents’ divorced or separated, father’s education, single-adult household, number of children in the household, a dummy for birthweight <2500 g, and a dummy for gestation week <37.
Material deprivation and family income have a significant effect on all the specific sleep problems (see Table 4, for the separate estimates of each sleep problem for overall childhood. Separate estimates by sleep problem for each child’s age produce similar results and are available upon request). Children living in more deprived households have a lower quality of sleep, as measured by all the type of sleep problems, with the only exception of nightmares. Family income is a significant predictor for each of the sleep problems considered, with children from the richest families being less likely to have any of the 6 sleep problems compared to children from the poorest quartile. SES represented by mother’s education enters significantly for all the sleep problems but nightmares.
Table 4.
Odd Ratios for Child Sleep Quality, Separate by Type of Problem, During Overall Childhood from 18 to 115 Months (95% Confidence Interval): Main Variables.
| Refuses going to bed | Woken up early | Difficulty going to sleep | ||||
|---|---|---|---|---|---|---|
| OR [95% CI] | P-value | OR [95% CI] | P-value | OR [95% CI] | P-value | |
| Mother’s education | ||||||
| Cse/none | 1.00 | 1.00 | 1.00 | |||
| Vocational | 0.96 [0.87–1.05] | NS | 0.82 [0.75–0.90] | <.001 | 1.09 [1.00–1.20] | .06 |
| O-level | 0.73 [0.68–0.78] | <.001 | 0.7 [0.65–0.75] | <.001 | 0.98 [0.92–1.06] | NS |
| A-level | 0.61 [0.56–0.66] | <.001 | 0.65 [0.61–0.71] | <.001 | 0.92 [0.85–1.00] | .045 |
| Degree | 0.54 [0.49–0.59] | <.001 | 0.57 [0.52–0.63] | <.001 | 0.9 [0.82–0.99] | .033 |
| Material deprivation | 1.04 [1.02–1.07] | .001 | 1.06 [1.04–1.09] | <.001 | 1.02 [1.00–1.05] | .051 |
| Income quartile | ||||||
| First quartile | 1.00 | 1.00 | 1.00 | |||
| Second quartile | 0.87 [0.81–0.93] | <.001 | 0.96 [0.90–1.02] | NS | 0.99 [0.93–1.06] | NS |
| Third quartile | 0.8 [0.75–0.86] | <.001 | 0.82 [0.77–0.88] | <.001 | 0.91 [0.85–0.97] | .006 |
| Fourth quartile | 0.83 [0.77–0.90] | <.001 | 0.88 [0.81–0.95] | .001 | 0.93 [0.86–1.00] | .061 |
| N | 39731 | 39702 | 39674 | |||
| Nightmares | Continuously wakes up | Waken up after few hours | ||||
| OR [95% CI] | P-value | OR [95% CI] | P-value | OR [95% CI] | P-value | |
| Mother’s education | ||||||
| Cse/none | 1.00 | 1.00 | 1.00 | |||
| Vocational | 1.06 [0.96–1.17] | NS | 1.02 [0.93–1.12] | NS | 0.92 [0.82–1.03] | NS |
| O-level | 1 [0.92–1.08] | NS | 0.89 [0.83–0.96] | .002 | 0.7 [0.64–0.77] | <.001 |
| A-level | 0.98 [0.90–1.07] | NS | 0.89 [0.82–0.96] | .003 | 0.61 [0.55–0.68] | <.001 |
| Degree | 1.02 [0.92–1.13] | NS | 0.83 [0.75–0.92] | <.001 | 0.53 [0.46–0.60] | <.001 |
| Material deprivation | 0.99 [0.96–1.01] | NS | 1.09 [1.07–1.12] | <.001 | 1.09 [1.05–1.12] | <.001 |
| Income quartile | ||||||
| First quartile | 1.00 | 1.00 | 1.00 | |||
| Second quartile | 0.89 [0.82–0.95] | .001 | 0.91 [0.85–0.98] | .01 | 0.84 [0.77–0.92] | <.001 |
| Third quartile | 0.86 [0.80–0.93] | <.001 | 0.88 [0.82–0.94] | <.001 | 0.78 [0.71–0.86] | <.001 |
| Fourth quartile | 0.88 [0.81–0.95] | .002 | 0.93 [0.86–1.01] | .08 | 0.75 [0.67–0.83] | <.001 |
| N | 39544 | 39645 | 39660 | |||
Notes: Logistic regression models. Other controls: mother’s age, child gender, child ethnicity, first born, mother’s employment, parents’ divorced or separated, father’s education, single-adult household, no. of children in the household, a dummy for birthweight < 2500 g and a dummy for gestation week <37, maternal anxiety, sleep, and depression during pregnancy.
Mother’s anxiety and depression during pregnancy have all a negative effect on child sleep from 18 to 155 months of child’s age, with the exception of nightmares in the case of maternal depression. Maternal sleep quality during pregnancy (dummy for mother sleeping alright) also appears significant in all the models, in a positive way (compared to mothers who report not to sleep alright during pregnancy, children from mothers reporting to sleep alright have less sleep problems).
For the other covariates, we report the results in the supplementary material (Table S1). Males and first-born children are more likely to have sleep problems at almost all ages. The presence of other children in the household favors child sleep, reducing the probability of having nightmares at all ages, to have any sleep problem at almost all ages but slightly increases the probability of continuously waking up at 42 and 69 months. Mother’s age reduces child sleep problems only in the very early childhood, while it is insignificant from 42 months of age.
Sleep Quantity
Figure 2 shows the predicted sleep length (minutes per day) by material deprivation and income quartile groups and the corresponding 95% CIs over child age. Predictions are based on log-linear models for the number of hours slept, using the same set of covariate variables as in Table 3. As evident from the figure, there is no meaningful relation between sleep length and socioeconomic variables. Among the other predictors, mother’s age is the strongest determinant, with sleep quantity decreasing as the mother gets older. Child’s gender and ethnicity are also significant predictors of sleep length (see Table S2 in the supplementary material for details).
Figure 2.
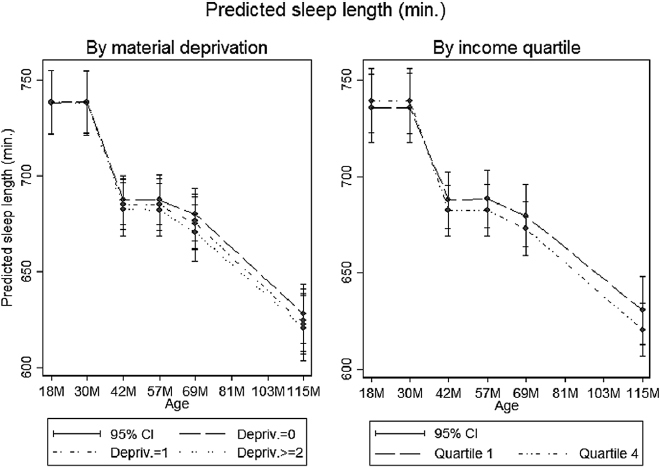
This shows the predicted sleep length (minutes per day) and corresponding 95% confidence intervals over child’s age according to the level of material deprivation and family income. The material deprivation index is split into 3 categories: families not deprived (“Depriv. = 0”), families deprived in only 1 of the 8 items (“Depriv. = 1”), and families deprived in 2 or more items (“Depriv. ≥ 2”). In relation to income, these figures show the gap between the first poorest quartile (household income lower than £250 per week) and the upper richest quartile (household income higher than £660 per week). Predicted coefficients are based on log-linear models, controlling for the following covariates: mother’s age, child gender, child ethnicity, first born, mother’s education, father’s education, mother’s employment, parents’ divorced or separated, single-adult household, number of children in the household, a dummy for birthweight <2500 g and a dummy for gestation week <37, maternal anxiety, sleep, and depression during pregnancy. The full table of coefficients is displayed in Table S2 of the supplementary material.
DISCUSSION
Exploiting a sample of nearly 14000 UK children and families, regression models are used to detect a possible relation between both absolute (material deprivation) and relative (low income quartiles) economic disadvantage and the quality and quantity of sleep in children. Results show that the socioeconomic environment is associated with child sleep quality but not with quantity. In particular, both material deprivation and the relative position of the household in the income distribution determine the likelihood of a child having at least 1 sleep problem but do not seem to exert any substantial influence on the amount of time children sleep per day. More in detail, material deprivation represents a rather significant and strong predictor of sleep quality, an impact that can be compared to the ones observed for maternal depression and anxiety.
While the quality of sleep varies across individuals, sleep length does not show any significant variability. This result is consistent with the previously published evidence.25,30 Since the quantity of sleep decreases steadily with the age of the child, a small variability implies not only that children, on average, sleep a fairly regular amount of time but also that the biological decrease in sleep length for older children follows a standard pattern in nearly all the households included in the sample.
Besides the socioeconomic variables, the mother plays a crucial role in predicting children quality of sleep. Mother’s education attainment is significantly and positively associated to the likelihood of having any sleep problem. In addition, mother’s anxiety and depression are also significant predictors of sleep quality. Since reverse causality is likely to play an important role in the correlation between the mental well-being of the mother and the sleep of the child (i.e., the mother getting depressed because the child does not sleep), the longitudinal nature of the data is exploited, and maternal anxiety and depressions are added in the models only at the pregnancy stage. Hence, the correlations resulting from the analyses can be interpreted as evidence that mother’s mental health problems transfer to child’s well-being through sleep problems, especially in the very early stages of life. Surprisingly, however, once again, sleep quantity does not show any particular sensitivity to these variables either.
The relation between child development and the SES is well established in the international literature. However, although there is a clear consensus that income and education can affect the health outcomes also at an early stage of life, questions remain over the mechanisms and the mediators through which this dynamic relation can develop.31
In principle, sleep is both determined by and a determinant of health and cognitive outcomes and stress. Studies find that relative income deprivation can generally affect health outcomes and sleep both directly or through 1 or more family-related mediating factors (i.e., family stressors).32 At the same time, the relative income situation influences the parental attitudes and behavior towards the child.33,34 This in turn can affect children health and development, and the quality of their sleep among the others. The child development literature, for example, shows that family stressors such as marital conflict, violence, or bad parenting, typically associated with low SES, increase children insecurity at primary school age and alter their sleep patterns.35 Cultural background also plays a role by influencing parents’ coping strategies to the external environment.36 While it is safe to assume that sleep disruptions might show negative impacts on outcomes, the moment in which the psychosocial environment starts affecting sleeping patterns remains to be understood. Recent literature, for example, has shown that the sleep gradient can be found already in primary school children.37,38 In this article, we offer a unique observation point, where toddlers are followed longitudinally since their very first stages in life and mothers are interviewed even before giving birth. Indeed, results show that some dimensions of the SES gradient start hitting at very young ages. Another important issue that requires further attention in the literature relates to the relevant dimensions of the social environment that are most likely to influence sleep in children. Thanks to data availability, the focus of this analysis is on the material living conditions, which are rarely observed in large-scale observational studies (and, to our knowledge, never for what concerns sleeping patterns in children).
The mechanism through which low-SES (and associated family behaviors and characteristics) will translate into worse sleep patterns remains to be identified with more certainty.39–41 As pointed out above, family behaviors and conflict can certainly represent an explanation.42 According to the economic and social epidemiology literature, however, low relative income might in itself exert a negative effect on health outcomes by increasing the level of stress and insecurity associated to the awareness of ones’ social status when compared with more affluent members of the society (e.g., relative income effect, contextual effect).39,43 Indeed, research finds that the psychophysiology and the neurobiology of stress regulation accounts for much of the difference in health outcomes between SES strata, and this could be true for sleep as well. More specifically, the childhood psychosocial environment could get “under the skin” of the children, altering the allostatic load, impairing the immune system and dysregulating the hypothalamic–pituitary–adrenal axis activity.44
This analysis has some clear strength and limitations. The large sample size makes it possible to conduct a proper statistical analysis using rarely assessed conditions (such as material deprivation) as predictors. In addition, the longitudinal nature of the data allows controlling for prebirth characteristics to avoid reverse causality with the mental well-being of the mother. However, the representativeness of the large sample used in the analysis might be questioned. Indeed, all the almost 14000 children and families where resident in a geographically limited area of the UK and were white Caucasian. Despite the precision of the data, the extent to which these results can be extrapolated to different contexts remains thus an open question. However, the fact that the sample is rather homogenous from a geographical and cultural point of view allows to better disentangle the effect of economic conditions from the cultural effects. Namely, given a certain culture, it is possible to explore the link between family SES and child sleep, which otherwise would be less clearly determined.
Finally, the analysis is mainly descriptive, i.e., it does not attempt to define the structural causal relations among the relevant variables. Further research is thus needed regarding the causes and the consequences of sleep in children. However, in light of the presented evidence, future analyses might consider the socioeconomic environment as a relevant dimension affecting sleep at the early stages of life.
SUPPLEMENTARY MATERIAL
Supplementary material is available at SLEEP online.
DISCLOSURES
The UK Medical Research Council and the Wellcome Trust (Grant ref: 102215/2/13/2) and the University of Bristol provide core support for ALSPAC.
Both authors declare no conflict of interest
Supplementary Material
ACKNOWLEDGEMENTS
We are extremely grateful to all the families who took part in this study, the midwives for their help in recruiting them, and the whole ALSPAC team, which includes interviewers, computer and laboratory technicians, clerical workers, research scientists, volunteers, managers, receptionists, and nurses. The UK Medical Research Council and the Wellcome Trust (Grant ref: 102215/2/13/2) and the University of Bristol provide core support for ALSPAC. The authors gratefully acknowledge support from the LSE Centre for Economic Performance Wellbeing Programme. Marta Barazzetta also thanks the Fonds National de la Recherche Luxembourg for financial support.
REFERENCES
- 1. Shonkoff JP, Phillips DA. From Neurons to Neighborhoods: The Science of Early Childhood Development. Washington, DC: National Academies Press; 2000. [PubMed] [Google Scholar]
- 2. Adair LS, Fall CH, Osmond C, et al. ; COHORTS group. Associations of linear growth and relative weight gain during early life with adult health and human capital in countries of low and middle income: findings from five birth cohort studies. Lancet. 2013; 382(9891): 525–534. [DOI] [PMC free article] [PubMed] [Google Scholar]
- 3. Carr CP, Martins CM, Stingel AM, Lemgruber VB, Juruena MF. The role of early life stress in adult psychiatric disorders: a systematic review according to childhood trauma subtypes. J Nerv Ment Dis. 2013; 201(12): 1007–1020. [DOI] [PubMed] [Google Scholar]
- 4. Gertler P, Heckman J, Pinto R, et al. Labor market returns to an early childhood stimulation intervention in Jamaica. Science. 2014; 344(6187): 998–1001. [DOI] [PMC free article] [PubMed] [Google Scholar]
- 5. Taylor SE. Mechanisms linking early life stress to adult health outcomes. Proc. Natl Acad Sci USA. 2010; 107: 8507–8512. [DOI] [PMC free article] [PubMed] [Google Scholar]
- 6. Heckman JJ. Skill formation and the economics of investing in disadvantaged children. Science. 2006; 312(5782): 1900–1902. [DOI] [PubMed] [Google Scholar]
- 7. Campbell F, Conti G, Heckman JJ, et al. Early childhood investments substantially boost adult health. Science. 2014; 343(6178): 1478–1485. [DOI] [PMC free article] [PubMed] [Google Scholar]
- 8. El-Sheikh M. Sleep and Development: Familial and Socio-Cultural Considerations. New York: Oxford University Press; 2011. [Google Scholar]
- 9. Astill RG, Van der Heijden KB, Van Ijzendoorn MH, Van Someren EJ. Sleep, cognition, and behavioral problems in school-age children: a century of research meta-analyzed. Psychol Bull. 2012; 138(6): 1109–1138. [DOI] [PubMed] [Google Scholar]
- 10. Buckhalt JA, El-Sheikh M, Keller PS, Kelly RJ. Concurrent and longitudinal relations between children’s sleep and cognitive functioning: the moderating role of parent education. Child Dev. 2009; 80(3): 875–892. [DOI] [PubMed] [Google Scholar]
- 11. El-Sheikh M, Kelly RJ, Buckhalt JA, Benjamin Hinnant J. Children’s sleep and adjustment over time: the role of socioeconomic context. Child Dev. 2010; 81(3): 870–883. [DOI] [PubMed] [Google Scholar]
- 12. Mindell JA, Owens JA. A Clinical Guide to Pediatric Sleep: Diagnosis and Management of Sleep Problems. Philadelphia: Lippincott Williams & Wilkins; 2015. [Google Scholar]
- 13. Knutson KL. Sociodemographic and cultural determinants of sleep deficiency: implications for cardiometabolic disease risk. Soc Sci Med. 2013; 79: 7–15. [DOI] [PMC free article] [PubMed] [Google Scholar]
- 14. Galland BC, Taylor BJ, Elder DE, Herbison P. Normal sleep patterns in infants and children: a systematic review of observational studies. Sleep Med Rev. 2012; 16(3): 213–222. [DOI] [PubMed] [Google Scholar]
- 15. Baker FC, Wolfson AR, Lee KA. Association of sociodemographic, lifestyle, and health factors with sleep quality and daytime sleepiness in women: findings from the 2007 National Sleep Foundation “Sleep in America Poll”. J Womens Health (Larchmt). 2009; 18(6): 841–849. [DOI] [PubMed] [Google Scholar]
- 16. Friedmann E, Thomas SA, Liu F, Morton PG, Chapa D, Gottlieb SS; Sudden Cardiac Death in Heart Failure Trial Investigators Relationship of depression, anxiety, and social isolation to chronic heart failure outpatient mortality. Am Heart J. 2006; 152(5): 940.e1–940.e8. [DOI] [PubMed] [Google Scholar]
- 17. Grandner MA, Patel NP, Gehrman PR, et al. Who gets the best sleep? Ethnic and socioeconomic factors related to sleep complaints. Sleep Med. 2010; 11(5): 470–478. [DOI] [PMC free article] [PubMed] [Google Scholar]
- 18. Marco CA, Wolfson AR, Sparling M, Azuaje A. Family socioeconomic status and sleep patterns of young adolescents. Behav Sleep Med. 2011; 10(1): 70–80. [DOI] [PMC free article] [PubMed] [Google Scholar]
- 19. McLaughlin Crabtree V, Beal Korhonen J, Montgomery-Downs HE, Faye Jones V, O’Brien LM, Gozal D. Cultural influences on the bedtime behaviors of young children. Sleep Med. 2005; 6(4): 319–324. [DOI] [PubMed] [Google Scholar]
- 20. Guérin N, Reinberg A, Testu F, Boulenguiez S, Mechkouri M, Touitou Y. Role of school schedule, age, and parental socioeconomic status on sleep duration and sleepiness of Parisian children. Chronobiol Int. 2001; 18(6): 1005–1017. [DOI] [PubMed] [Google Scholar]
- 21. Winsper C, Wolke D. Infant and toddler crying, sleeping and feeding problems and trajectories of dysregulated behavior across childhood. J Abnorm Child Psychol. 2014; 42(5): 831–843. [DOI] [PubMed] [Google Scholar]
- 22. Humphreys JS, Gringras P, Blair PS, et al. Sleep patterns in children with autistic spectrum disorders: a prospective cohort study. Arch Dis Child. 2014; 99(2): 114–118. [DOI] [PMC free article] [PubMed] [Google Scholar]
- 23. Freeman K, Bonuck K. Snoring, mouth-breathing, and apnea trajectories in a population-based cohort followed from infancy to 81 months: a cluster analysis. Int J Pediatr Otorhinolaryngol. 2012; 76(1): 122–130. [DOI] [PubMed] [Google Scholar]
- 24. Marmot M, Allen JJ. Social determinants of health equity. Am J Public Health. 2014; 104(Suppl. 4): S517–S519. [DOI] [PMC free article] [PubMed] [Google Scholar]
- 25. Blair PS, Humphreys JS, Gringras P, et al. Childhood sleep duration and associated demographic characteristics in an English cohort. Sleep. 2012; 35(3): 353–360. [DOI] [PMC free article] [PubMed] [Google Scholar]
- 26. Boyd A, Golding J, Macleod J, et al. Cohort Profile: the ‘children of the 90s’–the index offspring of the Avon Longitudinal Study of Parents and Children. Int J Epidemiol. 2013; 42(1): 111–127. [DOI] [PMC free article] [PubMed] [Google Scholar]
- 27. Avon Longitudinal Study of Parents and Children. http://www.bris.ac.uk/alspac/researchers/data-access/data-dictionary/ Accessed December 27, 2016.
- 28. Bossert W, Chakravarty SR. D’Ambrosio C. Multidimensional poverty and material deprivation with discrete data. Rev Income Wealth. 2013; 59: 29–43. [Google Scholar]
- 29. Whelan CT, Nolan B., Maître B. Measuring Material Deprivation in the Enlarged EU. ESRI Working Paper 2008; No. 249.
- 30. Moore PJ, Adler NE, Williams DR, Jackson JS. Socioeconomic status and health: the role of sleep. Psychosom Med. 2002; 64(2): 337–344. [DOI] [PubMed] [Google Scholar]
- 31. Berkman LF, Kawachi I, Glymour MM. Social Epidemiology. New York: Oxford University Press; 2014. [Google Scholar]
- 32. Kawachi I, Subramanian S. Income inequality. In: Berkman LF, Kawachi I, Glymour MM, eds. Social Epidemiology. New York: Oxford University Press; 2014: 126–152. [Google Scholar]
- 33. McLoyd VC. Socioeconomic disadvantage and child development. Am Psychol. 1998; 53(2): 185–204. [DOI] [PubMed] [Google Scholar]
- 34. Yeung WJ, Linver MR, Brooks-Gunn J. How money matters for young children’s development: parental investment and family processes. Child Dev. 2002; 73(6): 1861–1879. [DOI] [PubMed] [Google Scholar]
- 35. El-Sheikh M, Buckhalt JA, Mark Cummings E, Keller P. Sleep disruptions and emotional insecurity are pathways of risk for children. J Child Psychol Psychiatry. 2007; 48(1): 88–96. [DOI] [PubMed] [Google Scholar]
- 36. Jenni OG, O’Connor BB. Children’s sleep: an interplay between culture and biology. Pediatrics. 2005; 115(1 Suppl): 204–216. [DOI] [PubMed] [Google Scholar]
- 37. Zhang J, Li AM, Fok TF, Wing YK. Roles of parental sleep/wake patterns, socioeconomic status, and daytime activities in the sleep/wake patterns of children. J Pediatr. 2010; 156(4): 606–612.e5. [DOI] [PubMed] [Google Scholar]
- 38. Hanson MD, Chen E. Daily stress, cortisol, and sleep: the moderating role of childhood psychosocial environments. Health Psychol. 2010; 29(4): 394–402. [DOI] [PubMed] [Google Scholar]
- 39. Kawachi I, Kennedy BP. Income inequality and health: pathways and mechanisms. Health Serv Res. 1999; 34(1 Pt 2): 215–227. [PMC free article] [PubMed] [Google Scholar]
- 40. Marmot MG, Wilkinson RG. Social Determinants of Health. New York: Oxford University Press; 1999. [Google Scholar]
- 41. Marmot M, Allen J, Bell R, Bloomer E, Goldblatt P; Consortium for the European Review of Social Determinants of Health and the Health Divide WHO European review of social determinants of health and the health divide. Lancet. 2012; 380(9846): 1011–1029. [DOI] [PubMed] [Google Scholar]
- 42. El-Sheikh M, Kelly RJ, Bagley EJ, Wetter EK. Parental depressive symptoms and children’s sleep: the role of family conflict. J Child Psychol Psychiatry. 2012; 53(7): 806–814. [DOI] [PMC free article] [PubMed] [Google Scholar]
- 43. Wagstaff A, van Doorslaer E. Income inequality and health: what does the literature tell us? Annu Rev Public Health. 2000; 21: 543–567. [DOI] [PubMed] [Google Scholar]
- 44. Bradley RH, Corwyn RF. Socioeconomic status and child development. Annu Rev Psychol. 2002; 53: 371–399. [DOI] [PubMed] [Google Scholar]
Associated Data
This section collects any data citations, data availability statements, or supplementary materials included in this article.