

SUMMARY
A comprehensive cellular anatomy of normal human prostate is essential for solving the cellular origins of benign prostatic hyperplasia and prostate cancer. The tools used to analyze the contribution of individual cell types are not robust. We provide a cellular atlas of the young adult human prostate and prostatic urethra using an iterative process of single-cell RNA sequencing (scRNA-seq) and flow cytometry on ~98,000 cells taken from different anatomical regions. Immunohistochemistry with newly derived cell type-specific markers revealed the distribution of each epithelial and stromal cell type on whole mounts, revising our understanding of zonal anatomy. Based on discovered cell surface markers, flow cytometry antibody panels were designed to improve the purification of each cell type, with each gate confirmed by scRNA-seq. The molecular classification, anatomical distribution, and purification tools for each cell type in the human prostate create a powerful resource for experimental design in human prostate disease.
In Brief
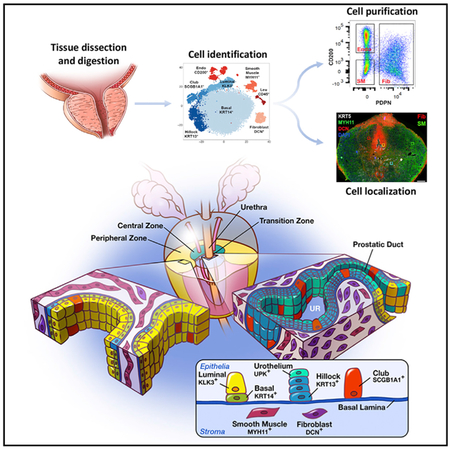
Using single-cell RNA sequencing, immunofluorescence, and flow cytometry, Henry et al. create a cellular anatomy of the normal human prostate and provide the tools to identify, isolate, and localize every cell type. They identify two additional epithelial cell types enriched in the prostatic urethra and proximal prostatic ducts.
Graphical Abstract
INTRODUCTION
The design of novel therapies against disease relies on a deep understanding of the identity and function of each cell type within an organ. A three-dimensional cellular anatomy of normal organs is necessary to better understand the processes of age-related repair and disease. These efforts have been largely driven by advances in single-cell sequencing (to identify cell type) and imaging technologies (to identify cell location). Because of the challenges with procurement of fresh normal human organs and the pronounced anatomical differences between mouse and human prostate, considerable gaps remain in our understanding of the functions of specific cell types in prostate disease.
The zonal anatomy of the human prostate was established by John McNeal using hundreds of cadaver specimens (McNeal, 1981). McNeal’s scheme divides the adult human prostate into an anterior fibromuscular zone and three glandular zones (the central zone surrounds the ejaculatory ducts, the transition zone surrounds the urethra, and the peripheral zone surrounds both). McNeal observed that benign prostatic hyperplasia (BPH) occurs mostly in the transition zone, while most prostate cancer is found in the peripheral zone. The incidence of disease in these distinct regions formed the basis for the description anatomical zones rather than cellular composition. No study has objectively examined how prostate cell types are distributed across each of McNeal’s zones, a critical step toward identifying the cellular origins of prostate cancer and BPH.
Prostate cell types have been subjectively defined by their shape, gene expression, surface antigens, and relative position in glandular acini (Shen and Abate-Shen, 2010; DeMarzo et al., 2003). These criteria have led to the notion that prostate glands contain three unique epithelial cell types: basal, luminal, and neuroendocrine (NE). Basal epithelia express cytokeratin 5 and the transcription factor p63. Luminal epithelia express cytokeratin 8 and androgen-regulated secretory proteins such as KLK3. A putative intermediate cell state between basal and luminal line-ages has been defined on the basis of shared expression of basal and luminal cytokeratins (Hudson et al., 2001; Xue et al., 1998). NE epithelia express markers such as chromogranin A (di Sant’Agnese, 1998). Various cell surface antibodies and promoters driving fluorophores in transgenic mice are used to label and isolate basal and luminal epithelia by flow cytometry, but the purity of these putative epithelial cell types has never been evaluated. A lack of established stromal cell-type surface markers has prevented their identification and isolation.
To properly define human prostate cellular anatomy and create a baseline for understanding the cellular origins of disease, we performed single-cell RNA sequencing (scRNA-seq) on ~98,000 cells from five young adult human prostates. Two unrecognized epithelial cell types were identified, and previously unknownmarkers were derived for established cell types.
scRNA-seq also revealed flaws in the traditional fluorescence-activated cell sorting (FACS) gating strategy for human prostate cell types, resulting in contaminated bulk RNA sequencing. Accordingly, we describe an improved purification scheme that includes the ability to purify stromal cell types, which had not been possible. We also used scRNA-seq to identify selective cell markers and performed immunostaining on whole trans-verse prostate sections to demonstrate regional enrichment of cell types as a means to objectively define prostate cellular anatomy in non-diseased specimens. Given the difficulty of routinely procuring young human prostate specimens, these data provide a valuable resource for establishing a molecular and cellular baseline for understanding changes in human prostate disease.
RESULTS
Bulk Sequencing of the Human Prostate Cells Sorted by FACS Suggests Impurity
Isolating pure cell populations is critical for functional analysis, yet current prostate cell purification protocols fail to achieve purity because they rely on non-specific definitions of cell identity. For example, most studies use fewer than three cell surface markers to define prostate basal and luminal cells, which forces broad assumptions of cell identity. Some groups employ a panepithelial marker (CD326, CD324, or TROP2) with a positive basal marker like CD49f, assuming that all CD49fLO epithelia are luminal (Zhang et al., 2016c). Other groups use a combination of positive basal (CD49f) and positive luminal (CD26 or CD38) markers (Liu et al., 2016b; Karthaus et al., 2014). Several other options exist for identifying basal epithelia, including Podoplanin, CD104, and CD271 (Liu and True, 2002). While most labs have historically defined basal epithelia as CD49fHI, its tri-modal spectrum of expression (high in basal epithelia and 50% of stroma, low in luminal, and negative in the other 50% of stroma) makes it difficult to objectively establish a negative gate for basal epithelial purity. We previously showed that FACS gating for CD271, CD104, and Podoplanin was superior to CD49f because it establishes a definitive boundary between marker-positive and marker-negative basal epithelia (Henry et al., 2017). Regardless of which positive marker is used to identify basal epithelia, a double-negative epithelial gate consistently emerges and has never been characterized. We set out to define this additional epithelial cell gate by comparing its transcriptome to that of basal (CD271+) and luminal (CD26+) gates.
Benign and malignant prostate diseases are widespread in aging men, resulting in a perturbation of cellular transcriptomes. To establish a baseline transcriptome for each cell type, we created a fresh tissue biorepository of prostates from young organ donors aged 18–31. Prostates were dissected and enzymatically dissociated into single-cell suspensions (Figure S1). Viable cells from each gated epithelial population (basal, luminal, or other) were collected via FACS according to our previously published protocol (Henry et al., 2017). To determine transcriptomic differences among luminal, basal, and other epithelia gates, cDNA libraries from a bulk population of cells from each FACS gate were prepared for sequencing (GEO: GSE120716) (Figure 1A). Principal-component analysis demonstrates concordance of gated epithelial cells across four normal specimens, a testament to the consistency of our approach (Figure S2A).
Figure 1. Identification of Human Prostate Cell Clusters with Bulk and Single-Cell RNA Sequencing.

(A) Schematic of human tissue collection and processing for bulk and single-cell RNA sequencing.
(B) Aggregated single-cell RNA sequencing (scRNA-seq) data from three organ donor prostate specimens with subclustering into stroma, epithelia, and unknown lineages based on correlation with bulk sequencing data (Figure S2). Clusters were identified and re-merged.
(C) Dot plot of cluster-specific genes after in silico removal of stressed cells and supervised identification of neuroendocrine epithelia.
The stromal gate includes all cells negative for CD326 (pan-epithelia), CD45 (pan-leukocyte), and CD31 (endothelia). We bulk sequenced the triple-negative stromal gate from each patient to generate epithelial-specific differentially expressed gene (DEG) sets for each epithelial population (Figures S2B and S2C). Gene set enrichment analysis (GSEA) was performed to compare DEGs in our dataset to other datasets of sorted prostate cells (Zhang et al., 2016c; Liu et al., 2016b; Oudes et al., 2006). Luminal (CD26+) and basal (CD271+) epithelial transcriptomes from our study were highly concordant with those from other studies (Figure S2D).
Familiar DEGs genes such as KRT5, KRT14, and TP63, as well as lesser known genes such as NOTCH4, LTBP2, and DKK1, characterize CD271+ basal epithelia. The CD26+ luminal epithelia are marked by familiar DEGs such as KLK3, ACPP, and MSMB, as well as lesser-known genes, including GP2, NEFH, and NPY. Principal-component analysis shows that the transcriptome of CD271−/CD26− (other) epithelia resembles that of CD271+ basal epithelia (Figure S2A). However, several of the top other epithelia DEGs include classic neuroendocrine line-age markers such as CHGA and CHGB and unknown markers such as LY6D, SCGB3A1, and PSCA. Twenty significant DEGs in the three epithelial and one stromal gate are shown in Figure S2E. Table S1 includes the full list of cell type-specific DEGs.
Many significant DEGs in the other epithelial gate are putative neuroendocrine cell markers, but the high frequency of cells in this gate argues against a pure population of neuroendocrine cells given their low frequency in situ. Before we could identify whether each FACS gate contained a heterogeneous population of cells, we employed scRNA-seq to establish an objective identity of each cell type.
Single-Cell Sequencing of the Normal Human Prostate Reveals Unbiased Cellular Identities
Prostate specimens from 3 young male organ donors aged 18–31 were collected fresh, dissected, and digested into single cells. Single-cell suspensions were then stained and sorted for viability by flow cytometry. Approximately 34,000 viable cells from each of the 3 specimens were loaded into a 10× Genomics Chromium controller for transcript barcoding (Figure 1A). After aggregating data from each specimen, 35,865 cells were barcoded with a normalized read depth of 22,729 per cell and an average of 1,356 genes detected per cell. Table S2 provides the sequencing metrics for each sample (GEO: GSE120716).
We clustered the single-cell transcriptomes with a modified version of the Seurat R pipeline (Butler et al., 2018) (see STAR Methods). The artifact of cellular stress created by dissociating solid tissues into single-cell suspensions is an unavoidable issue that can be mitigated by the removal of affected cells before sequencing or in silico (van den Brink et al., 2017). To identify and remove stressed cells from the analysis in silico, we built a bioinformatics tool based on a principle-component analysis of an experimentally derived stress signature, which detected stressed cells in nearly every cluster (Figure S3). A prostate-specific stressed cell DEG list was subsequently derived and deployed to exclude stressed cells in future analyses (Table S3). After ~10% of the total cells were removed due to a high stress signature, a t-distributed stochastic neighbor embedding (tSNE) plot of the remaining 28,606 non-stressed cells revealed eight clusters (Figure 1B). DEGs were generated for each cluster in Seurat for assigning identity.
To quantitatively assign the cellular identity of each cluster, we performed QuSAGE GSEA (Yaari et al., 2013). We first defined epithelial and stromal lineages by correlating the cluster transcriptomes to our bulk sequencing data (Figure S4A). Once the broad lineages were identified (epithelia and stroma), each line-age was subclustered and re-clustered for deeper identification. Prostate-specific fibroblast and smooth muscle transcriptomes had not previously been generated due to the inability to isolate these cell types. We therefore used four stromal cell gene ontology terms (muscle, fibroblast, endothelia, and leukocyte) to characterize stromal subclusters (Figure S4B). We then used bulk-sorted prostate epithelial cell transcriptomes (CD26+, luminal; CD271+, basal; and CD26−/CD271−, other) to identify epithelial subclusters (Figure S4C). As shown in Figure 1B, clusters 2, 3, 7, and 8 were highly correlated with bulk-sequenced stroma and identified as endothelia, fibroblasts, smooth muscle, and leukocytes, respectively (see STAR Methods) (Figure S4B). Clusters 1, 4, 5, and 6 were highly correlated with bulk-sequenced epithelia. Cluster 5 displayed the highest correlation with bulk-sequenced basal epithelia (BE). Clusters 1 and 6 most resembled the double-negative (CD26−/CD271−) “other epithelia” (OE) gate and were tentatively assigned labels OE1 and OE2. Cluster 4 displayed the highest correlation with bulk-sequenced luminal epithelia (LE) (Figure S4C). Figure 1C displays a dot plot of the top five cluster-enriched DEGs to highlight specificity for each cluster. A full list of genes filtered for cell type-specific expression for each cluster is shown in Table S3.
Neuroendocrine (NE) cells are a rare prostate epithelial type in situ (di Sant’Agnese, 1998). We did not identify a unique neuroendocrine cell cluster in the 24,450 sequenced prostate epithelial cells even when increasing the read depth to 75,000 reads/cell (the effect of read depth on cluster identification can be seen in Figure S5). Because a complete normal NE cell transcriptome has yet to be generated, we relied on a small number of putative marker genes to identify NE cells by a principle-component-based approach (see STAR Methods). We then developed a NE cell score, identified 25 putative NE cells, and created a detailed DEG list for future analyses (Figures S6A–S6C; Table S3). A marker gene for NE cells that was discovered in our dataset (SCG2) was tested in combination with a known NE cell marker (CHGA) and confirmed in situ (Figure S6D). Several NE cells were labeled with either SCG2 or CHGA, suggesting potential NE cell heterogeneity. As shown below, scRNA-seq of individual FACS gates confirmed that NE cells are labeled by both basal and luminal epithelial cell surface markers.
Single-Cell Sequencing Data Improves FACS of Human Prostate Cell Types
With each cell type identified objectively by its transcriptome, we turned our attention to whether our current approach to isolating each of these cell types could be improved. The capture of multiple cell types in an individual flow cytometry gate diminishes the interpretation of outcomes in ex vivo experiments on cell type-specific function. To calculate the purity of our traditional flow cytometry gates (Figure 2A) (Henry et al., 2017), we uniquely bar-coded cells from each FACS gate using a single specimen and then aggregated the data. Figure 2B demonstrates the cell types present in each FACS gate, which is quantitated in Figure 2C. The fibromuscular stroma (FMSt) gate was 69% fibroblasts and smooth muscle, with 28% endothelial contamination. The basal epithelia (BE) gate was largely homogeneous, consisting of 91% BE cells. The luminal epithelia (LE) gate was highly contaminated, with OE1 cells at only 57%, and the other epithelia (OE) gate contained 45% BE cells, 21% OE1 cells, and 32% OE2 cells.
Figure 2. Optimization of Flow Cytometry for Purification of Stromal and Epithelial Subtypes.

(A) Standard flow cytometry strategy for purification of prostate stroma and epithelial subtypes.
(B) Barcoding of cells from traditional FACS gates shows breakdown of cell types within each gate.
(C) Quantification of cells within barcoded FACS gates.
(D) (Left) CD200 labels 93% of endothelia that CD31 labels. (Right) Podoplanin (PDPN) and CD200 separate endothelia (CD200+), fibroblasts (PDPN+), and smooth muscle (PDPN−).
(E) PSCA was identified as a potential cell surface marker capable of isolating other epithelial cells after CD26+ luminal epithelia are removed.
(F) scRNA-seq of modified FACS gates on a new organ donor prostate specimen is used to demonstrate the increased purity of isolated stromal and epithelial cell types compared to traditional gates in (A)–(C).
These data are quantitated in (G).
We increased the purity of FACS gated cells by using the scRNA-seq dataset to identify improved cell surface markers. The primary contamination in the FMSt is endothelia, leading us to conclude that CD31 is an inefficient endothelial marker in human prostate, even though it is widely used as such in mouse and human studies. To find a suitable replacement, we searched the endothelial cell cluster DEGs for a cell surface marker more inclusive than CD31 (PECAM1). CD200 is expressed in most clustered endothelial cells (Figure 2D), and an antibody with multiple conjugation options is commercially available. Co-staining of human prostate single cells with CD31 (BV421) and CD200 (PE) reveals that 91% of CD31+ cells co-label with CD200 (Figure 2D), which led us to replace CD31 with CD200. We also searched the scRNA-seq dataset for a cell surface marker capable of separating fibroblasts from smooth muscle, which has not been feasible. After testing multiple options, Podoplanin (PDPN) was found to robustly label fibroblasts. Dual labeling of the CD45−/CD326− stromal gate with CD200 and PDPN shows three distinct gates on flow cytometry: CD200+ endothelia, PDPN+ fibroblasts, and CD200−/PDPN− smooth muscle (Figure 2D).
We next optimized a strategy for isolating pure epithelial cell types. The two most impure epithelial FACS gates are CD26+ LE (contaminated with OE1) and the double-negative (CD26−/CD271−) other epithelia gate (contaminated with BE). Finding a positive marker for non-basal, non-luminal other epithelia solves both issues. Accordingly, we mined scRNA-seq data to identify an improved cell surface antigen to separate basal, luminal, and other epithelia by FACS. After testing several options, PSCA was identified in the cluster-specific DEGs as a potential cell surface marker of both OE cell types (as well as a subpopulation of LE) (Figure 2E). Flow cytometry with a PSCA antibody indicated that ~50% of the CD26+ LE were PSCA+ (data not shown), which necessitated the gating of PSCA+/CD26+ LEs before the gating of PSCA+ OE. PDPN was used to mark BE, which we previously showed largely overlaps with CD271 (Henry et al., 2017). As shown in Figure 2E, using PDPN for FACS gating of BE instead of CD271 is based on how it can also be used to isolate the two stromal cell clusters (Figure 2D), thereby reducing the compensation issues associated with larger antibody panels.
To determine whether this optimized FACS scheme was superior to the traditional approach for purifying stromal (CD200+ endothelia and CD200− FMSt) and epithelial (PDPN+ BE, CD26+ LE, and PSCA+ OE) cells, we performed single-cell sequencing on each optimized gate using a new young human prostate specimen (Figure 2F). First, we demonstrate increased purity of the FMSt population from 69% to 93% by reducing endothelial cell contamination (Figures 2F and 2G). Next, we improved purity of LE cells from 57% to 70% by reducing OE1 contamination. Purity of the BE gate (CD326+/CD26−/PDPN+) was improved from 91% to 99% and purity of the new OE gate (CD326+/CD26−/PDPN−/PSCA+) was 94% for OE1 and OE2 cells compared to 53% in the original CD326+/CD26−/CD271−gate (Figure 2C). The triple-negative (CD26−/PSCA−/PDPN−) CD326+ epithelial gate contained 84% BE and 13% OE2 cells not captured by PDPN and PSCA (Figure 2G). In summary, this improved antibody panel (CD45/CD326/CD200/CD26/PDPN/PSCA) for FACS gating will be instrumental in the functional characterization of purified human prostate epithelial and stromal cell types.
Identification and Isolation of Prostate Stromal Cell Subtypes
We next focused on classifying stromal cell-type identities by subclustering 4,156 stromal cells (endothelia, FMSt, and leukocytes) from three young organ donor prostate specimens (Figure 3A). DEGs were generated for stromal subclusters (Figure 3B). The putative smooth muscle cluster expressed high levels of actin (ACTA2) and myosin (MYH11, MYL9, and TPM2) genes, while the putative fibroblast cell type expressed high levels of paracrine signaling factors such as growth factors (FGF2 and FGF7), prostaglandins (PTGDS and PTGS2), and WNT pathway regulators (RSPO3 and SFRP2). We used FACS to isolate PDPN−and PDPN+ stroma, as well as CD200+ endothelia, from 3 separate young organ donor prostate specimens and performed qPCR on known and previously unrecognized cluster-specific DEGs to confirm the scRNA-seq data. The results demonstrate selective expression for each DEG in smooth muscle, fibroblasts, and endothelia (Figure 3C). Leukocytes were too low in these normal specimens to sort out sufficient numbers for qPCR and were therefore excluded from the comparison. To gain a better understanding of prostate cellular function, stromal subcluster transcriptomes were used to run QuSAGE against C2 curated gene sets from MSigDB (Subramanian et al., 2005; Liberzon et al., 2011) (Table S4). Ten top pathways of the Kyoto Encyclopedia of Genes and Genomes (KEGG) subset (Ogata et al., 1999) of C2 pathways are displayed for smooth muscle and fibroblast cell types in Figure 3D. Fibroblasts show high enrichment for protein export, suggesting a putative paracrine function, and smooth muscle shows enrichment of contraction and metabolism pathways. Finally, we tested antibodies for immunohistochemical detection of each cell type in situ and found that Myosin 11 (MYH11) and Decorin (DCN) are enriched in smooth muscle and fibroblast cell types, respectively, in human prostate tissue (Figure 3E).
Figure 3. Identification and Isolation of Pure Stromal Subtypes in the Normal Human Prostate.

(A) scRNA-seq data aggregated from three normal prostate specimens subclustered into the stromal lineage.
(B) Heatmap of the top 100 differentially expressed genes in each stromal subcluster with highlighted DEGs, suggesting putative identities.
(C) qPCR of FACS-isolated stromal subtypes from three organ donor prostate specimens demonstrates the enrichment of cell type-specific DEGs.
(D) Gene set enrichment analysis (GSEA) of non-endothelial stromal populations compared to KEGG pathways.
(E) Immunofluorescent labeling of smooth muscle (MYH11), fibroblasts (DCN), and basal epithelia (KRT5).
*p ≤ 0.05; Scale bar, 100 μm. qPCR data are represented as mean ± SEM. Statistical significance of qPCR data was calculated by t test.
Identification and Isolation of Epithelial Cell Subtypes
We next objectively defined epithelial cell-type identities by sub-clustering the 24,450 epithelial cells from three organ donor specimens. DEGs of each cluster confirm four epithelial cell types (luminal KLK3+, basal KRT14+, OE1 SCGB1A1+, and OE2 KRT13+) (Figures 4A and 4B). Viable NE epithelia were too infrequent to cluster independently and were detected through principle-component analysis (see STAR Methods) (Figure S5). We confirmed the gating scheme for isolating CD26+ luminal, PDPN+ basal, and PSCA+ other epithelia shown in Figure 2E by performing qPCR on known and previously unrecognized cluster-specific DEGs (Figure 4C).
Figure 4. Identification and Isolation of Pure Epithelial Subtypes in the Normal Human Prostate.

(A) scRNA-seq data aggregated from three normal human prostate specimens subclustered into the epithelial lineage.
(B) Heatmap of the top 100 differentially expressed genes in each epithelial subcluster with highlighted DEGs.
(C) qPCR of FACS-isolated epithelial subtypes from three organ donor prostate specimens demonstrates the enrichment of cell type-specific DEGs.
(D) GSEA of four human prostate epithelial cell types compared to mouse lung epithelial cell types.
(E) KEGG pathways enriched in epithelial cell types.
(F) Immunofluorescent labeling of basal epithelia (KRT5), luminal epithelia (DHRS7), club epithelia (SCGB1A1), and hillock epithelia (KRT13).
*p ≤ 0.05; Scale bar, 50 μm. qPCR data are represented as mean ± SEM. Statistical significance of qPCR data was calculated by t test.
SCGB proteins, or secretoglobins, are highly expressed by respiratory tract club cells (Hong et al., 2001), but they have also been detected in human prostate (Manyak et al., 1988). To determine whether SCGB1A1+ prostate epithelia are transcriptionally similar to lung club cells, we performed QuSAGE with our human prostate epithelial scRNA-seq data compared to a scRNA-seq dataset from mouse lung epithelia (Montoro et al., 2018) (Figure 4D). These data demonstrate a strong correlation between SCGB1A1+ prostate epithelia and lung Scgb1a1+ club cells, as well as lung Krt13+ hillock cells. KRT5+/KRT13+ prostate epithelia display a strong positive correlation with lung Krt5+ basal and Krt13+ hillock cells. KRT5+/KRT14+ prostate BE are highly correlated with lung Krt5+ basal cells. KLK3+ prostate LE are not strongly correlated with any mouse lung cell types, but they were correlated with lung AT2 secretory cells in a human scRNA-seq lung dataset (Treutlein et al., 2014) (data not shown).
To better understand potential functions for each cell type, epithelial subcluster transcriptomes were used to run QuSAGE against C2 curated gene sets from MSigDB (Subramanian et al., 2005; Liberzon et al., 2011) (Table S4). Ten top pathways of the KEGG subset (Ogata et al., 1999) of C2 pathways are displayed for each cell type in Figure 4E. KEGG pathways significantly correlated with luminal KLK3+ epithelia include lipid and steroid metabolism, while KRT14+ BE significantly correlated with proteasome, ribosome, and amino acid metabolism pathways. SCGB1A1+ and KRT13+ other epithelial cell types both displayed a strong correlation with immunomodulatory pathways. A full list of epithelial cell type-specific DEGs is provided in Table S3.
As shown in Figure 4F, we optimized immunohistochemical detection protocols for each cell type in situ and found that KRT14+ BE are low in KRT13 and represent a subpopulation of KRT5+ BE. DHRS7 was an undiscovered gene detected in KLK3+ LE and marks a portion of KRT18+ LE. SCGB1A1 positively marks a small population of KRT5− luminal-like prostate epithelia. Finally, KRT13+ epithelia co-express KRT5, confirming GSEA showing a positive correlation with basal cells of the lung (Figure 4D). These data establish distinct KRT5+ BE cell types that are discriminated by co-staining with KRT14 or KRT13.
Club and Hillock Epithelial Cell Types Are Enriched in the Urethra and Peri-urethral Prostate Zones
Benign and malignant prostate diseases are largely restricted to the proximal transition zone and the distal peripheral zone, respectively (De Marzo et al., 2007). A deeper understanding of prostate cellular anatomy may shed light on why these diseases predominate in distinct regions. After characterizing the molecular identity of human prostate stromal and epithelial cell types, we examined whether they are differentially distributed across anatomical zones. Accordingly, we dissected the proximal transition and central zones from the distal peripheral zone as shown in Figure 5A. For two specimens, each anatomical zone was digested into single cells, sorted for viability, and processed for scRNA-seq. To determine the natural incidence of each cell type in each anatomical zone, we superimposed the cells in each zone onto the aggregated data. Quantification of the results revealed that the transition and central zones are enriched for SCGB1A1+ (OE1) and KRT13+ (OE2) epithelia but that LE are low (Figure 5B). To confirm these data, we performed flow cytometry with our optimized antibody panel to quantitate the number of PSCA+ other epithelia in transition zone and central zone (TZ/CZ) versus peripheral zone (PZ) from 5 more young organ donor specimens (Figure 5C) (Key Resources Table). Quantification of the FACS data confirmed that PSCA+ other epithelia are enriched as a percentage of epithelia in the transition and central zones, while CD26+ LE are enriched as a percentage of epithelia in the peripheral zone (Figure 5D).
Figure 5. Anatomical Location of Epithelial and Stromal Cell Types in the Normal Human Prostate.

(A) Transition and central zones of the prostate were dissected away from the peripheral zone from three young organ donors for scRNA-seq (pre-dissected tissue inset).
(B) Quantification of scRNA-seq-identified cell types after segregation by anatomical zone from 3 patients’ aggregated data.
(C) Representative FACS analysis of epithelia from transition and peripheral zone tissue from five young organ donors after segregation by anatomical zone.
(D) Quantification of FACS data on zonal enrichment of cell types.
(E) Immunofluorescence of prostate whole-mount sections displays enrichment of club and hillock epithelial cell types in the central and transition zones and the urethra and a concentration of fibroblasts in the peri-urethral and central zone regions.
*p ≤ 0.05; Scale bar, 100 μm. Statistical significance of scRNA-seq (A) and flow cytometry (B) data was calculated by t test.
KEY RESOURCES TABLE
| REAGENT or RESOURCE | SOURCE | IDENTIFIER |
|---|---|---|
| Antibodies | ||
| Anti-CD31 (clone WM59) BV421 | Biolegend | Cat#303123; RRID: AB_2562179 |
| Anti-CD26 (clone BA5b) APC | Biolegend | Cat#302709; RRID: AB_10913814 |
| Anti-CD271 (clone ME20.4) PE | Biolegend | Cat#345105; RRID: AB_2282827 |
| Anti-CD326 (clone EBA-1) BB515 | BD | Cat#565398; RRID: AB_2728107 |
| Anti-CD45 (clone HI30) PerCP/Cy5.5 | Tonbo | Cat#65–0459; RRID: AB_2621897 |
| Anti-CD200 (clone OX-104) BV711 | Biolegend | Cat#329223; RRID: AB_2715823 |
| Anti-PDPN (clone NC-08) PE | Biolegend | Cat#337004; RRID: AB_1595554 |
| Rabbit anti-PSCA | Abcam | Cat#Ab64919; RRID: AB_1142338 |
| Donkey anti-rabbit IgG BV421 | Biolegend | Cat#406410; RRID: AB_10897810 |
| Chicken anti-KRT5 | Biolegend | Cat#905901; RRID: AB_2565054 |
| Anti-MYH11 (clone MYH11/923) | LS Bio | Cat#LS-C390741–100; RRID: AB_2728109 |
| Rabbit anti-Decorin | Sigma Aldrich | Cat# HPA003315; RRID: AB_1078639 |
| Rabbit anti-DHRS7 | Sigma Aldrich | Cat#HPA031121; RRID: AB_10600803 |
| Guinea pig anti-KRT8/18 | Fitzgerald | Cat#20R-CP004; RRID: AB_1284055 |
| Anti-KRT14(clone LL002) | Thermo Scientific | Cat#ms-115-p0; RRID: AB_63786 |
| Anti-KRT13 (clone EPR3671) | Abcam | Cat#ab92551; RRID: AB_2134681 |
| Anti-SCGB1A1 (clone 394324) | Novus Biologicals | Cat# MAB4218-SP; RRID: AB_2183286 |
| Anti-CHGA (clone CHGA(419)) | Sigma Aldrich | Cat#SAB4200728; RRID: AB_2728111 |
| Rabbit anti-SCG2 | Sigma Aldrich | Cat#HPA011893; RRID: AB_1856656 |
| Goat anti-chicken Alexa488 | Jackson Immunoresearch | Cat#103-545-155; RRID: AB_2337390 |
| Goat anti-mouse Alexa546 | Thermo Scientific | Cat#A11030; RRID: AB_2534089 |
| Goat anti-rabbit Alexa633 | Thermo Scientific | Cat#A21070; RRID: AB_2535731 |
| Goat anti-rabbit Alexa594 | Jackson Immunoresearch | Cat#111-516-045; RRID: AB_2728112 |
| Goat anti-guinea pig Alexa647 | Jackson Immunoresearch | Cat#106-605-003; RRID: AB_2337446 |
| Biological Samples | ||
| Donor 1, Age 31, prostate weight 23 g Used in Figures 1B, 2A–2C, and 5 | Southwest Transplant Alliance | N/A |
| Donor 2, Age 25, prostate weight 15 g Used in Figures 1B, 2A–2C, and 5 | Southwest Transplant Alliance | N/A |
| Donor 3, Age 29, prostate weight 20 g Used in Figures 1B, and 5 | Southwest Transplant Alliance | N/A |
| Donor 4, Age 18, prostate weight 16 g Used in Figures 3C and 4C | Southwest Transplant Alliance | N/A |
| Donor 5, Age 18, prostate weight 18 g Used in Figures 3C and 4C | Southwest Transplant Alliance | N/A |
| Donor 6, Age 19, prostate weight 17 g Used in Figures 3C and 4C | Southwest Transplant Alliance | N/A |
| Donor 7, Age 19, prostate weight 18 g Used in Figures 5C and 5D | Southwest Transplant Alliance | N/A |
| Donor 8, Age 24, prostate weight 15 g Used in Figures 5C and 5D | Southwest Transplant Alliance | N/A |
| Donor 9, Age 21, prostate weight 17 g Used in Figures 5C and 5D | Southwest Transplant Alliance | N/A |
| Donor 10, Age 18, prostate weight 18 g Used in Figures 5C and 5D | Southwest Transplant Alliance | N/A |
| Donor 11, Age 22, prostate weight 14 g Used in Figures 5C and 5D | Southwest Transplant Alliance | N/A |
| Deposited Data | ||
| Bulk and single cell sequencing of human prostate cells | GEO database | GSE120716 |
| All raw data | GUDMAP database | https://doi.org/10.25548/W-R8CM |
| Oligonucleotides | ||
| see Table S5 | This paper | N/A |
| Software and Algorithms | ||
| R code for scRNA-seq analysis | Strand Lab | https://git.biohpc.swmed.edu/StrandLab/sc-TissueMapper_Pr |
To confirm these trends in situ, we performed triple immunofluorescence with markers of each cell type on whole transverse sections of the normal human prostate by collecting tiled images and stitching them together. KRT5+/KRT14−/KRT13+ hillock epithelial cells are abundant in the prostatic urethra and collecting ducts, as well as the central zone surrounding the ejaculatory ducts, but are rare in the peripheral zone (Figure 5E). KRT5−/KRT8−/SCGB1A1+ club cells are abundant in the prostatic urethra and collecting ducts but are rare in the prostate. Fibroblasts are common in the pre-prostatic region surrounding the urethra, anterior FMSt (AFMS), and the transition and central zones. Smooth muscle is the predominant peripheral zone stromal cell type.
The anatomical distribution of particular stromal and epithelial cell types in the proximal (transition and central zones) and distal (peripheral) prostate could underlie the regional incidence of benign and malignant diseases. Because both diseases have been suggested to arise from putative stem cells, the lineage hierarchy of the mouse and human prostate has been studied extensively. Multipotent progenitor cells of the primitive urethra and proximal prostatic ducts give rise to prostate buds early in development (Timms et al., 1994) and prostate glands in the adult (Moad et al., 2017), respectively, but their identity is incompletely understood. We performed pseudotime analysis (Trapnell et al., 2014) to build single-cell trajectories and thus gain a better understanding of the dynamical relationships among club, hillock, basal, and luminal cell types. Pseudotime analysis in Figure S7 demonstrates a diversion of luminal and club and hillock cell types from basal cells, which may be analogous to the hierarchy of the lung, where a multipotent Krt5+ basal epithelial cell gives rise to all differentiated cell types, while club and hillock cells are more restricted progenitors (Montoro et al., 2018).
DISCUSSION
The cellular origins of BPH (Strand et al., 2017) and prostate cancer (Xin, 2013) are still unknown. To understand how cellular composition and cell type-specific gene expression change in disease, a proper control must be set. Routine access to normal adult human specimens is limited, so alternative controls such as normal adjacent areas of diseased specimens have been substituted without regard for field defect (Yang et al., 2013). We present here an objective characterization of the molecular identity and location of each cell type in the normal adult human prostate, as well as a validated experimental tool to isolate pure cell types.
Cell identity has historically been based on a small set of marker genes. Most lineage tracing- or flow cytometry-based studies rely on a single marker to define cell type. scRNA-seq has revolutionized the idea of cell identity by providing an unbiased genetic signature across a set of cells (Grün and van Oudenaarden, 2015). Using scRNA-seq, we derived a molecular identity of 5 epithelial cell types and 2 stromal cell types in young adult human prostate (Figure 1). These data were then used to find optimal cell surface markers for enriching defined cell types by FACS and to develop immunostaining protocols for genes that uniquely identify each cell type in situ (Figures 2, 3, 4, and 5). The results confirmed the existence of previously described prostate stromal cell types (fibroblast and smooth muscle) and previously described prostate epithelial cell types (basal, luminal, and neuroendocrine). However, we expanded our understanding of the identity, spatial location, and putative function of each cell type by providing a comprehensive transcriptomic signature. These data also led to the discovery of two previously unrecognized epithelial cell types marked by high expression of SCGB1A1 and KRT13 with an anatomical enrichment in the prostatic urethra and proximal prostatic ducts.
Prostate SCGB1A1+ cells are similar in morphology and transcriptomic profile to Clara, or club, cells (Figure 4D) (Montoro et al., 2018), which account for ~20% of the epithelial lining of the respiratory tract and are concentrated in the proximal trachea (Treutlein et al., 2014). Club cells are a non-ciliated, non-mucous, cuboidal secretory cell type that expresses anti-microbial, anti-viral, and anti-inflammatoryproteins (Rawlins et al., 2009). Although SCGB1A1 was previously shown to be expressed in the human prostate when examining whole-tissue extracts (Manyak et al., 1988), it was not known to be a marker of a unique cell type. Prostate club cells are similar to lung club cells in their enrichment of immunomodulatory programs (Figure 4; Table S4), but their function in the prostate or prostatic urethra has not been tested.
Prostate KRT13+ cells are similar in morphology and transcriptomic profile to hillock basal cells of the lung (Montoro et al., 2018). Prostate hillock cells are also concentrated in the prostatic urethra and proximal prostatic ducts (Figure 5). Cells with KRT13 expression were previously shown to be rare in the adult prostate but abundant in fetal prostate, although it is unclear whether hillock cells populate the fetal urogenital sinus. KRT13+ cells are enriched in localized prostate tumors and in stem-like cells that display androgen resistance and a capacity for branching morphogenesis (Liu et al., 2016a). The top genes associated with the KRT13+ cell type are members of the androgen metabolism pathway (AKR1C1 and AKR1C2), which have been implicated in the development of castrate-resistant prostate cancer (Zhang et al., 2016a). Until now, it has been assumed that KRT13 expression in prostate disease was simply increased in basal or luminal cell types. These data suggest an intriguing hypothesis that a hillock cell type may be enriched in tumors.
Lung club and hillock cells can also act as progenitors for differentiated cell types (Hong et al., 2001; Rawlins et al., 2009; Montoro et al., 2018). Prostate club and hillock cells express high levels of PSCA (Figure 2). PSCA+ cells are enriched in prostate cancer (Reiter et al., 1998), but their full identity has not been firmly established. This is important because half of prostate LE also express PSCA (Figure 2E). PSCA+ epithelial progenitors are also enriched in the proximal (peri-urethral) prostate of the mouse (Tsujimura et al., 2002; Goto et al., 2006), but this had not been confirmed in humans due to notable anatomical differences between mouse and human prostate (Timms, 2008; Kwon et al., 2016b). These anatomical similarities could be confirmed if functional analyses show that prostate PSCA+ club and hillock cell types display multipotency, as is found in the proximal lung (Montoro et al., 2018).
Club and hillock epithelial cell types could also play a role in BPH. The prostate buds off the urethra during development and subsequently undergoes branching morphogenesis into a ductal tree (Cunha and Lung, 1978; Georgas et al., 2015; Timms et al., 1994). The adult human prostate displays 25–30 independent ductal structures that connect separately to the urethra (McNeal, 1968). Clonal mapping of the human prostate shows that 95% of the progenitors that produce proximal to distal clones are found in the main trunks of these juxta-urethral ducts (Moad et al., 2017). Using laser capture microdissection of the juxta-urethral trunk versus distal prostate glands, Moad et al. proposed that bipotent BE progenitors are enriched at the proximal prostate-urethral junction and are largely responsible for the homeostasis of the adult prostate epithelium (Moad et al., 2017). The comprehensive cellular atlas produced here shows that the urethra and proximal ductal trunks of the prostate are predominantly composed of club and hillock cells (Figure 5). The characterization of marker genes and cell surface antigens capable of identifying these cell types in situ and purifying them for ex vivo study should facilitate the determination of whether these cells can also act as progenitors in normal epithelial homeostasis or whether they can act as progenitors in a putative stem cell disease, such as BPH (Isaacs, 2008).
Human tissue research relies on the isolation of cell types with cell surface markers, but the purity of the gated cells has only been inferred from bulk transcriptomic analysis, which can conceal impurities through averaged gene expression. By identifying cellular subpopulations within FACS gates with scRNA-seq, we demonstrate that the purity of traditional gating schemes could be improved (Figure 2).
The gating of BE with either CD271 or PDPN produces >91% purity. Our previous work shows that most of these basal markers overlap and can be used interchangeably (Henry et al., 2017). The initial gating of LE with CD26 yielded a surprisingly low purity at 57%, largely because of contamination with SCGB1A1+ club cells (Figures 2A–2C). This gate was likely drawn too strictly, failing to account for spreading after the addition of antibody. However, this observation led to the realization that the CD38lo (likely the same as CD26lo) luminal cells described by Liu et al. are likely enriched with SCGB1A1+ club cells, supported by the high enrichment score seen when comparing the CD38lo transcriptome with the CD26−/CD271− other epithelia bulk transcriptome (Figure S2D) (Liu et al., 2016b). This raises the intriguing possibility that the expansion of CD38lo cells near sites of inflammation may be an expansion of club cells, which display anti-inflammatory and regenerative activity in the damaged lung (Rawlins et al., 2009). Traditionally, the epithelial cell phenotype that expands during inflammation or injury has been described as an intermediate cell type enriched for expression of KRT19 and sharing expression of luminal (KRT18) and basal (KRT14) cell types (van Leenders et al., 2003; Hudson et al., 2001). However, various forms of stress, such as luminal anoikis, inflammation, or obesity, can drive multipotent basal progenitors to give rise to luminal epithelia in the adult (Kwon et al., 2014, 2016a; Toivanen et al., 2016). Comparing the comprehensive dataset generated here to a murine single-cell dataset will facilitate the tracing of definitive line-ages to determine whether the response to injury is an expansion of a particular cell type, a transition between cell states, or both.
In addition to dramatically improving the isolation of each epithelial cell type, we demonstrate the ability to isolate pure populations of prostate stromal cell types. The first step toward this achievement was the recognition that the stromal gate was severely contaminated with endothelia due to the poor performance of the CD31 cell surface antibody. We first noted the contamination in our bulk sequencing of stroma, which displayed a high number of endothelial genes in the top DEGs (Figure S2). Our first scRNA-seq experiment confirmed a 29% endothelial cell contamination of the stroma and revealed CD200 as a potentially superior marker. The replacement of CD31 with CD200 improved the purity of the stromal gate from 69% to 93% (Figure 2). scRNA-seq also revealed PDPN as a positive marker of fibroblasts, which was used again on optimized FACS gates to confirm 91% purity of PDPN+ fibroblasts and 93% purity of PDPN− smooth muscle (Figures 3F and 3G).
Previous studies have suggested the existence of at least four stromal cell types in the mouse prostate based on morphology, anatomical position, and expression of individual markers, including a population of interstitial fibroblasts marked by Gli1 (Peng et al., 2013). A deeper analysis of these human data may reveal further fibroblast and smooth muscle subtypes similar to these mouse studies. The most striking discovery in the stroma was that the paracrine factors long thought to regulate prostate organogenesis, such as int/wingless (WNTs), fibroblast growth factors (FGFs), and prostaglandins, are predominantly expressed by fibroblasts, not by smooth muscle (Cunha et al., 2004). The concentration of DCN+ fibroblasts in the peri-urethral transition zone and peri-ejaculatory duct central zone could implicate these cells in the pathogenesis of BPH and should be examined further (Figure 5E).
Consortiums such as the Human Cell Atlas (HCA) and the GenitoUrinary Development Molecular Anatomy Project (GUDMAP) are efforts to provide markers for the identification of cell types to understand their functional interaction in normal organs. These efforts are a necessary foundation for a deeper understanding of disease (Rozenblatt-Rosen et al., 2017; McMahon et al., 2008; Harding et al., 2011). Our study provides the deepest understanding to date of cell types found in the normal human prostate and prostatic urethra, as well as their anatomical positions. The tools to identify and localize of every cell type in the normal human prostate are valuable resources that establish a baseline for all future studies of prostate disease.
STAR☆METHODS
CONTACT FOR REAGENT AND RESOURCE SHARING
Further information and requests for resources and reagents should be directed to and will be fulfilled by the Lead Contact, Douglas Strand (Douglas.Strand@UTSouthwestern.edu), following MTA approval.
EXPERIMENTAL MODEL AND SUBJECT DETAILS
Human subjects
Prostate specimens used in this study were obtained from 11, 18–31 year old male organ donors whose families were consented at the Southwest Transplant Alliance from March 2017 to April 2018 under IRB STU 112014–033. After transplantable organs were harvested, a cystoprostatectomy was performed and the specimen was transported to UT Southwestern Medical Center for processing. The prostate was dissected away from the bladder, and further dissected into anatomical zones as represented in Figure S1. The average age was 22 and the average prostate size was 17 g. Details for each specimen and its usage in associated figures are shown in the Key Resources Table.
METHOD DETAILS
Tissue processing
Fresh tissue samples less than 24 hours post-mortem were transported in ice-cold saline and immediately dissected into portions for 1) flash freezing in liquid nitrogen, 2) fixation in 10% formalin followed by paraffin embedding, and 3) a 4 hour enzymatic digestion into single cells at 37° C using 5 mg/ml collagenase type I (Life Technologies), 10 μM ROCK inhibitor Y-27632 (StemRD), 1nM DHT (Sigma), 1mg DNase I, and 1% antibiotic/antimycotic solution (100X, Corning) in HBSS (Henry et al., 2017, Zhang et al., 2016b). For the digestion step, 1 g of tissue was cut into pieces with surgical scissors such that all pieces can easily pass through a 10 mL stripette and resuspended in 15 mls digestion buffer. After 4 hours of rocking at 37° C, single cells were spun down at 1,800 RPM, washed with 25mls PBS twice, resuspended in 5 mls 0.25% TrypLE for 5 min at 37° C on a rocker. 15mls of DMEM + 10% FBS was added and the cells were spun down at 1,800 RPM. The cell pellet was resuspended in DMEM + 10% FBS and passed through 18-, 20-, and 22-gauge needles. Cells were then filtered through a 100 μm filter with an additional wash with DMEM + 10% FBS. Cells were spun down at 1,800 RPM, resuspended in DMEM + 10% FBS and filtered through a 40 μm filter, followed by an additional wash of the filter with DMEM + 10% FBS. Finally, the cells were spun down at 1,800 RPM, and resuspended in 10 mls DMEM + 10% FBS for counting with a hemocytometer. From fresh tissue to incubation of single cells with antibodies takes approximately 5 hours.
Flow cytometry
Viable human prostate cells were isolated by fluorescence activated cell sorting (FACS) for bulk and single cell sequencing in the UT Southwestern CRI Flow Cytometry Core on a BD FACSAria FUSION SORP flow cytometer and analyzed with FlowJo software as previously published (Henry et al., 2017). Improved antibody panels based on single cell data were built using titration and fluorescence minus one experiments. The Key Resources Table displays information on antibodies used for flow cytometry.
Immunohistochemistry
Fluorescent immunohistochemistry was performed as described previously (Abler et al., 2011). In brief, 5 μm paraffin sections were deparaffinized in xylene and hydrated through a series of ethanol washes. Heat mediated antigen retrieval was performed by boiling slides in 10 mM sodium citrate (pH 6.0) for 20 min in a conventional microwave oven. Tissues were washed with a solution containing 25 mM Tris-HCl, pH 7.5, 140 mM NaCl, 2.7 mM KCl, and 0.1% Tween-20 (TBSTw) and non-specific binding sites were blocked for 1 hr in TBSTw containing 1% Blocking Reagent (Roche Diagnostics, Indianapolis, IN), 5% normal goat sera, and 1% bovine serum albumin fraction 5 (RGBTw). Tissues were incubated overnight at 4° C with primary antibodies diluted in RGBTw. Tissues were washed several times in TBSTw and incubated with secondary antibodies diluted in RGBTw for 1 hour at room temperature. Following several washes with TBSTw, tissues sections were incubated with 4’,6-diamidino-2-phenylindole, dilactate (DAPI) to visualize cell nuclei and mounted in phosphate buffered saline containing 80% glycerol and 0.2% n-propyl gallate. Images were obtained using the Keyence BZ-X700 microscope (Keyence, Osaka, Japan). For primary and secondary antibody information see Key Resources Table.
Bulk population sequencing and analysis
Total RNA from 500K FACS-isolated BE, LE, other epithelia, and stromal cell gates from 4 donor specimens was extracted using RNEasy micro columns (QIAGEN). RNA quantity and quality were tested and samples were processed for RNA-Seq on a NextSeq 500 Sequencer (Illumina) in the UT Southwestern McDermott Center Next Generation Sequencing Core. The libraries were sequenced as stranded single-end 75 cycle reads. Analysis was done using the UT Southwestern Bioinformatics Core Facility RNA-Sequencing analysis workflow (https://git.biohpc.swmed.edu/BICF/Astrocyte/rnaseq). An average of 27 million sequencing reads per sample were aligned with HISAT2 to GRCh38 (Kim et al., 2015) at an average rate of 88%; duplicates are removed using SAMtools (Li et al., 2009); and counts are generated using FeatureCount (Liao et al., 2014) using the annotations from Gencode V20 (Harrow et al., 2012). Genes identified as Globins, rRNAs, and pseudogenes are removed. Differential expression analysis is performed using edgeR (Robinson et al., 2010), using a FC cutoff of 2 and adjusted FDR cutoff of 0.05. Pan-epithelial DEGs are an intersection of DEGs up in the different epithelial subpopulations (basal, luminal, and other) compared to stroma. Similarly, the stromal DEGs are the intersection of the DEGs which are up in stroma compared to the different epithelial subpopulations. The DEGs associated to each of the epithelial subpopulations are generated compared to stroma but are filtered to be unique for that subpopulation. Quantitative Set Analysis for Gene Expression (QuSAGE) was utilized to perform gene set enrichment-type analysis compared to publicly available prostate genesets (Zhang et al., 2016c; Liu et al., 2016b; Oudes et al., 2006). Oudes et al. (2006) published DEGs were used, but Zhang et al. (2016c) and Liu et al. (2016b) were calculated using limma (version 3.32.4) (Ritchie et al., 2015) and a FDR cutoff of 0.05 (Benjamini-Hochberg corrected) of log 2 normCounts and log 2 FPKM, respectively.
Single cell sequencing
Three young human prostate specimens were used for single cell sequencing. Single cell suspensions that were flow sorted for viability or gated for specific populations were loaded into the 10x Genomics Chromium Controller using the Chromium Single Cell 3′ Library and Gel Bead Kit v2 according to the manufacturer’s protocol. Briefly, 17,400 total cells of each sample were loaded on individual lanes of a Single Cell A Chip with appropriate reagents and run in the Chromium Controller to generate single cell gel bead-in-emulsions (GEMs) for sample and cell barcoding. Libraries were generated using 10x Genomics’ protocol. Libraries were pooled and submitted for sequencing on an Illumina NextSeq 500 in high output mode. 75 cycle flow-cells were used to sequence 26 cycles for read 1, 58 cycles read 2, and 8 cycles for the i7 index.
Fluorescence activated cell sorting
Cells from basal, luminal, ‘other’ epithelia, and fibromuscular were sorted out separately and single cell RNA-sequencing was performed in a similar fashion to the three patient aggregate. These samples were analyzed to demonstrate the rate of contamination of the FACS gates. Instead of running CCA (as all of the samples are from the same patient and didn’t need alignment), PCA was used conducted on the highest variable genes (same method as above). The PC’s representing the top 85% of the cumulative variation of 50 calculated PC’s was used for clustering and t-SNE calculation. Also, the DEG lists created above from the three patient aggregate experiment were used for cell type identification using QuSAGE, and stress and NE identification using PCA. This experiment was conducted on a second patient using an improved FACS panel predicted from the three patient aggregate DEG lists. The populations analyzed in the second patient was, BE, LE, ‘other’ epithelia, ‘double-negative’ epithelia, fibroblasts, and smooth-muscle. The Key Resources Table displays information on antibodies used for flow cytometry.
qPCR analysis
For quantitative real-time PCR (qPCR), RNA was extracted with Trizol (Ambion) from 200–500K flow cytometry-isolated cells. RNA was reverse transcribed into cDNA using RT2 First Strand Kit (QIAGEN, Valencia, CA). qPCR was performed using IQ SYBR Green Supermix (BioRad, Hercules, CA) and results were analyzed using BioRad CFX manager software. All results were calculated using ΔΔCt analysis and normalized to RPL27 expression. Statistical significance was calculated by t test using Graphpad Prism software (version 7.0d). Primer sequences are listed in the Key Resources Table.
QUANTIFICATION AND STATISTICAL ANALYSIS
Single cell sequencing data analysis
Clustering analysis
Three patient specimens dissected into transition and central zone and peripheral zone. Each zone was sorted for viability before loading into the 10x Genomics chromium controller. The 10x Genomics’ analysis pipeline, cellranger (version 2.1.1) was first used to demultiplex and produce a gene-cell matrix. Bcl files were demultiplexed using their barcode-aware wrapper for bcl2fastq (version2.17.1.14). Transcriptomes were aligned to GRCh38 using STAR (version 2.5.1b). Samples were then aggregated by downsampling to match their mean mapped reads per cell. Low quality cell barcodes were filtered out using 10x Genomics’ algorithm (high quality barcodes = total UMI count ≥ 10% of the 99th percentile of the expected recovered cells). Table S2 displays the sequencing metrics for each barcoded experiment.
Seurat (version 2.3.1), an R toolkit for single cell transcriptomics formed the basis of further analysis (Butler et al., 2018) run on R version 3.4.1. Genes that were expressed in three cells or less were filtered out along with cells expressing fewer than 200 unique genes. Cell cycle state was predicted based on Seurat’s built in principal-component (PC) analysis. Briefly, cells were scored based on expression their expression of G2M and S phase genes (Kowalczyk et al., 2015). Low quality cells and multiplets were excluded by removing cells with fewer than 500 unique genes and greater than 3,000 unique genes, as well as cells with greater than 10% of their transcriptome being mitochondrial genes. Data was then scaled to 10,000 and log transformed. Mitochondrial genes were then removed from further analysis. UMI counts were then scaled and variation due to differences in UMI/cell, percent mitochondrial genes, and cell cycle phase were regressed out of the data using a built-in Seurat function. Cells from the three patients were then subsetted and recombined using canonical correlation analysis (CCA) in order to align the clusters. The highest variable genes were found with an algorithm developed by Macosko et al. (Macosko et al., 2015), and were defined as an average expression between 0.2 and 5 with a dispersion greater than 1. The intersection of these genes between the three patients were used to calculate 50 CCAs and the first 30 were aligned. These 30 aligned-CCAs were used for t-SNE visualization and clustering.
Cells were clustered using a graph-based clustering approach (Butler et al., 2018). Briefly, cells were embedded in a KNN graph structure based on their Euclidean distance in PC space, with edge weights refined by shared overlap in their Jaccard distance. Different resolutions were generated based on a granularity input.
Stress removal
Highly stressed cells were predicted and removed by performing PC analysis on the cells’ expression of an MSigDB (Subramanian et al., 2005, Liberzon et al., 2011) list of stress response genes (M10970) (Table S3) (Chuang et al., 2002). The cells’ projection to PC1 was used as a “stress score.” To ensure this score is intuitive (stressed cells are more positive than unstressed), under the assumption that most of the cells are less stressed, the values are scaled such that the mean of the distribution is to the left of an expected normal distribution centered around zero. Highly stressed cells were chosen as 10% of the cells which had the top ‘stress score’. Clusters (from an over-clustered resolution of 1) were removed if at least 50% of the cells were identified as highly stressed. All remaining highly stressed cells were also removed and used to create a stress signature (Figure S3; Table S3) by calculating DEGs compared to lowly-stressed cells with a Wilcoxon rank sum test on genes present in at least 50% of either group which are at least five-fold enriched in the stressed cells and a maximum Bonferroni corrected p value alpha of 0.05. Remaining cells were then re-clustered and new t-SNE plots were generated.
Lineage specification
For cluster cell lineage (epithelial or stroma), the expression of genes in each cluster was correlated using QuSAGE (version 2.6.0) to 5-fold change differentially expressed genes (5FC-DEG) of pan-epithelial and stromal transcriptomes obtained from bulk population RNA-Seq. The cells were clustered at a resolution of 0.2 and QuSAGE was performed on a random subset of cells from each cluster, sampled to the smallest cluster. All identities were assigned from correlation as the highest positive enrichment score. Each lineage was independently sub-clustered, and t-SNE recalculated for cell-type identification. Epithelial clusters were correlated to 5FC-DEGs from population RNA-Seq of BE, LE, and “other” epithelia. Stromal clusters were correlated to a subset of GeneOntology biological process gene sets related to known stromal cell types. The gene sets used were GO_ENDOTHELIAL_CELL_DIFFERENTIATION, GO_SMOOTH_MUSCLE_CELL_ DIFFERENTIATION, GO_REGULATION_OF_FIBROBLAST_PROLIFERATION, and GO_LEUKOCYTE_ACTIVATION (Figure S4). The epithelial and stromal QuSAGE analysis, similar to the lineage analysis, was performed on random subsets of cells in each cluster, sampled to the smallest cluster in the specific analysis.
NE epithelial cell identification
Rare NE cells were identified from the epithelial cells using an initial NE gene set from Table 1 of Vashchenko and Abrahamsson (2005) and a PC-based method was used for stress identification, with the only difference being NE cells were chosen as the 0.1% of epithelial cells with the highest ‘NE score’ (Figure S5). A revised NE DEG list based on the difference between identified NE cells and the other epithelial cells is found in Table S3. The DEGs were determined with a Wilcoxon rank sum test on genes present in at least 1% of either group with a maximum Bonferroni corrected p value alpha of 0.05.
DEG calculation
Cluster/cell identities were aggregated and DEGs for the identified cell types were then determined using a Wilcoxon rank sum test on genes present in at least 25% of either the population of interest or all other cells in that lineage which are at least two-fold enriched in the population of interest and a maximum Bonferroni corrected p value alpha of 0.05.
Pseudotime analysis
Monocle (Trapnell et al., 2014) was performed on sub-setted epithelial cells using to predict possible differentiation trajectory in pseudotime.
Downsampling
Three libraries (transition zone specimens from 3 patients – see Table S2) were sequenced to deeper (382,925,951 reads, resulting in an average of 75,082 reads per cell), and the reads were randomly sampled to determine the relationship between cluster integrity and cell identity with read depth. Each of the sampled fastq sets were run through the pipeline the same as the FACS samples. The cell type identities were subjected to normalized mutual information (NMI) analysis, to quantify the mutual dependence of each sample to the un-sampled data (ground truth). The NMI was fitted to the mean reads per cell using locally weighted scatterplot smoothing. The minimum reads per cell that is required to produce a NMI of 0.9 was calculated from the model. The DEGs calculated with an average of ~24,000 reads per cell compared to the DEGs calculated with ~75,000 reads per cell showed 75%–80% overlap as can be seen in Table S3. For example, the top 9 LE genes at ~75,000 reads/cell included KLK2, ACPP, KLK4, KLK3, PLA2G2A, TSPAN8, SOCS2, GP2, and MSMB. Only SOCS2 and GP2 were not included as DEGs at ~24,000 reads/cell.Statistical details for FACS and qPCR experiments are detailed in the STAR Methods section.
DATA AND SOFTWARE AVAILABILITY
To increase rigor, reproducibility and transparency, raw image files (including duplicates not displayed here), raw FACS data and RNA-seq data generated as part of this study were deposited into the GUDMAP consortium database and are fully accessible at https://doi.org/10.25548/W-R8CM (Strand, 2018). The bulk and scRNA-seq data from normal prostate tissues were deposited into the GEO SuperSeries GSE120716. R code used to produce all the scRNA-Seq analysis can be found at https://git.biohpc.swmed.edu/StrandLab/sc-TissueMapper_Pr (tag 2.0.0). Analyzed data from the three patient aggregate single cell RNA-seq experiment can be found at http://strandlab.net/analysis.php, where gene expression can be investigated in the cell type clusters identified in this study.
Supplementary Material
Highlights.
Creation of a cellular anatomy of the young human prostate by scRNA sequencing
Verified purification scheme for every cell type by flow cytometry
Localization of every cell type in whole-mount transverse sections
Discovery of Club and Hillock epithelia enriched in the urethra and proximal ducts
ACKNOWLEDGMENTS
We thank the families of organ donors at the Southwest Transplant Alliance for their commitment to basic science research. Financial support came from NIH K01 DK098277, R03 DK110497, R01 DK115477, and the U54DK104310 pilot program award (to D.W.S.); NIH U54DK104310, U01DK110807, and R01DK099328 (to C.M.V.); the Cancer Prevention Research Institute of Texas (CPRIT) (RP150596 to V.S.M. and J.L. and RR140023 to G.C.H.); NIH (DP2GM128203 to G.C.H.); the Department of Defense (PR172060 to G.C.H.); the Welch Foundation (I-1926–20170325 to G.C.H.); the Green Center for Reproductive Biology; VA North Texas Health Care System New Investigator Program award (16–001 to J.C.G.); and the generous donations of the Smith, Penson, and Harris families to the UTSW Department of Urology (to C.G.R.).
Footnotes
SUPPLEMENTAL INFORMATION
Supplemental Information includes seven figures and five tables and can be found with this article online at https://doi.org/10.1016/j.celrep.2018.11.086.
DECLARATION OF INTERESTS
The authors declare no competing interests.
REFERENCES
- Abler LL, Keil KP, Mehta V, Joshi PS, Schmitz CT, and Vezina CM (2011). A high-resolution molecular atlas of the fetal mouse lower urogenital tract. Dev. Dyn 240, 2364–2377. [DOI] [PMC free article] [PubMed] [Google Scholar]
- Butler A, Hoffman P, Smibert P, Papalexi E, and Satija R (2018). Integrating single-cell transcriptomic data across different conditions, technologies, and species. Nat. Biotechnol 36, 411–420. [DOI] [PMC free article] [PubMed] [Google Scholar]
- Chuang YY, Chen Y, Gadisetti, Chandramouli VR, Cook JA, Coffin D, Tsai MH, DeGraff W, Yan H, Zhao S, et al. (2002). Gene expression after treatment with hydrogen peroxide, menadione, or t-butyl hydroperoxide in breast cancer cells. Cancer Res. 62, 6246–6254. [PubMed] [Google Scholar]
- Cunha GR, and Lung B (1978). The possible influence of temporal factors in androgenic responsiveness of urogenital tissue recombinants from wild-type and androgen-insensitive (Tfm) mice. J. Exp. Zool 205, 181–193. [DOI] [PubMed] [Google Scholar]
- Cunha GR, Ricke W, Thomson A, Marker PC, Risbridger G, Hayward SW, Wang YZ, Donjacour AA, and Kurita T (2004). Hormonal, cellular, and molecular regulation of normal and neoplastic prostatic development.J. Steroid Biochem. Mol. Biol 92, 221–236. [DOI] [PubMed] [Google Scholar]
- De Marzo AM, Platz EA, Sutcliffe S, Xu J, Grönberg H, Drake CG, Nakai Y, Isaacs WB, and Nelson WG (2007). Inflammation in prostate carcinogenesis. Nat. Rev. Cancer 7, 256–269. [DOI] [PMC free article] [PubMed] [Google Scholar]
- DeMarzo AM, Nelson WG, Isaacs WB, and Epstein JI (2003). Pathological and molecular aspects of prostate cancer. Lancet 361, 955–964. [DOI] [PubMed] [Google Scholar]
- di Sant’Agnese PA (1998). Neuroendocrine cells of the prostate and neuroendocrine differentiation in prostatic carcinoma: a review of morphologic aspects. Urology 51 (5A, Suppl), 121–124. [DOI] [PubMed] [Google Scholar]
- Georgas KM, Armstrong J, Keast JR, Larkins CE, McHugh KM, Southard-Smith EM, Cohn MJ, Batourina E, Dan H, Schneider K, et al. (2015). An illustrated anatomical ontology of the developing mouse lower urogenital tract. Development 142, 1893–1908. [DOI] [PMC free article] [PubMed] [Google Scholar]
- Goto K, Salm SN, Coetzee S, Xiong X, Burger PE, Shapiro E, Lepor H, Moscatelli D, and Wilson EL (2006). Proximal prostatic stem cells are programmed to regenerate a proximal-distal ductal axis. Stem Cells 24, 1859–1868. [DOI] [PubMed] [Google Scholar]
- Grün D, and van Oudenaarden A (2015). Design and analysis of single-cell sequencing experiments. Cell 163, 799–810. [DOI] [PubMed] [Google Scholar]
- Harding SD, Armit C, Armstrong J, Brennan J, Cheng Y, Haggarty B, Houghton D, Lloyd-MacGilp S, Pi X, Roochun Y, et al. (2011). The GUDMAP database–an online resource for genitourinary research. Development 138, 2845–2853. [DOI] [PMC free article] [PubMed] [Google Scholar]
- Harrow J, Frankish A, Gonzalez JM, Tapanari E, Diekhans M, Kokocinski F, Aken BL, Barrell D, Zadissa A, Searle S, et al. (2012). GENCODE: the reference human genome annotation for The ENCODE Project. Genome Res. 22, 1760–1774. [DOI] [PMC free article] [PubMed] [Google Scholar]
- Henry GH, Loof N, and Strand DW (2017). OMIP-040: optimized gating of human prostate cellular subpopulations. Cytometry A 91, 1147–1149. [DOI] [PMC free article] [PubMed] [Google Scholar]
- Hong KU, Reynolds SD, Giangreco A, Hurley CM, and Stripp BR (2001). Clara cell secretory protein-expressing cells of the airway neuroepithelial body microenvironment include a label-retaining subset and are critical for epithelial renewal after progenitor cell depletion. Am. J. Respir. Cell Mol. Biol 24, 671–681. [DOI] [PubMed] [Google Scholar]
- Hudson DL, Guy AT, Fry P, O’Hare MJ, Watt FM, and Masters JR (2001). Epithelial cell differentiation pathways in the human prostate: identification of intermediate phenotypes by keratin expression. J. Histochem. Cytochem 49, 271–278. [DOI] [PubMed] [Google Scholar]
- Isaacs JT (2008). Prostate stem cells and benign prostatic hyperplasia. Prostate 68, 1025–1034. [DOI] [PMC free article] [PubMed] [Google Scholar]
- Karthaus WR, Iaquinta PJ, Drost J, Gracanin A, van Boxtel R, Wongvipat J, Dowling CM, Gao D, Begthel H, Sachs N, et al. (2014). Identification of multipotent luminal progenitor cells in human prostate organoid cultures. Cell 159, 163–175. [DOI] [PMC free article] [PubMed] [Google Scholar]
- Kim D, Langmead B, and Salzberg SL (2015). HISAT: a fast spliced aligner with low memory requirements. Nat. Methods 12, 357–360. [DOI] [PMC free article] [PubMed] [Google Scholar]
- Kowalczyk MS, Tirosh I, Heckl D, Rao TN, Dixit A, Haas BJ, Schneider RK, Wagers AJ, Ebert BL, and Regev A (2015). Single-cell RNA-seq reveals changes in cell cycle and differentiation programs upon aging of hematopoietic stem cells. Genome Res. 25, 1860–1872. [DOI] [PMC free article] [PubMed] [Google Scholar]
- Kwon OJ, Zhang L, Ittmann MM, and Xin L (2014). Prostatic inflammation enhances basal-to-luminal differentiation and accelerates initiation of prostate cancer with a basal cell origin. Proc. Natl. Acad. Sci. USA 111, E592–E600. [DOI] [PMC free article] [PubMed] [Google Scholar]
- Kwon OJ, Zhang B, Zhang L, and Xin L (2016a). High fat diet promotes prostatic basal-to-luminal differentiation and accelerates initiation of prostate epithelial hyperplasia originated from basal cells. Stem Cell Res. (Amst.) 16, 682–691. [DOI] [PubMed] [Google Scholar]
- Kwon OJ, Zhang L, and Xin L (2016b). Stem cell antigen-1 identifies a distinct androgen-independent murine prostatic luminal cell lineage with bipotent potential. Stem Cells 34, 191–202. [DOI] [PMC free article] [PubMed] [Google Scholar]
- Li H, Handsaker B, Wysoker A, Fennell T, Ruan J, Homer N, Marth G, Abecasis G, and Durbin R; 1000 Genome Project Data Processing Subgroup (2009). The Sequence Alignment/Map format and SAMtools. Bioinformatics 25, 2078–2079. [DOI] [PMC free article] [PubMed] [Google Scholar]
- Liao Y, Smyth GK, and Shi W (2014). featureCounts: an efficient general purpose program for assigning sequence reads to genomic features. Bioinformatics 30, 923–930. [DOI] [PubMed] [Google Scholar]
- Liberzon A, Subramanian A, Pinchback R, Thorvaldsdóttir H, Tamayo P, and Mesirov JP (2011). Molecular signatures database (MSigDB) 3.0. Bioinformatics 27, 1739–1740. [DOI] [PMC free article] [PubMed] [Google Scholar]
- Liu AY, and True LD (2002). Characterization of prostate cell types by CD cell surface molecules. Am. J. Pathol 160, 37–43. [DOI] [PMC free article] [PubMed] [Google Scholar]
- Liu S, Cadaneanu RM, Zhang B, Huo L, Lai K, Li X, Galet C, Grogan TR, Elashoff D, Freedland SJ, et al. (2016a). Keratin 13 is enriched in prostate tubule-initiating cells and may identify primary prostate tumors that metastasize to the bone. PLoS ONE 11, e0163232. [DOI] [PMC free article] [PubMed] [Google Scholar]
- Liu X, Grogan TR, Hieronymus H, Hashimoto T, Mottahedeh J, Cheng D, Zhang L, Huang K, Stoyanova T, Park JW, et al. (2016b). Low CD38 identifies progenitor-like inflammation-associated luminal cells that can initiate human prostate cancer and predict poor outcome. Cell Rep. 17, 2596–2606. [DOI] [PMC free article] [PubMed] [Google Scholar]
- Macosko EZ, Basu A, Satija R, Nemesh J, Shekhar K, Goldman M, Tirosh I, Bialas AR, Kamitaki N, Martersteck EM, et al. (2015). Highly parallel genome-wide expression profiling of individual cells using nanoliter droplets. Cell 161, 1202–1214. [DOI] [PMC free article] [PubMed] [Google Scholar]
- Manyak MJ, Kikukawa T, and Mukherjee AB (1988). Expression of a uteroglobin-like protein in human prostate. J. Urol 140, 176–182. [DOI] [PubMed] [Google Scholar]
- McMahon AP, Aronow BJ, Davidson DR, Davies JA, Gaido KW, Grimmond S, Lessard JL, Little MH, Potter SS, Wilder EL, and Zhang P; GUDMAP project (2008). GUDMAP: the genitourinary developmental molecular anatomy project. J. Am. Soc. Nephrol 19, 667–671. [DOI] [PubMed] [Google Scholar]
- McNeal JE (1968). Regional morphology and pathology of the prostate. Am.J. Clin. Pathol 49, 347–357. [DOI] [PubMed] [Google Scholar]
- McNeal JE (1981). The zonal anatomy of the prostate. Prostate 2, 35–49. [DOI] [PubMed] [Google Scholar]
- Moad M, Hannezo E, Buczacki SJ, Wilson L, El-Sherif A, Sims D, Pick-ard R, Wright NA, Williamson SC, Turnbull DM, et al. (2017). Multipotent basal stem cells, maintained in localized proximal niches, support directed long-ranging epithelial flows in human prostates. Cell Rep. 20, 1609–1622. [DOI] [PMC free article] [PubMed] [Google Scholar]
- Montoro DT, Haber AL, Biton M, Vinarsky V, Lin B, Birket SE, Yuan F, Chen S, Leung HM, Villoria J, et al. (2018). A revised airway epithelial hierarchy includes CFTR-expressing ionocytes. Nature 560, 319–324. [DOI] [PMC free article] [PubMed] [Google Scholar]
- Ogata H, Goto S, Sato K, Fujibuchi W, Bono H, and Kanehisa M (1999). KEGG: Kyoto encyclopedia of genes and genomes. Nucleic Acids Res 27, 29–34. [DOI] [PMC free article] [PubMed] [Google Scholar]
- Oudes AJ, Campbell DS, Sorensen CM, Walashek LS, True LD, and Liu AY (2006). Transcriptomes of human prostate cells. BMC Genomics 7, 92. [DOI] [PMC free article] [PubMed] [Google Scholar]
- Peng YC, Levine CM, Zahid S, Wilson EL, and Joyner AL (2013). Sonic hedgehog signals to multiple prostate stromal stem cells that replenish distinct stromal subtypes during regeneration. Proc. Natl. Acad. Sci. USA 110, 20611–20616. [DOI] [PMC free article] [PubMed] [Google Scholar]
- Rawlins EL, Okubo T, Xue Y, Brass DM, Auten RL, Hasegawa H, Wang F, and Hogan BL (2009). The role of Scgb1a1+ Clara cells in the long-term maintenance and repair of lung airway, but not alveolar, epithelium. Cell Stem Cell 4, 525–534. [DOI] [PMC free article] [PubMed] [Google Scholar]
- Reiter RE, Gu Z, Watabe T, Thomas G, Szigeti K, Davis E, Wahl M, Nisitani S, Yamashiro J, Le Beau MM, et al. (1998). Prostate stem cell antigen: a cell surface marker overexpressed in prostate cancer. Proc. Natl. Acad. Sci. USA 95, 1735–1740. [DOI] [PMC free article] [PubMed] [Google Scholar]
- Ritchie ME, Phipson B, Wu D, Hu Y, Law CW, Shi W, and Smyth GK (2015). Limma powers differential expression analyses for RNA-sequencing and microarray studies. Nucleic Acids Res. 43, e47. [DOI] [PMC free article] [PubMed] [Google Scholar]
- Robinson MD, McCarthy DJ, and Smyth GK (2010). edgeR: a Bio-conductor package for differential expression analysis of digital gene expression data. Bioinformatics 26, 139–140. [DOI] [PMC free article] [PubMed] [Google Scholar]
- Rozenblatt-Rosen O, Stubbington MJT, Regev A, and Teichmann SA (2017). The Human Cell Atlas: from vision to reality. Nature 550, 451–453. [DOI] [PubMed] [Google Scholar]
- Shen MM, and Abate-Shen C (2010). Molecular genetics of prostate cancer: new prospects for old challenges. Genes Dev. 24, 1967–2000. [DOI] [PMC free article] [PubMed] [Google Scholar]
- Strand DW (2018). Determining the cellular heterogeneity of the normal human prostate. GUDMAP Consortium. 10.25548/W-R8CM. [DOI] [Google Scholar]
- Strand DW, Costa DN, Francis F, Ricke WA, and Roehrborn CG (2017). Targeting phenotypic heterogeneity in benign prostatic hyperplasia. Differentiation 96, 49–61. [DOI] [PMC free article] [PubMed] [Google Scholar]
- Subramanian A, Tamayo P, Mootha VK, Mukherjee S, Ebert BL, Gillette MA, Paulovich A, Pomeroy SL, Golub TR, Lander ES, and Mesirov JP (2005). Gene set enrichment analysis: a knowledge-based approach for interpreting genome-wide expression profiles. Proc. Natl. Acad. Sci. USA 102, 15545–15550. [DOI] [PMC free article] [PubMed] [Google Scholar]
- Timms BG (2008). Prostate development: a historical perspective. Differentiation 76, 565–577. [DOI] [PubMed] [Google Scholar]
- Timms BG, Mohs TJ, and Didio LJ (1994). Ductal budding and branching patterns in the developing prostate. J. Urol 151, 1427–1432. [DOI] [PubMed] [Google Scholar]
- Toivanen R, Mohan A, and Shen MM (2016). Basal progenitors contribute to repair of the prostate epithelium following induced luminal anoikis. Stem Cell Reports 6, 660–667. [DOI] [PMC free article] [PubMed] [Google Scholar]
- Trapnell C, Cacchiarelli D, Grimsby J, Pokharel P, Li S, Morse M, Lennon NJ, Livak KJ, Mikkelsen TS, and Rinn JL (2014). The dynamics and regulators of cell fate decisions are revealed by pseudotemporal ordering of single cells. Nat. Biotechnol 32, 381–386. [DOI] [PMC free article] [PubMed] [Google Scholar]
- Treutlein B, Brownfield DG, Wu AR, Neff NF, Mantalas GL, Espinoza FH, Desai TJ, Krasnow MA, and Quake SR (2014). Reconstructing line-age hierarchies of the distal lung epithelium using single-cell RNA-seq. Nature 509, 371–375. [DOI] [PMC free article] [PubMed] [Google Scholar]
- Tsujimura A, Koikawa Y, Salm S, Takao T, Coetzee S, Moscatelli D, Shapiro E, Lepor H, Sun TT, and Wilson EL (2002). Proximal location of mouse prostate epithelial stem cells: a model of prostatic homeostasis.J. Cell Biol 157, 1257–1265. [DOI] [PMC free article] [PubMed] [Google Scholar]
- van den Brink SC, Sage F, Vértesy Á, Spanjaard B, Peterson-Maduro J, Baron CS, Robin C, and van Oudenaarden A (2017). Single-cell sequencing reveals dissociation-induced gene expression in tissue subpopulations. Nat. Methods 14, 935–936. [DOI] [PubMed] [Google Scholar]
- van Leenders GJ, Gage WR, Hicks JL, van Balken B, Aalders TW, Schalken JA, and De Marzo AM (2003). Intermediate cells in human prostate epithelium are enriched in proliferative inflammatory atrophy. Am. J. Pathol 162, 1529–1537. [DOI] [PMC free article] [PubMed] [Google Scholar]
- Vashchenko N, and Abrahamsson PA (2005). Neuroendocrine differentiation in prostate cancer: implications for new treatment modalities. Eur. Urol 47, 147–155. [DOI] [PubMed] [Google Scholar]
- Xin L (2013). Cells of origin for cancer: an updated view from prostate cancer. Oncogene 32, 3655–3663. [DOI] [PMC free article] [PubMed] [Google Scholar]
- Xue Y, Smedts F, Debruyne FM, de la Rosette JJ, and Schalken JA (1998). Identification of intermediate cell types by keratin expression in the developing human prostate. Prostate 34, 292–301. [DOI] [PubMed] [Google Scholar]
- Yaari G, Bolen CR, Thakar J, and Kleinstein SH (2013). Quantitative set analysis for gene expression: a method to quantify gene set differential expression including gene-gene correlations. Nucleic Acids Res. 41, e170. [DOI] [PMC free article] [PubMed] [Google Scholar]
- Yang B, Bhusari S, Kueck J, Weeratunga P, Wagner J, Leverson G, Huang W, and Jarrard DF (2013). Methylation profiling defines an extensive field defect in histologically normal prostate tissues associated with prostate cancer. Neoplasia 15, 399–408. [DOI] [PMC free article] [PubMed] [Google Scholar]
- Zhang A, Zhang J, Plymate S, and Mostaghel EA (2016a). Classical and non-classical roles for pre-receptor control of DHT metabolism in prostate cancer progression. Horm. Cancer 7, 104–113. [DOI] [PMC free article] [PubMed] [Google Scholar]
- Zhang B, Kwon OJ, Henry G, Malewska A, Wei X, Zhang L, Brinkley W, Zhang Y, Castro PD, Titus M, et al. (2016b). Non-cell-autonomous regulation of prostate epithelial homeostasis by androgen receptor. Mol. Cell 63, 976–989. [DOI] [PMC free article] [PubMed] [Google Scholar]
- Zhang D, Park D, Zhong Y, Lu Y, Rycaj K, Gong S, Chen X, Liu X, Chao HP, Whitney P, et al. (2016c). Stem cell and neurogenic gene-expression profiles link prostate basal cells to aggressive prostate cancer. Nat. Commun 7, 10798. [DOI] [PMC free article] [PubMed] [Google Scholar]
Associated Data
This section collects any data citations, data availability statements, or supplementary materials included in this article.
Supplementary Materials
Data Availability Statement
To increase rigor, reproducibility and transparency, raw image files (including duplicates not displayed here), raw FACS data and RNA-seq data generated as part of this study were deposited into the GUDMAP consortium database and are fully accessible at https://doi.org/10.25548/W-R8CM (Strand, 2018). The bulk and scRNA-seq data from normal prostate tissues were deposited into the GEO SuperSeries GSE120716. R code used to produce all the scRNA-Seq analysis can be found at https://git.biohpc.swmed.edu/StrandLab/sc-TissueMapper_Pr (tag 2.0.0). Analyzed data from the three patient aggregate single cell RNA-seq experiment can be found at http://strandlab.net/analysis.php, where gene expression can be investigated in the cell type clusters identified in this study.