

SUMMARY
The majority of supratentorial ependymomas (ST-ependymomas) have few mutations but frequently display chromothripsis of chromosome 11q that generates a fusion between C11orf95 and RELA (RELAFUS). Neural stem cells transduced with RELAFUS ex vivo form ependymomas when implanted in the brain. These tumors display enhanced NF-κB signaling, suggesting that this aberrant signal is the principal mechanism of oncogenesis. However, it is not known whether RELAFUS is sufficient to drive de novo ependymoma tumorigenesis in the brain and, if so, whether these tumors also arise from neural stem cells. We show that RELAFUS drives ST-ependymoma formation from periventricular neural stem cells in mice and that RELAFUS-induced tumorigenesis is likely dependent on a series of cell signaling pathways in addition to NF-κB.
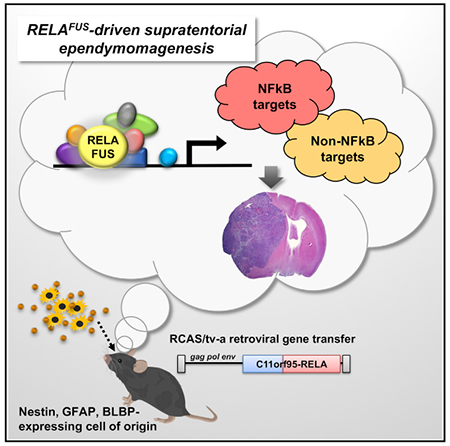
Graphical Abstract
In Brief
The C11orf95-RELA fusion (RELAFUS) has been found in a distinct subset of supratentorial ependymomas. Ozawa et al. show that RELAFUS is sufficient to drive ST-ependymoma formation from periventricular neural stem cells in mice. Furthermore, they show that RELAFUS-induced tumorigenesis might depend on other cell signaling pathways in addition to NF-κB.
INTRODUCTION
Ependymomas account for 10% of intracranial tumors in children and 4% of brain and spinal cord tumors in adults (Chamberlain, 2003; Rudà et al., 2008). Genomic studies have subdivided supratentorial (ST), posterior fossa (PF) and spinal (SP) ependymomas into clinically meaningful and molecularly distinct subgroups (Johnson et al., 2010; Mack et al., 2014; Pajtler et al., 2015; Parker et al., 2014; Taylor et al., 2005; Witt et al., 2011). Despite these insights, all ependymomas are similarly treated with surgery and radiotherapy. Chemotherapy is not used routinely to treat ependymoma because it is largely ineffective (Bouffet and Foreman, 1999; Merchant et al., 2009).
Recent next-generation sequencing studies have discovered recurrent chromosomal translocations in a subset of ST-ependymomas that generate distinct fusion oncogenes (Parker et al., 2014). Seventy-two percent of ST-ependymomas contain C11orf95-RELA fusions (Pajtler et al., 2015; Parker et al., 2014). Patients with these tumors have a 5-year progression-free survival of <30% (hereafter termed the ST-ependymoma [EPN]-RELA subtype). A further 10% of ST-ependymomas contain either C11orf95-YAP1, YAP1-MAMLD1, or YAP1-FAM118B fusions (ST-EPN-YAP1 subtype) and have a much better 5-year progression-free survival of 66% (Pajtler et al., 2015; Parker et al., 2014). RELA and YAP1 fusions are highly restricted to ST-ependymomas, supporting the notion that regional neural cell types are uniquely susceptible to specific genetic mutations (Johnson et al., 2010; Mohankumar et al., 2015; Taylor et al., 2005). The remaining 18% of ST-ependymomas are subependymomas that lack fusion genes and have an excellent clinical outcome (Pajtler et al., 2015; Parker et al., 2014).
We showed recently that the two most common C11orf95-RELA fusions (RELAFUS1 and RELAFUS2) and C11orf95-YAP1 (but not C11orf95, RELA, or YAP1 alone) can transform embryonic mouse neural stem cells ex vivo (Parker et al., 2014). Although expression of RELAFUS1 was shown to activate nuclear factor κB (NF-κB) signaling, whether this is required for transformation and whether fusions can drive ependymomagenesis de novo in the brain is not known. To test this, we used the RCAS/tv-a system to deliver the RELAFUS1 fusion or fusion variants engineered to contain mutations in critical portions of RELA to Nestin-, glial fibrillary acidic protein (GFAP)-, or BLBP-expressing cells in the mouse brain. Neither C11orf95 nor RELA alone were sufficient to drive tumorigenesis. Expression of RELAFUS1 in our system upregulated a broad array of genes that included an NF-κB-associated transcriptional signature; however, RELAFUS1 mutants with selective mutation of the Rel homology domain (RHD) as well as constitutively active RELA mutants failed to induce brain tumor formation. The data suggest that RELAFUS1 is adequate to drive EPN formation de novo in the brain. The oncogenic effect of RELAFUS1 requires the Ser 486, but not Ser 746, phosphorylation site in the fusion protein and produces biologic effects that are not restricted to NF-κB.
RESULTS
C11orf95-RELA Drives Brain Tumorigenesis
RELAFUS1 accounts for almost half of all C11orf95-RELA fusions and includes the N-terminal portion of C11orf95 and all but the first two codons of RELA (Parker et al., 2014). To test the ability of RELAFUS1 to form ependymomas de novo, we used the RCAS/tv-a system to express RELAFUS1 in specific brain cell types in mice (Holland et al., 1998; Holland and Varmus, 1998). RCAS-RELAFUS1 or RCAS-RELAFUS1-HA (containing a C-terminal human influenza hemagglutinin [HA] tag) were first expressed in Nestin-expressing brain cells using Nestin (N)/tv-a mice (Figures 1A and S1; Holland et al., 1998). Fifty-two percent and 92% of mice injected with RCAS-RELAFUS1 or RCAS-RELAFUS1-HA, respectively, but not a control, developed tumors within 2 months of injection (Figures 1A–1C; Table S1A). In stark contrast, RCAS-HA-RELA, RCAS-RELA-HA, or RCAS-C11orf95-HA failed to generate tumors, confirming our prior observations that RELAFUS1, but neither translocation partner gene alone, is competent to drive tumorigenesis (Figures 1A–1C and S1; Parker et al., 2014). Notably, although CDKN2A (INK4A-ARF) is deleted in some ST-EPN-RELA tumors and enhances platelet-derived growth factor (PDGF)-induced glioma formation in mice, RELAFUS1-induced tumorigenesis neither required, nor was it accelerated by, ink4a-Arf deletion in mice (Figures 1B and 1C; Table S1B; Fomchenko et al., 2011; Ozawa et al., 2014; Pajtler et al., 2015).
Figure 1. Somatic Cell Gene Transfer of C11orf95-RELA into Nestin-Expressing Cells Drives Brain Tumorigenesis.
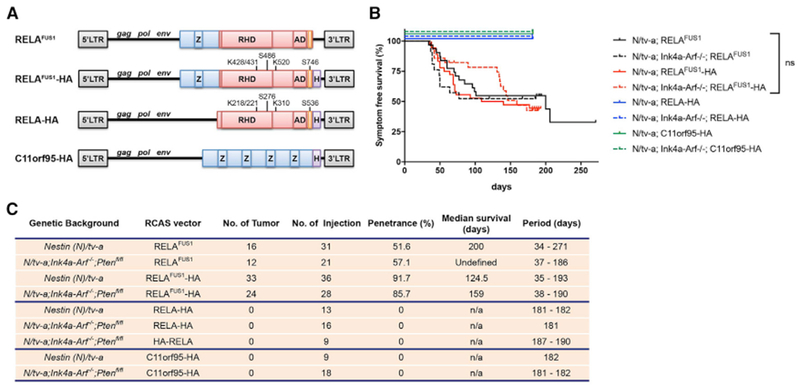
(A) Schematic of various RCAS vectors. Blue and red boxes represent components of C11orf95 and RELA coding sequences, respectively. Z, zinc finger (C2H2-like); RHD, Rel homology domain; AD, activation domain; orange box, 9aaTAD; H, HA tag. The phosphorylation and acetylation sites of the RELAFUS1 gene product corresponding to those of RELA are also described.
(B) Kaplan-Meier survival curves showing symptom-free survival of RCAS-RELAFUS1 (black line) and RELAFUS1-HA(red line), RELA-HA (blue line), or C11orf95-HA (green line) injection in Nestin (N)/tv-a (regular line) or N/tv-a;Ink4a-Arf−/− (dotted line) mice. Tumor formation was observed by injection of these RCAS viruses into neonatal pups brains. n.s., not significant.
(C) Summary of the RCAS vector injections in N/tv-a or N/tv-a;Ink4a-Arf−/−.
RELAFUS1-Induced Mouse Tumors Recapitulate ST-EPN Histology
RELAFUS1-induced tumors were well circumscribed, predominantly intra-ventricular tumors that displayed several histological features characteristic of ependymoma, including a biphasic architectural pattern of dense cell clusters alternating with hypocellular regions and relatively little necrosis (Figures 2A and S2A) but no canonical ependymal rosettes and pseudorosettes, although similar structures were sometimes observed (Figure 2B). RELAFUS1-induced tumors also contained a network of delicate branching capillaries similar to that observed in our ex vivo RELAFUS1-induced tumor model (Parker et al., 2014) and the vascular variant of human ST-ependymomas (Figure 2B; Figarella-Branger et al., 2016; Godfraind et al., 2012; Rousseau et al., 2007). These morphological findings were obviously distinct from both astrocytic and oligodendrocytic glioma mouse models and human glioblastoma (GBM) presenting an infiltrative growth pattern and glomeruloid microvascular formation (Figures 2A and 2B and S2B–S2F). Immunostaining and electron microscopy of RELAFUS1-induced tumors identified additional features common to human ependymomas, including expression of GFAP and Olig2 and interdigitating tumor cell processes (Figures 2C and 2D and S2E and S2F; Liberski, 1996; Otero et al., 2011). Furthermore, we showed previously that human ST-EPN-RELA tumors display intense nuclear RELA immunoreactivity (Parker et al., 2014). The same immunohistochemical feature was displayed by our de novo RELAFUS1-induced tumors but not by similarly generated PDGFA- or shNfl (GPT53N)-driven mouse gliomas (Figure 3A). These observations were further validated in a cohort of human ST- (n = 23), PF- (n = 49), and SP-ependymomas (n = 48) and GBMs (n = 30) (Figures 3B and 3C and S3A–S3E; Tables S2A–S2C). Thus, our RELAFUS1-induced brain tumors recapitulate the principal growth, morphological, and immunohistochemical features of human ST-EPN-RELA tumors.
Figure 2. RELAFUS1-induced Mouse Tumors Recapitulate Human ST-EPN Histology.
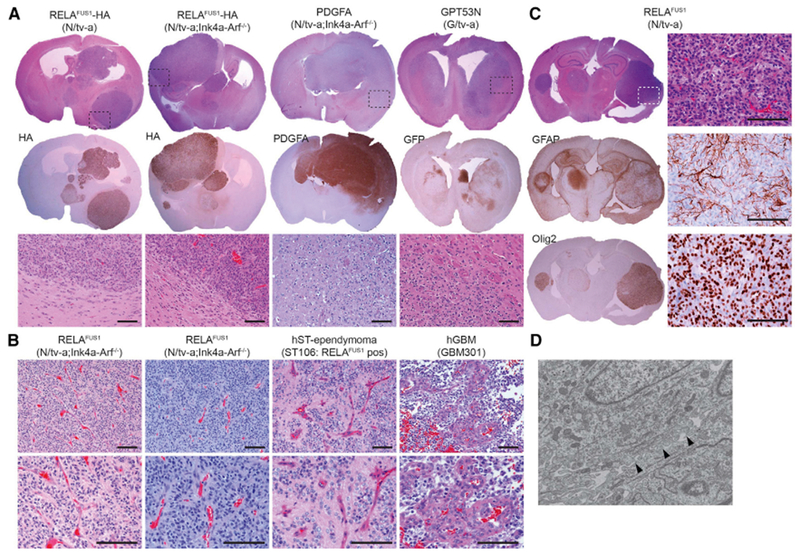
(A) Representative H&E and immunohistochemistry (IHC) images of RCAS-RELAFUS1-HA-, PDGFA-, and GPT53N-induced brain tumors in the indicated tv-a mice. HA, PDGFA, and GFP antibody immunoexpression represents essentially the vector expression. Dashed boxes at the top denote the enlarged regions as shown at the bottom. Scale bars, 100 μm.
(B) Representative H&E stainings of RELAFUS1-induced brain tumors in N/tv-a;Ink4a-Arf−/− mice, human RELAFUS1-positive ST-ependymoma, and human GBM. Scale bars, 100 μm.
(C) Representative H&E and IHC analysis with the indicated antibodies of RCAS-RELAFUS1-induced brain tumors in N/tv-a mice. All enlarged images represent the areas of dashed boxes in H&E staining. Scale bars, 100 μm.
(D) Representative ultra-structure of a RELAFUS1-induced brain tumor. Black arrowheads show interdigitating tumor cell processes.
Figure 3. RELA Expression in Mouse and Human RELAFUS1 EPNs.
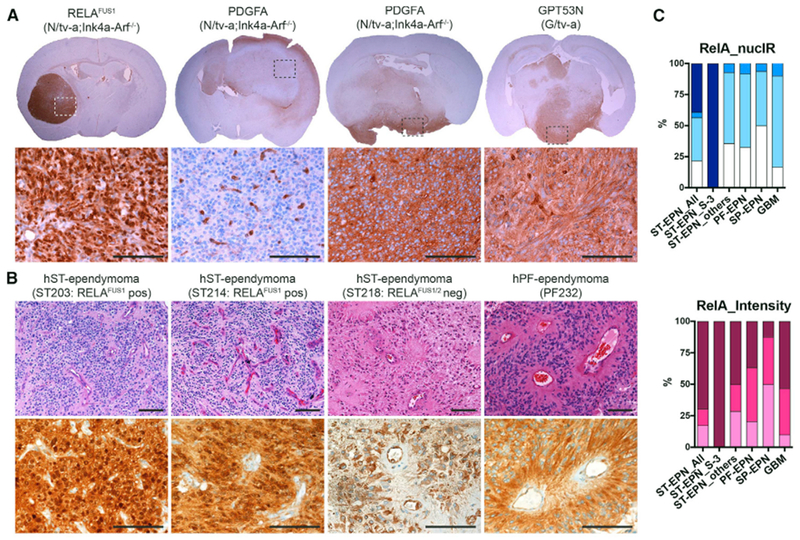
(A) Representative IHC analysis for RELA of RCAS-RELAFUS1-, PDGFA- and GPT53N-induced brain tumors in the indicated tv-a mice. Dashed boxes at the top denote the enlarged regions as shown at the bottom. Scale bars, 100 μm.
(B) Representative H&E and IHC analysis for RELA of human RELAFUS1-positive (ST203, ST214) and RELAFUS1/2-negative (ST218) ST-ependymomas and PF-EPN (PF232). All IHC images show the same area as each H&E images. Scale bars, 100 μm.
(C) Summary of semiquantitative immunohistochemical analysis for RELA in human ependymomas and GBMs. The immunoexpression level was evaluated using two criteria: nuclear immunoreactivity (NucIR) and staining intensity as described in Figure S3D and Table S2B. See also Supplemental Experimental Procedures.
RELAFUS1-Induced Mouse Tumors Express a Human ST-EPN-RELA-like Transcriptome
To further assess the fidelity of the RELAFUS1-EPN mouse model, we performed RNA sequencing (RNA-seq) analysis of these tumors and compared their transcriptomes with those of normal mouse brain and PDGFA-driven mouse gliomas (Table S3). Principal-component analysis clearly segregated RELAFUS1-ependymoma, PDGFA-driven glioma, and normal brain transcriptomes, confirming the distinct biologies of these tissues (Figure 4A). Next, to test whether RELAFUS1-driven mouse transcriptomes recapitulate those of human ST-EPN-RELA, we compared their transcriptomes using cross-species gene set enrichment analysis (GSEA) (Supplemental Experimental Procedures). Gene sets that define human ST-ependymoma, and in particular ST-EPN-RELA, but not human PF- or SP-ependymoma, were significantly enriched in mouse RELAFUS1-driven tumor transcriptomes (Figures 4B–4E; Pajtler et al., 2015; Taylor et al., 2005). Thus, in addition to displaying the morphologic and immunophenotypic characteristics of ST-EPN-RELA, RELAFUS1-ependymomas also recapitulate the transcriptome of human ST-EPN-RELA.
Figure 4. RELAFUS1-induced Mouse Tumors Express a Human ST-EPN-RELA-like Transcriptome.
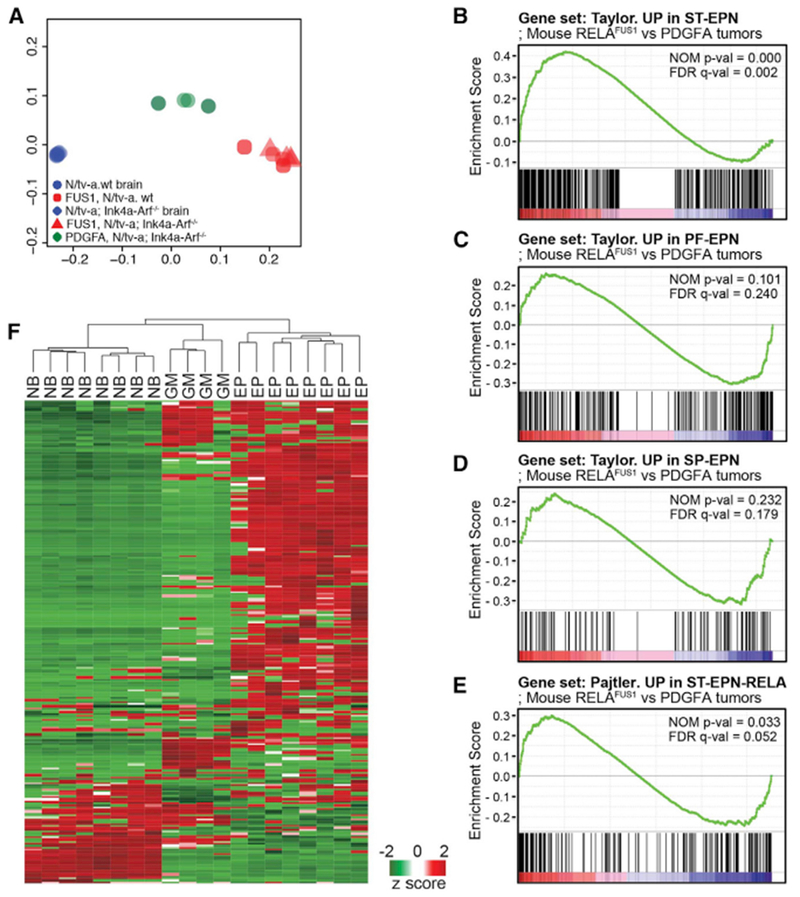
(A) Principal-component analysis with gene expression profiling of RELAFUS1 ependymomas, PDGFA-driven murine gliomas, and normal mouse brains.
(B–E) Gene set enrichment analysis (GSEA) of RELAFUS1 ependymomas and PDGFA-induced gliomas. Gene expression profiles were compared between both mouse tumor types using gene sets based on ST- (B), PF- (C), and SP-EPN (D) or ST-EPN-RELA’s (E) gene expression signatures (Pajtler et al., 2015; Taylor et al., 2005). The nominal p value (NOM p-val) and false discovery rate (FDR)-corrected q value (FDR q-val) are indicated. A nominal p value of <0.05 was considered significant in this analysis.
(F) Unsupervised hierarchical cluster analysis of 302 validated NF-κB target genes expressed de novo in mouse RELAFUS1-EPN (EP), PDGFA-driven glioma (GM), and normal mouse brain (NB) (http://www.bu.edu/nf-kb/gene-resources/target-genes/; T. D. Gilmore; Parker et al., 2014).
We showed previously that RELAFUS1 translocates spontaneously to the nucleus of mouse neural stem cells to activate the transcription of a large number of genes, including NF-κB target genes (Parker et al., 2014). In keeping with these data, genes that were significantly upregulated in de novo RELAFUS1-induced mouse ependymomas relative to normal brain included 52% (n = 158 of 302) of validated NF-κB target genes (false discovery rate [FDR] p = 4.7 × 10⁻⁷), and GSEA identified “TNFA_signaling_via_NFKB” as one of the most enriched gene sets in these tumors (FDR, q value 6.39 × 10−43). Furthermore, hierarchical clustering using validated NF-κB target genes alone readily segregated de novo mouse RELAFUS1-EPN (EP), PDGFA-driven glioma (GM) and normal mouse brain (NB) transcriptomes (Figure 4F). Thus, RELAFUS1 activates NF-κB target gene transcription following de novo tumor formation in vivo as well as in neural stem cells in vitro.
RELAFUS1 Induces an Aberrant Non-Canonical NF-κB Transcriptional Cassette
Although overexpression of wild-type RELA in neural stem cells activates gene transcription, this is restricted to NF-κB target genes and does not promote malignant transformation (Figures 1B and 1C; Tables S1A–S1D; Parker et al., 2014). Thus, aberrant NF-κB signaling appears to be associated with, but not sufficient, to drive RELAFUS1-induced tumorigenesis. Therefore, to better understand how RELAFUS1 drives transformation, we looked for non-NF-κB target genes that were dysregulated in both our ex vivo and de novo RELAFUS1-induced mouse ependymomas. Nine thousand nine hundred and sixty-five genes were significantly up- or downregulated in either our ex vivo neural stem cell (Parker et al., 2014) or de novo RELAFUS1-induced mouse brain tumors relative to mouse normal neural stem cells and brain, respectively (p < 0.05 FDR). A significant number of these genes was commonly dysregulated in both tumors, including 13% that were upregulated (n = 1,271 of 9,965) and 4% that were downregulated (n = 400 of 9,965) in both tumor models (p = 2.3 × 10⁻⁶ for overlap) (Table S4). Only 6% of these genes (n = 102 upregulated, n = 1 downregulated) are known NF-κB targets (Table S4A). GSEA segregated the remaining 1,568 “non-NF-κB” target genes into nine broad classes (Table S4B). Remarkably, we showed previously that six of these classes are dysregulated when mouse neural stem cells are transformed by non-fusion EPN oncogenes (Mohankumar et al., 2015). These included negative enrichment of synaptogenesis and vesicle trafficking regulators (e.g., INTRACELLULAR_VESICLE, n = 137 of 1,259, FDR q value = 2.84 × 10−51), consistent with our observation that these genes are selectively deleted during ST-EPN tumorigenesis (Mohankumar et al., 2015). The five other gene classes commonly enriched with those in non-RELAFUS1 EPN included stem cell function and neuronal differentiation (e.g., REGULATION_OF_CELL_DIFFERENTIATION, n = 160 of 1,492, FDR q value = 3.20 × 10−59), immunity and inflammation (e.g., REGULATION_OF_CYTOKINE_PRODUCTION, n = 114 of 563, FDR q value = 8.71 × 10−69), the epigenome (SILENCED_BY_METHYLATION, n = 67 of 282, FDR q value = 6.14 × 10−47), and those associated with other cancer types. Notably, this latter class included positive enrichment of genes associated with the mesenchymal subtype of glioblastoma (GLIOBLASTOMA_MESENCHYMA, n = 95 of 216, FDR q value = 2.26 × 10−95). By addition to these six broad classes, RELAFUS1-induced transformation also enriched the expression of genes controlling cell-cell adhesion (e.g., BIOLOGICAL_ADHESION, n = 155 of 1,032, FDR q value = 4.27 × 10−75) and downregulated genes controlling the transmembrane transport of ions (e.g., ION_TRANSPORT, n = 45 of 1,262, FDR q value = 1.23 × 10⁻¹²) that we did not observe during the formation of non-RELAFUS1 EPN (Mohankumar et al., 2015). Together, these data suggest that all forms of ST-ependymomagenesis require dysregulation of synaptogenesis and vesicle trafficking, stem cell function and neuronal differentiation, immunity and inflammation, the epigenome, and functions associated with other cancer types; however, dysregulation of cell-cell adhesion and ion transport might be associated more selectively with RELAFUS1-induced transformation.
Because loss of Ink4a-Arf did not affect the tumor latency of our RELAFUS1-induced ependymomas, we investigated the dysregulation of alternative pathways. Accumulation of TP53 is very frequent in human ST-EPN-RELA tumors and associated with a poor prognosis, although this gene mutation is rare (Tzaridis et al., 2016). Furthermore, the accumulated TP53 is thought to be functionally impaired in ependymomas (Gaspar et al., 2006; Tzaridis et al., 2016; Verstegen et al., 2002). Therefore, we focused on Trp53 status in the mouse tumors. Consistent with frequent accumulation of TP53 in human RELAFUS-positive cases (Tzaridis et al., 2016), evident upregulation of the Trp53 pathway and elevated Trp53 mRNA expression were observed in RELAFUS1-induced tumors in both N/tv-a and N/tv-a; Ink4a-Arf−/− mice (Figures S4A–S4). Thus, it is possible that the effect of Ink4a-Arf loss in RELAFUS1-induced EPN formation was blurred by dysregulation of the TP53 pathway in our model, leading to no survival difference between the genetic backgrounds (Figures 1B and 1C).
Serine-486 of RELAFUS1 (Corresponding to Serine-276 of RELA) Is Critical to Drive Tumorigenesis
The aberrant juxtaposition of genes within fusion proteins following chromosomal translocation may result in the uncontrolled activation of fusion partners or the acquisition of novel functions (Mertens et al., 2015). Our transcriptomic analyses of RELAFUS1-driven tumors suggest that this fusion activates NF-κB signaling and a series of other cell pathways. Therefore, to further dissect the NF-κB- and non-NF-κB-related transforming functions of RELAFUS1, we created a series of mutant forms of wild-type RELA and RELAFUS1 and tested the capacity of these constructs to drive tumorigenesis in our RCAS/tv-a system in vivo. Phosphorylation of Ser-276 and Ser-536 within the Rel homology and transactivation domains, respectively, has been reported to promote RELA transcriptional activity (Figure 1A; Chen and Greene, 2004; Hoesel and Schmid, 2013; Huang et al., 2010); however, introduction of phosphomimetic mutants of these residues (RELA-S276E, RELA-S536E, or combined RELA-S276E/S536E) into the brains of N/tv-a and N/tv-a;Ink4a-arf−/− neonatal mice failed to drive tumorigenesis (Figures 1A and S5A; Tables S1A and S1B). Thus, consistent with our studies of overexpressed wild-type RELA (Parker et al., 2014), constitutively active RELA is not competent to drive ependymomagenesis.
We next created a series of RELAFUS1 mutants and tested the ability of these to drive ependymomagenesis in the brains of N/tv-a and N/tv-a;Ink4a-arf−/− neonatal mice (Figures 1A and S5B–S5D). A serine-glutamine substitution at Ser-486 of RELAFUS1 (corresponding to Ser-276 in the Rel homology domain of RELA) markedly reduced the transforming capacity of RELAFUS1 (Figures 1A and 5A–5C; Tables S1A–S1C); RELAFUS1-S486E formed no tumors in 14 N/tv-a neonatal brains compared with a tumor penetrance of 92% (n = 33 of 36) in mice injected with RELAFUS1 (log ratio, p = 0.0009) (Figure 5C; Tables S1A and S1C). RELAFUS1-S486E-driven tumor penetrance was also much reduced in N/tv-a;Ink4a-arf−/− neonatal mice (8%, n = 1 of 12) compared with 86% (n = 24 of 28) driven by RELAFUS1 (log ratio, p = 0.0095) (Figure 5C; Tables S1B and S1C). In contrast, a serine-glutamine substitution at Ser-746 (corresponding to Ser-536 of RELA) did not reduce tumorigenesis in either N/tv-a or N/tv-a;Ink4a-arf−/− neonatal mice (Figures 1A and 5A–5C; Tables S1A–S1C). Constructs harboring both of these substitutions (RELAFUS1-S486E/S746E: EE) failed to drive tumorigenesis in the N/tv-a neonatal brain and drove tumors with a penetrance of only 12% (n = 4 of 33) in N/tv-a;Ink4a-arf−/− neonatal mice (Figures 5A–5C; Tables S1A–S1C), suggesting that S486E had a negative effect on the brain tumor-forming capacity of RELAFUS1. Two additional constructs carrying serine-alanine substitutions at these same residues (RELAFUS1-S486A and RELAFUS1-S486A/S746A: AA) also abolished and markedly reduced RELAFUS1-driven ependymomagenesis in N/tv-a (S486A, log rank test, p = 0.0006; S486A/S746A, log rank test, p = 0.1731) and N/tv-a;Ink4a-arf−/− (S486A, log-rank test, p = 0.0004; S486A/S746A, log-rank test, p = 0.0024) neonatal mouse brains, respectively (Figures 5A–5C; Tables S1A–S1C), whereas RELAFUS1-S746A did not affect tumorigenesis. Thus, Ser-486, but not Ser-746, appears to be critical for RELAFUS1-driven ependymomagenesis.
Figure 5. Serine-486 of RELAFUS1 Is Critical to Drive Tumorigenesis.
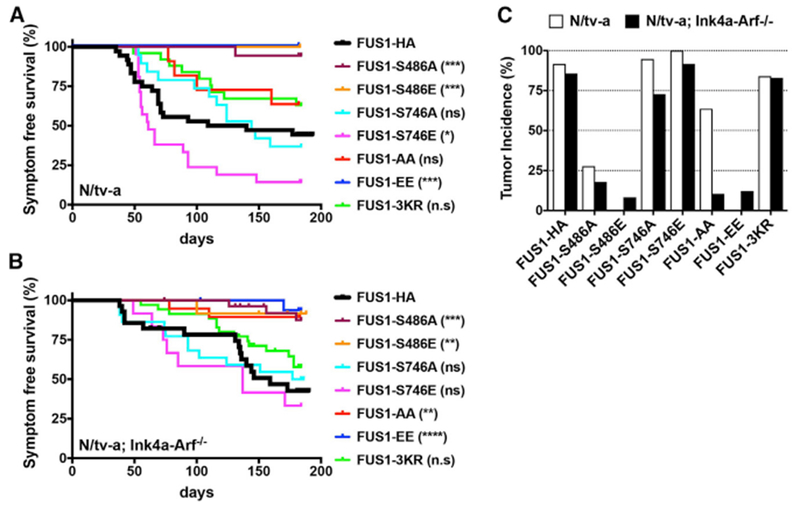
(A and B) Kaplan-Meier survival curves showing symptom-free survival of RELAFUS1-HA or RELAFUS1-HA mutant-induced brain tumors in N/tv-a (A) and N/tv-a; Ink4a-Arf−/− (B) mice. The survival curves of the RELAFUS1-HA-induced tumors from Figure 1B are also shown for comparison. Statistical comparison of each mutant with RELAFUS1-HA is also shown in the legends and Table S1C. *p < 0.05, **p < 0.01, ***p < 0.001, ****p < 0.0001.
(C) Tumor incidence of RELA-HA, RELAFUS1-HA, or the relevant mutant injection in N/tv-a and N/tv-a;Ink4a-Arf−/− mice. See also Tables S1A–S1C.
Acetylation of RELA has also been reported to regulate NF-κB activity (Huang et al., 2010). Acetylation of lysine-310 (K310) has been reported to promote full transcriptional activity (Chen et al., 2002; Huang et al., 2010), and K221/K218 acetylation enhances DNA binding and prevents nuclear export. To test the importance of these residues in RELAFUS1-driven tumorigenesis, we generated lysine-to-arginine unacetylatable mutants in the residues corresponding to K218, K221, and K310R of RELA (RELAFUS1-K428R/K431R/K520R: 3KR; Figures 1A, S5B, and S5E; Chen et al., 2002). RELAFUS1-3KR drove ependymomas with high penetrance in N/tv-a (84%, n = 21/25) and N/tv-a;Ink4a-Arf−/− (83%, n = 29 of 35) mice, indicating that acetylation of these residues is dispensable for RELAFUS1-driven tumorigenesis (Figures 5A–5C; Tables S1A–S1C).
Disruption of Cell-Cell Adhesion Is a Critical Component of RELAFUS1-Driven Tumorigenesis
We reasoned that comparing the transcriptomes driven by RELAFUS1 mutants that did or did not drive tumorigenesis might pinpoint cell functions that are critically associated with RELAFUS1-driven transformation. Multi-dimensional scaling (MDS) using NF-κB target genes as input (Tables S5 and S6)clearly segregated NIH 3T3/tv-a cells transduced with tumor-forming vectors (RELAFUS1, RELAFUS1-S746E, and RELAFUS1-3KR) from those transduced with non-transforming constructs (RELA-S276E, RELAFUS1-S486E, and RELAFUS1-EE), strongly suggesting that NF-κB activity is significantly associated with RELAFUS1-driven tumorigenesis (Figures 6A, S6A, and S6B). More than half of these genes were enriched for regulators of cell-cell adhesion and the extracellular matrix, immunity and inflammation, or vesicle trafficking (Table S4B). Thus, RELAFUS1 might drive EPN tumorigenesis in part by dysregulating communication between tumor cells and the brain microenvironment, perhaps promoting local invasion and growth (Mohankumar et al., 2015).
Figure 6. RNA-Seq Analysis of NIH3T3T Cells and RELAFUS1-induced Mouse Tumors.
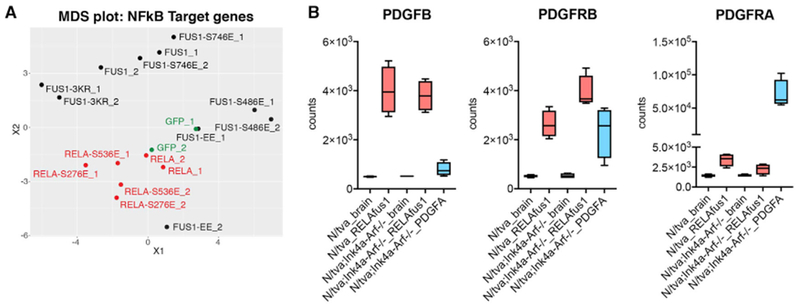
(A) Multidimensional scaling (MDS) projection of sample similarities based on gene expression profiling analyzed with the NF-κB gene set in NIH 3T3T cells infecting the indicated RCAS vectors. See also Tables S5, S6, and S7.
(B) Boxplots of PDGFB, PDGFRB, and PDGFRA expression in mouse brain and brain tumor tissues. See also Table S3.
Interestingly, in addition to these gene sets, both PDGF beta polypeptide (PDGFB) and its cognate receptor PDGF beta polypeptide (PDGFRB) were markedly upregulated in the transcriptomes of RELAFUS1-driven ex vivo and de novo ependymomas (Figure 6B; Parker et al., 2014) as well as selectively upregulated in those driven by tumorigenic RELAFUS1 mutants (Table S7). PDGFB is a highly potent neural oncogene (Dai et al., 2001); thus, RELAFUS1 might also drive EPN tumorigenesis by upregulating oncogenic PDGFB-PDGFRB signaling.
The Normal Ventricular Wall as the Putative Location for Ependymomagenesis
Our prior cross-species analyses and ex vivo mouse modeling predict that neural stem cells in the lateral ventricular wall are cells of origin of EPN (Johnson et al., 2010; Mohankumar et al., 2015; Taylor et al., 2005). However, these studies involved cross-species mapping of human EPN gene expression profiles in normal developing mouse brain or ex vivo transduction of mouse neural stem cells that form tumors when reimplanted in the brain. Therefore, to better understand the origin of ependymoma, we took advantage of our de novo RELAFUS1-induced tumor model. These tumors were typically observed as intra- and/or peri-ventricular cerebral masses, although, rarely, tumors also occurred in the cerebral parenchyma not obviously connected with the ventricular system, similar to the growth pattern of human ependymomas (Figures 2A, 2C, 3A, S2A, and S7A–S7E). Histological analyses of early lesions developing within 31 days of RELAFUS1 injection into N/tv-a mice identified small lesions immediately adjacent to the ventricular system (Figures 7A and S7E).
Figure 7. The Normal Ventricular Wall as the Putative Location for Ependymomagenesis.
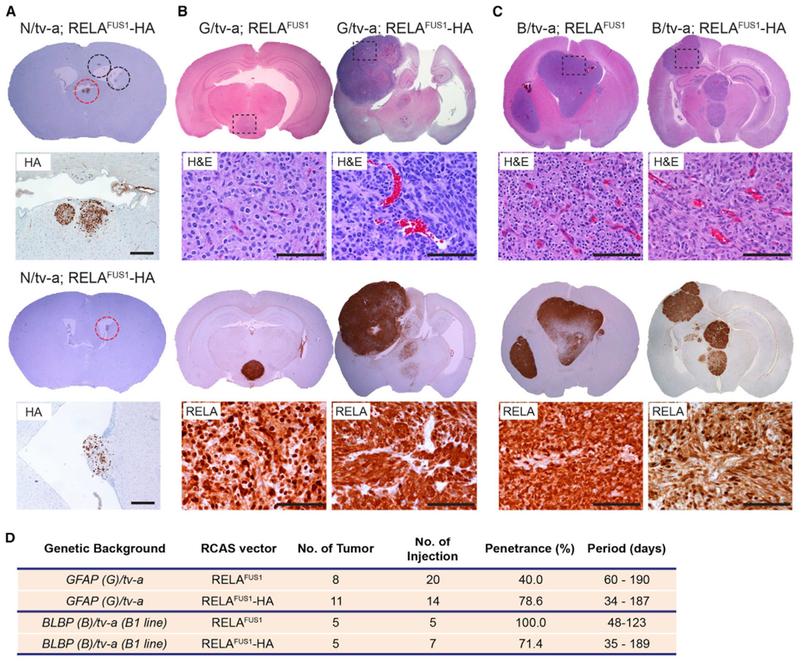
(A) Representative IHC images of the HA tag of RCAS-RELAFUS1-HA-induced brain tumors in N/tv-a mice (see also Figure S7E). Brain tumor formation was examined with HA tag staining 1 month post-injection. Dashed circles at the top show early lesions representing, essentially, RCAS vector expression. Red dashed circles denote the enlarged regions as shown at the bottom. Scale bars, 200 μm.
(B and C) Representative H&E and IHC images for RELA of RELAFUS1 or RELAFUS1-HA-induced brain tumors in GFAP(G)/tv-a (B) or BLBP(B)/tv-a mice (C). Enlarged areas for H&E and RELA are shown as a dashed box in each H&E brain. Scale bars, 100 μm.
(D) Summary of RCAS-RELAFUS1 or RELAFUS1-HA vector injections in G/tv-a or B/tv-a mice.
To further understand the cellular origin of ependymoma, we tested the capacity of mice harboring different tv-a transgenes to develop RELAFUS1-driven ependymoma. N/tv-a used in the experiments described above specifically targets nestin-expressing neural stem and progenitor cells. Therefore, we investigated the oncogenic potential of the RELAFUS1 gene in neonatal mouse brains when it is targeted to GFAP-expressing cells using (G)/tv-a- (Holland and Varmus, 1998) or BLBP (brain lipid binding protein, also known as fatty acid binding protein 7 or FABP7)-expressing cells using a (B)/tv-a transgenic mouse in which an expression of tv-a, a receptor for RCAS virus, was driven under a GFAP or BLBP promoter, respectively (Figures S7F–S7H). Tumors occurred in both of these transgenic lines with similar histologic features as those forming in the N/tv-a mice (or human ST-EPN) (Figures 7B and 7C; Table S1D). These data further support the notion that Nestin-, GFAP-, and BLBP-expressing neural stem and progenitor cells in the ventricular wall can serve as cells of origin of RELAFUS1-induced ST-ependymoma.
DISCUSSION
Unlike GBM with its multiple sequence and copy number alterations, the genome of human ST-EPN is relatively stable but contains a fusion gene that is sufficient to induce similar tumors in mice. Therefore, human ST-EPN may follow a single-hit oncogenesis model such as BCR-ABL-driven chronic myelogenous leukemia (CML) (Groffen et al., 1984). The oncogenic function of the RELA or YAP1 fusion products in ST-EPN is not yet known, and it may or may not be easily targeted with small molecules. Genetically accurate mouse models of this disease will certainly help with the development of such therapies should they become available.
The location of the cell of origin of RELAFUS1-EPN in the mouse seem to be at the edge of the subventrical zone (SVZ), consistent with what one might imagine for human ST-ependymoma. At this point, it is not clear whether the oncogenic function of this fusion protein occurs in the nucleus or cytoplasm. When it comes to the driving functions of the RELA fusion products, RELAFUS1 does have NF-κB activity, but it is worth noting that neither the individual components of or activated versions of RELA form ependymomas. Several lines of evidence suggest that the oncogenic driving functions of RELA fusion products may be more than aberrant NF-κB activity. We found that RELAFUS1 drives several other biological processes, including vesicular transport, development of cytokine production, and cell-cell adhesion. The importance of cell-cell adhesion in the oncogenic effect of RELAFUS1 is further underscored by a series of mutant forms of RELAFUS1, where expression programs affecting cell-cell adhesion specifically characterize mutants of this fusion oncogene. Further, only a subset of residues critical for RELA activity are essential for oncogenic activity of RELAFUS1. Finally, the amount of PDGF and its receptor induced by RELAFUS1 in murine ST-EPN are comparable with the amounts of these proteins sufficient to drive oncogenesis in RCAS/tv-a mouse models of gliomas. It therefore seems possible that at least part of the oncogenic effect of RELAFUS1 in the CNS includes induction of PDGF signaling.
Our model faithfully recapitulated the histologic features and molecular profile of human RELA fusion-positive ependymomas. However, given that RELA fusions were generated by a chromothripsis event on chromosome 11, the gene rearrangement might affect the status of other genes on the chromosome with various degrees. Therefore, although RELA fusion alone is sufficient to form brain tumors in mice, the molecular mechanism underlying RELA fusion driven-tumorigenesis in humans could be more complex and influenced by other altered neighboring genes.
The emerging data regarding this tumor type provides the potential for diagnostic tests that clearly distinguish these tumors from other glial neoplasms. Immunohistochemical analysis of tumors revealed strong nuclear-localized RELA staining in the RELAFUS-positive EPN and less nuclear or even nuclear-excluded RELA staining in the case of other ependymomas and gliomas. Obviously a more direct measure of the presence of RELAFUS would be RT-PCR for the various possible mRNAs encoding these fusion proteins. Of course, creating such a set of diagnostic tools would be much more compelling when a therapeutic strategy aimed at the RELAFUS1 gene product has been developed.
EXPERIMENTAL PROCEDURES
Human Tumor Samples and Patient Characteristics
Formalin-fixed paraffin-embedded (FFPE) human EPN samples (n = 120) were obtained from the Department of Pathology at the University of Washington (UW; Seattle, WA; n = 56), Kitasato University (Kanagawa, Japan; n = 51), and Kanazawa University (Kanazawa, Japan; n = 13). In addition, 30 samples of surgically resected World Health Organization (WHO) grade IV GBMs were retrieved from the University of Washington pathology archive and were utilized as control groups. These samples were diagnosed according to the WHO classification (Louis et al., 2016) and had IRB (institutional review board) approval at each institution (University of Washington; IR File 8305; Kanazawa University, 2015-010 [396]; Kitasato University, B13-191). Clinical and pathologic characteristics are summarized in Table S2A. Recurrent ependymomas were categorized in primary sites regardless of the recurrent location in this study. Several available frozen samples from Kitasato University were also used for RT-PCR detection of RELAFUS1 and RELAFUS2.
Generation of Murine Brain Tumors
All animal experiments were done in accordance with protocols approved by the Institutional Animal Care and Use Committees of Fred Hutchinson Cancer Research Center (FHCRC) and followed NIH guidelines for animal welfare. The RCAS/tv-a system used in this work has been described previously (Holland et al., 1998, 2000; Holland and Varmus, 1998; Ozawa et al., 2014). GFAP (G)/tv-a, Nestin (N)/tv-a (agouti), N/tv-a;Ink4a-Arf−/−;Ptenfl/fl, or BLBP (B)/tv-a mice were used for RCAS-mediated brain tumor formation in this study. Briefly, DF-1 cells were transfected with the indicated RCAS plasmid using X-tremeGENE 9 DNA transfection reagent (Roche) according to the manufacturer’s protocol. After checking RCAS expression with western blotting analysis, the cells (1 μL of 1 × 10⁵ cells) were injected into newborn pup brains (within 3 days after birth). The mice were monitored until they developed symptoms of disease, such as lethargy, poor grooming, weight loss, dehydration, macrocephaly, seizures, jumping, and paralysis, or until 6 months after injection. Cases that failed to wean due to severe hydrocephalus caused by injection trauma and an inflammatory response against DF-1 cells were excluded from this study. Mouse brains were then used for subsequent analyses such as survival analysis, immunohistochemistry, and RNA-seq. Kaplan-Meier analysis demonstrating symptom-free survival of murine brain tumors was performed using log rank test in the Prism 7 software (GraphPad) for all mice injected with the relevant RCAS virus. Log rank p values were measured with the Mantel-Cox test. A value of p < 0.05 was considered significant in this study.
H&E Staining and Immunohistochemistry
Mouse brains were paraffin-embedded, sectioned, and stained with H&E as described previously (Hambardzumyan et al., 2009; Holland et al., 2000). Immunohistochemical staining of mouse brains and human specimens was performed with an automated staining processor using the Discovery DAB Map Detection Kit according to standard protocols as described previously (Ventana Medical Systems, Tucson, AZ) (Hambardzumyan et al., 2008). For ambiguous cases, the staining was repeated and carefully examined. Human ST-ependymomas were stained at least twice. See also Supplemental Experimental Procedures.
Plasmids
All vectors used in this study are listed in Table S1E. The details of vector constructs are described in the Supplemental Experimental Procedures.
Western Blot Analysis
Cells were cultured, lysed, and processed for western blotting by standard methods. See also Supplemental Experimental Procedures.
RNA-Seq Analysis for Murine Brain Tumors and NIH 3T3T Cells
Tumor tissues and half normal forebrains were macroscopically dissected and quickly crushed in liquid nitrogen. Total RNAs for mouse tissues and NIH 3T3T cells were extracted with the RNeasy Mini Kit (QIAGEN) according to the manufacturer’s protocol and then labeled and amplified with the Illumina protocol, followed by sequencing on Illumina HiSeq2500 at the Genomics Shared Resource at FHCRC. RNA-seq reads were aligned to the University of California, Santa Cruz (UCSC) mm10 assembly using Tophat2 (Kim et al., 2013) and counted for gene associations against the UCSC genes database with HTSeq. Batch effects were corrected using the R function combat from the R package swamp (https://cran.r-project.org/web/packages/swamp/index.html). Log2 normalized data were used for subsequent principal-component analysis, MDS, and GSEA in R. Differential expression analysis was performed using the R/Bioconductor package limma (Ritchie et al., 2015). See also Supplemental Experimental Procedures.
Supplementary Material
Highlights.
RELAFUS1 causes formation of mouse tumors that recapitulate ST-ependymoma histology
The mouse tumors express a transcriptome similar to human ST-EPN-RELA tumors
RELAFUS1 induces other signaling pathways in addition to canonical NF-κB signaling
The ventricular wall is the putative location for ependymomagenesis of these tumors
ACKNOWLEDGMENTS
The research reported in this work was supported by the National Cancer Institute (NCI) of the NIH under award numbers U54 CA163167, R01 CA195718, U54 CA193461, R01 CA100688, U01 CA105492, U54 CA143798, T32 CA157323, P01CA96832, and R01CA129541; Cancer Research UK; the Mathile Foundation; and CureSearch. We thank James Yang, Jenny Zhang, and Deby Kumasaka for technical assistance; Denis Adair for secretarial assistance; the Genomics Shared Resource at the FHCRC for running the RNA-seq; Comparative Medicine at the FHCRC for mouse maintenance; Dr. Julio Vazquez in the Scientific Imaging facility at the FHCRC for the high-content imaging assay, Dr. Robert J. Hunter in the Transgenic Resources Program at the University of Washington for producing the B/tv-a mouse line, Dr. Chibawanye Ene for critical reading of the manuscript; and Dr. Koichi Ichimura, Dr. Syuzo Kaneko, and Dr. Ryuji Hamamoto at the National Cancer Center Research Institute in Japan and all members of the Holland laboratory for helpful discussions. The BLBP promoter sequence and pCAG-CAT-LSL-pA vector were kindly provided by Dr. David H Gutmann at Washington University and Dr. Kimi Araki at Kumamoto University, respectively. We reprinted the mouse image in the graphical abstract with permission from the Database Center for Life Science (DBCLS) in Japan (2016 DBCLS TogoTV/CC-BY-4.0).
Footnotes
DATA AND SOFTWARE AVAILABILITY
The accession numbers for the raw sequencing data and read count per gene data reported in this paper are SRA: SRP096964 and GEO: GSE93765, respectively. All codes in this study are available upon request.
SUPPLEMENTAL INFORMATION
Supplemental Information includes Supplemental Experimental Procedures, seven figures, and seven tables and can be found with this article online at https://doi.org/10.1016/j.celrep.2018.04.099.
DECLARATION OF INTERESTS
The authors declare no competing interests.
REFERENCES
- Bouffet E, and Foreman N (1999). Chemotherapy for intracranial ependymomas. Childs Nerv. Syst 15, 563–570. [DOI] [PubMed] [Google Scholar]
- Chamberlain MC (2003). Ependymomas. Curr. Neurol. Neurosci. Rep 3, 193–199. [DOI] [PubMed] [Google Scholar]
- Chen LF, and Greene WC (2004). Shaping the nuclear action of NF-kappaB. Nat. Rev. Mol. Cell Biol 5, 392–401. [DOI] [PubMed] [Google Scholar]
- Chen LF, Mu Y, and Greene WC (2002). Acetylation of RelA at discrete sites regulates distinct nuclear functions of NF-kappaB. EMBO J. 21, 6539–6548. [DOI] [PMC free article] [PubMed] [Google Scholar]
- Dai C, Celestino JC, Okada Y, Louis DN, Fuller GN, and Holland EC (2001). PDGF autocrine stimulation dedifferentiates cultured astrocytes and induces oligodendrogliomas and oligoastrocytomas from neural progenitors and astrocytes in vivo. Genes Dev 15, 1913–1925. [DOI] [PMC free article] [PubMed] [Google Scholar]
- Figarella-Branger D, Lechapt-Zalcman E, Tabouret E, Jünger S, de Paula AM, Bouvier C, Colin C, Jouvet A, Forest F, Andreiuolo F, et al. (2016). Supratentorial clear cell ependymomas with branching capillaries demonstrate characteristic clinicopathological features and pathological activation of nuclear factor-kappaB signaling. Neuro-oncol 18, 919–927. [DOI] [PMC free article] [PubMed] [Google Scholar]
- Fomchenko EI, Dougherty JD, Helmy KY, Katz AM, Pietras A, Brennan C, Huse JT, Milosevic A, and Holland EC (2011). Recruited cells can become transformed and overtake PDGF-induced murine gliomas in vivo during tumor progression. PLoS ONE 6, e20605. [DOI] [PMC free article] [PubMed] [Google Scholar]
- Gaspar N, Grill J, Geoerger B, Lellouch-Tubiana A, Michalowski MB, and Vassal G (2006). p53 Pathway dysfunction in primary childhood ependymomas. Pediatr. Blood Cancer 46, 604–613. [DOI] [PubMed] [Google Scholar]
- Godfraind C, Kaczmarska JM, Kocak M, Dalton J, Wright KD, Sanford RA, Boop FA, Gajjar A, Merchant TE, and Ellison DW (2012). Distinct disease-risk groups in pediatric supratentorial and posterior fossa ependymomas. Acta Neuropathol 124, 247–257. [DOI] [PMC free article] [PubMed] [Google Scholar]
- Groffen J, Stephenson JR, Heisterkamp N, de Klein A, Bartram CR, and Grosveld G (1984). Philadelphia chromosomal breakpoints are clustered within a limited region, bcr, on chromosome 22. Cell 36, 93–99. [DOI] [PubMed] [Google Scholar]
- Hambardzumyan D, Becher OJ, Rosenblum MK, Pandolfi PP, Manova-Todorova K, and Holland EC (2008). PI3K pathway regulates survival of cancer stem cells residing in the perivascular niche following radiation in medulloblastoma in vivo. Genes Dev 22, 436–448. [DOI] [PMC free article] [PubMed] [Google Scholar]
- Hambardzumyan D, Amankulor NM, Helmy KY, Becher OJ, and Holland EC (2009). Modeling Adult Gliomas Using RCAS/t-va Technology. Transl. Oncol 2, 89–95. [DOI] [PMC free article] [PubMed] [Google Scholar]
- Hoesel B, and Schmid JA (2013). The complexity of NF-κB signaling in inflammation and cancer. Mol. Cancer 12, 86. [DOI] [PMC free article] [PubMed] [Google Scholar]
- Holland EC, and Varmus HE (1998). Basic fibroblast growth factor induces cell migration and proliferation after glia-specific gene transfer in mice. Proc. Natl. Acad. Sci. USA 95, 1218–1223. [DOI] [PMC free article] [PubMed] [Google Scholar]
- Holland EC, Hively WP, DePinho RA, and Varmus HE (1998). A constitutively active epidermal growth factor receptor cooperates with disruption of G1 cell-cycle arrest pathways to induce glioma-like lesions in mice. Genes Dev. 12, 3675–3685. [DOI] [PMC free article] [PubMed] [Google Scholar]
- Holland EC, Celestino J, Dai C, Schaefer L, Sawaya RE, and Fuller GN (2000). Combined activation of Ras and Akt in neural progenitors induces glioblastoma formation in mice. Nat. Genet 25, 55–57. [DOI] [PubMed] [Google Scholar]
- Huang B, Yang XD, Lamb A, and Chen LF (2010). Posttranslational modifications of NF-kappaB: another layer of regulation for NF-kappaB signaling pathway. Cell. Signal. 22, 1282–1290. [DOI] [PMC free article] [PubMed] [Google Scholar]
- Johnson RA, Wright KD, Poppleton H, Mohankumar KM, Finkelstein D, Pounds SB, Rand V, Leary SE, White E, Eden C, et al. (2010). Cross-species genomics matches driver mutations and cell compartments to model ependymoma. Nature 466, 632–636. [DOI] [PMC free article] [PubMed] [Google Scholar]
- Kim D, Pertea G, Trapnell C, Pimentel H, Kelley R, and Salzberg SL (2013). TopHat2: accurate alignment of transcriptomes in the presence of insertions, deletions and gene fusions. Genome Biol 14, R36. [DOI] [PMC free article] [PubMed] [Google Scholar]
- Liberski PP (1996). The ultrastructure of ependymoma: personal experience and the review of the literature. Folia Neuropathol 34, 212–220. [PubMed] [Google Scholar]
- Louis DN, Perry A, Reifenberger G, von Deimling A, Figarella-Branger D, Cavenee WK, Ohgaki H, Wiestler OD, Kleihues P, and Ellison DW (2016). The 2016 World Health Organization Classification of Tumors of the Central Nervous System: a summary. Acta Neuropathol 131, 803–820. [DOI] [PubMed] [Google Scholar]
- Mack SC, Witt H, Piro RM, Gu L, Zuyderduyn S, Stütz AM, Wang X, Gallo M, Garzia L, Zayne K, et al. (2014). Epigenomic alterations define lethal CIMP-positive ependymomas of infancy. Nature 506, 445–450. [DOI] [PMC free article] [PubMed] [Google Scholar]
- Merchant TE, Li C, Xiong X, Kun LE, Boop FA, and Sanford RA (2009). Conformal radiotherapy after surgery for paediatric ependymoma: a prospective study. Lancet Oncol 10, 258–266. [DOI] [PMC free article] [PubMed] [Google Scholar]
- Mertens F, Johansson B, Fioretos T, and Mitelman F (2015). The emerging complexity of gene fusions in cancer. Nat. Rev. Cancer 15,371–381. [DOI] [PubMed] [Google Scholar]
- Mohankumar KM, Currle DS, White E, Boulos N, Dapper J, Eden C, Nimmervoll B, Thiruvenkatam R, Connelly M, Kranenburg TA, et al. (2015). An in vivo screen identifies ependymoma oncogenes and tumor-suppressor genes. Nat. Genet 47, 878–887. [DOI] [PMC free article] [PubMed] [Google Scholar]
- Otero JJ, Rowitch D, and Vandenberg S (2011). OLIG2 is differentially expressed in pediatric astrocytic and in ependymal neoplasms. J. Neurooncol 104, 423–438. [DOI] [PMC free article] [PubMed] [Google Scholar]
- Ozawa T, Riester M, Cheng YK, Huse JT, Squatrito M, Helmy K, Charles N, Michor F, and Holland EC (2014). Most human non-GCIMP glioblastoma subtypes evolve from a common proneural-like precursor glioma. Cancer Cell 26, 288–300. [DOI] [PMC free article] [PubMed] [Google Scholar]
- Pajtler KW, Witt H, Sill M, Jones DT, Hovestadt V, Kratochwil F, Wani K, Tatevossian R, Punchihewa C, Johann P, et al. (2015). Molecular Classification of Ependymal Tumors across All CNS Compartments, Histopathological Grades, and Age Groups. Cancer Cell 27, 728–743. [DOI] [PMC free article] [PubMed] [Google Scholar]
- Parker M, Mohankumar KM, Punchihewa C, Weinlich R, Dalton JD, Li Y, Lee R, Tatevossian RG, Phoenix TN, Thiruvenkatam R, et al. (2014). C11orf95-RELA fusions drive oncogenic NF-κB signalling in ependymoma. Nature 506, 451–455. [DOI] [PMC free article] [PubMed] [Google Scholar]
- Ritchie ME, Phipson B, Wu D, Hu Y, Law CW, Shi W, and Smyth GK (2015). limma powers differential expression analyses for RNA-sequencing and microarray studies. Nucleic Acids Res 43, e47. [DOI] [PMC free article] [PubMed] [Google Scholar]
- Rousseau E, Palm T, Scaravilli F, Ruchoux MM, Figarella-Branger D, Salmon I, Ellison D, Lacroix C, Chapon F, Mikol J, et al. (2007). Trisomy 19 ependymoma, a newly recognized genetico-histological association, including clear cell ependymoma. Mol. Cancer 6, 47. [DOI] [PMC free article] [PubMed] [Google Scholar]
- Rudà R, Gilbert M, and Soffietti R (2008). Ependymomas of the adult: molecular biology and treatment. Curr. Opin. Neurol 21, 754–761. [DOI] [PubMed] [Google Scholar]
- Taylor MD, Poppleton H, Fuller C, Su X, Liu Y, Jensen P, Magdaleno S, Dalton J, Calabrese C, Board J, et al. (2005). Radial glia cells are candidate stem cells of ependymoma. Cancer Cell 8, 323–335. [DOI] [PubMed] [Google Scholar]
- Tzaridis T, Milde T, Pajtler KW, Bender S, Jones DT, Müller S, Wittmann A, Schlotter M, Kulozik AE, Lichter P, et al. (2016). Low-dose Actinomycin-D treatment re-establishes the tumoursuppressive function of P53 in RELA-positive ependymoma. Oncotarget 7, 61860–61873. [DOI] [PMC free article] [PubMed] [Google Scholar]
- Verstegen MJ, Leenstra DT, Ijlst-Keizers H, and Bosch DA (2002). Proliferation- and apoptosis-related proteins in intracranial ependymomas: an immunohistochemical analysis. J. Neurooncol 56, 21–28. [DOI] [PubMed] [Google Scholar]
- Witt H, Mack SC, Ryzhova M, Bender S, Sill M, Isserlin R, Benner A, Hielscher T, Milde T, Remke M, et al. (2011). Delineation of two clinically and molecularly distinct subgroups of posterior fossa ependymoma. Cancer Cell 20, 143–157. [DOI] [PMC free article] [PubMed] [Google Scholar]
Associated Data
This section collects any data citations, data availability statements, or supplementary materials included in this article.