

Abstract
Control of goal-directed tasks is putatively carried out via the cinguloopercular (CO) and frontoparietal (FP) systems. However, it remains unclear whether these systems show dissociable moment-to-moment processing during distinct stages of a trial. Here, we characterize dynamics in the CO and FP networks in a meta-analysis of 5 decision-making tasks using fMRI, with a specialized “slow reveal” paradigm which allows us to measure the temporal characteristics of trial responses. We find that activations in left FP, right FP, and CO systems form separate clusters, pointing to distinct roles in decision-making. Left FP shows early “accumulator-like” responses, suggesting a role in pre-decision processing. CO has a late onset and transient response linked to the decision event, suggesting a role in performance reporting. The majority of right FP regions show late onsets with prolonged responses, suggesting a role in post-recognition processing. These findings expand upon past models, arguing that the CO and FP systems relate to distinct stages of processing within a trial. Furthermore, the findings provide evidence for a heterogeneous profile in the FP network, with left and right FP taking on specialized roles. This evidence informs our understanding of how distinct control networks may coordinate moment-to-moment components of complex actions.
Keywords: decision-making, executive control, fMRI, networks
Introduction
The coordination of complex behaviors in the service of high-level goals is essential to many daily functions in humans, ranging from making a cup of coffee to planning for retirement. Abundant functional neuroimaging and lesion data imply that producing these behaviors involves a large number of disparate brain regions, including putative executive “control” regions in lateral and medial prefrontal cortex (Duncan and Owen 2000; Miller and Cohen 2001; Badre and D'Esposito 2007; Koechlin and Summerfield 2007; Dosenbach et al. 2008; Stuss 2011; Fedorenko et al. 2013).
One line of evidence from task and resting-state data (Dosenbach et al. 2006, 2007, 2008) suggests that these putative control regions may be divisible into (at least; Power and Petersen 2013) 2 distinct systems or networks: the cinguloopercular (CO) network and the frontoparietal (FP) network. The core of the CO network is composed of regions in the anterior insula/frontal operculum and dorsal anterior cingulate. The FP network is composed primarily of regions in bilateral dorsal prefrontal and frontal cortex and bilateral dorsal parietal cortex along the intraparietal sulcus and inferior parietal lobule. These networks segregate at rest (Dosenbach et al. 2008; Power et al. 2011; Power and Petersen 2013) and respond independently to focal brain lesions (Nomura et al. 2010). Initial evidence from a meta-analysis of task data argued that the CO and FP networks also have different functional roles (Dosenbach et al. 2006, 2008). Specifically, CO network responses are sustained throughout a task and show enhanced responses at task initiation and when task performance is not optimal (such as when errors are committed). The FP network, instead, was suggested to play a role in trial-specific adaptive control: regions in the FP network respond to errors and task initiation, but responses are not sustained throughout task engagement.
These characterizations are bolstered by more recent studies of the activation of the CO and FP networks across different task (Dubis et al. 2016; Sestieri et al. 2014) and trial types (Neta et al. 2014, 2015; Sadaghiani and D'Esposito 2015; Wallis et al. 2015). The CO network responds separately to various performance-related signals, including errors, ambiguity, and reaction time (Neta et al. 2014), suggesting a role in performance reporting when adjustments are required by the task. Moreover, although both the CO and FP networks show error-related (Wheeler et al. 2008; Neta et al. 2015) and cue-related responses (depends on cue type, Wallis et al. 2015), they do so with different characteristic timecourses, implying dissociable processing of these events. In addition to distinctions between CO and FP systems, other findings suggest that the expansive FP system may show heterogeneous responses that differ between the 2 hemispheres (Wang et al. 2014; Neta et al. 2015). These findings are consistent with data from lesion patients showing that lesions to left lateral frontal, medial frontal, and right lateral frontal cortex produce distinct behavioral deficits (Stuss and Alexander 2007; Stuss 2011), implicating these regions in different functions.
This body of work argues that the CO and FP networks make separate contributions to task control as a whole. However, transient, trial-level activation of both the CO and FP networks is among the most ubiquitous across tasks, appearing in trials from a wide variety of different studies and paradigms (Nelson et al. 2010; Sestieri et al. 2014). Therefore, it remains unclear whether the CO and FP networks make distinct contributions to transient moment-to-moment processing within correct trials. Some insight into this question may come from a parallel line of research (Wheeler et al. 2008; Ploran et al. 2007, 2011) which has suggested that regions spread across a number of systems, including the CO and FP networks, show dissociable responses in decision-making. Responses in some regions of the FP, dorsal attention, and visual processing systems were related to “evidence accumulation,” or the process of gradually collecting information toward a decision, and responses in some CO network regions appeared as more control-related “moment of recognition” signals, tightly locked to the time a decision is reached.
Here, we use data from 5 separate decision-making tasks (Ploran et al. 2007, 2011; Wheeler et al. 2008) to examine these differences in more detail. Specifically, we ask: do the CO and FP networks show separable activation profiles within correct trials, and are these differences generalizable across 5 different tasks? If so, how are these profiles connected to control and processing demands in decision-making and, thereby, the theoretical roles of the CO and FP networks? And finally, how uniform are the activation profiles within each network?
To address these questions, the 5 tasks use a specialized “slow reveal” paradigm in which a stimulus is gradually displayed over the course of 16 s, permitting us to dissociate processes related to different stages of decision-making that occur across the course of a trial, despite the relatively coarse temporal resolution of fMRI. Importantly, the tasks varied in stimulus modality (picture, word), decision type (object recognition, recognition memory, word recognition), and method of reveal (jittered pixel mask, gradual unmasking from noise, and gradual letter by letter unmasking; see Fig. 1A), allowing us to examine the consistency of our findings to varied decision-making contexts.
Figure 1.
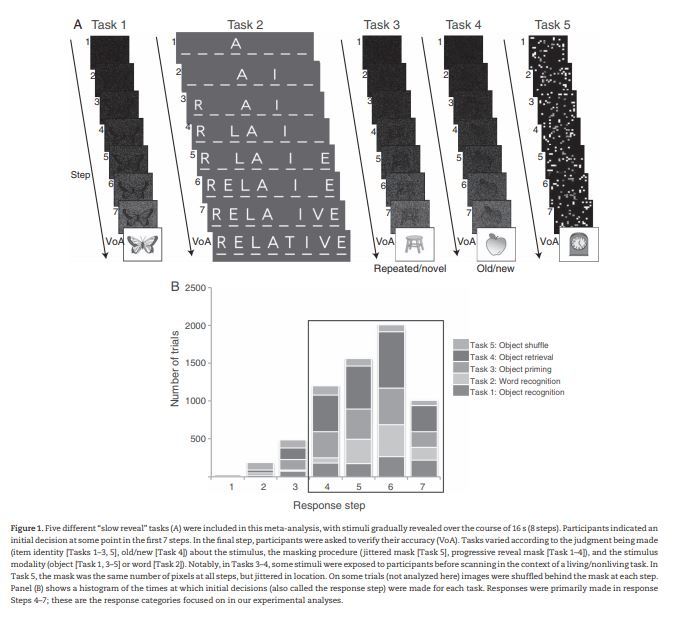
Five different “slow reveal” tasks (A) were included in this meta-analysis, with stimuli gradually revealed over the course of 16 s (8 steps). Participants indicated an initial decision at some point in the first 7 steps. In the final step, participants were asked to verify their accuracy (VoA). Tasks varied according to the judgment being made (item identity [Tasks 1–3, 5], old/new [Task 4]) about the stimulus, the masking procedure (jittered mask [Task 5], progressive reveal mask [Task 1–4]), and the stimulus modality (object [Task 1, 3–5] or word [Task 2]). Notably, in Tasks 3–4, some stimuli were exposed to participants before scanning in the context of a living/nonliving task. In Task 5, the mask was the same number of pixels at all steps, but jittered in location. On some trials (not analyzed here) images were shuffled behind the mask at each step. Panel (B) shows a histogram of the times at which initial decisions (also called the response step) were made for each task. Responses were primarily made in response Steps 4–7; these are the response categories focused on in our experimental analyses.
We found that, while regions across the CO and FP networks showed decision-making-related activations, they did so with distinct timecourses. Regions in the CO network showed transient responses linked to the moment of decision. In contrast, we found novel evidence that the FP network showed 2 distinct types of responses—regions in the L FP had early onset, gradual responses that appeared related to evidence accumulation, whereas regions in the R FP showed late onset, prolonged responses that may be related to response re-evaluation. These findings provide new insight into the functions of the CO and FP systems in moment-to-moment processing, which expands our understanding of their roles in task control.
Methods
Participants
This study includes data from 5 separate slow reveal decision-making tasks conducted either at the University of Pittsburgh or Washington University (see Table 1). This aggregation of data resulted in 92 sessions from a cumulative 56 healthy, typically developed, young adult subjects (29 females; the same 13 participants completed Tasks 1 and 2, and 23 participants completed both Tasks 3 and 4) ranging from 19 to 30 years old (see Table 1 for breakdown by task). A few participants were excluded from each task due to excessive motion, technical acquisition issues, failure to comply with the task, or too few trials in relevant conditions (Task 1–2: 5 participants; Task 3: 13 participants; Task 4: 11 participants; Task 5: 2 participants). Written informed consent was obtained from all participants, and participants were compensated monetarily for their participation. Procedures were approved by the Institutional Review Boards at the University of Pittsburgh (Tasks 1, 2, and 5) or Washington University (Tasks 3–4).
Table 1.
Properties of the 5 experiments used in meta-analysis
| Experiment | Task 1: Object identification | Task 2: Word identification | Task 3: Object priming | Task 4: Object retrieval | Task 5: Object shuffle |
|---|---|---|---|---|---|
| Original publication | Ploran et al. (2007); Wheeler et al. (2008) | n/a | n/a | n/a | Ploran et al. (2011) |
| Stimuli | Object images | Words | Object images | Object images | Object images |
| Task | Object identification | Word identification | Object identification | Old/new item recognition | Object identification |
| Reveal method | Gradual dissolve | Gradual letter reveal | Gradual dissolve | Gradual dissolve | Jittered mask |
| No. of subjects | 13 (8 F) | 13 (8 F; same as 1) | 24 (12 F) | 26 (13 F; 23 same as 3) | 16 (8 F) |
| Ages (mean) | 20–30 (25) | 20–30 (25) | 21–29 (26) | 21–29 (26) | 19–31 (23) |
| No. of trials/subject | 100 | 100 | 80 | 120 | 90 (102 in N = 2) nonshuffle trials |
| Accuracy (Steps 4–7) | 87% | 82% | 87% | 87% | 68% |
| Scanner | 3T (Allegra, Pitt) | 3T (Allegra, Pitt) | 3T (Trio, WashU) | 3T (Trio, WashU) | 3T (Trio, Pitt) |
| Anatomical scan [TR/TE/FA/TI] | 1540 ms/3.04 ms/8°/800 ms | 1540 ms/3.04 ms/8°/800 ms | 2400 ms/3.08 ms/8°/1000 ms | 2400 ms/3.08 ms/8°/1000 ms | 2200 ms /3.29 ms/9°/1000 ms |
| Functional scans [TR/TE/FA/ res/slices] | 2000 ms/30 ms/79°/3.2 × 3.2 × 3.2 mm/35 | 2000ms/30 ms/79°/3.2 × 3.2 × 3.2 mm/35 | 2000 ms/27 ms/90°/4 × 4 × 4 mm/32 | 2000 ms/27 ms/90°/4 × 4 × 4 mm/32 | 2000 ms/30 ms/79°/3.2 × 3.2 × 3.2 mm/38 |
TR, repetition time (ms), TE, echo time (ms), FA, flip angle (degrees), TI, inversion time (ms); res, voxel resolution (mm); slices, number of slices.
Tasks
In each experiment, stimuli were slowly revealed over the course of 16 s (see Fig. 1A for schematic from each task type). Experiments varied in the stimulus type (Tasks 1 and 3–5: grayscale object images; Task 2: 8 letter words), the task that participants were completing (Task 1, 3, and 5: object identification; Task 2: word identification; Task 4: old/new item recognition), and method with which items were revealed (Task 1, 3, 4: gradual dissolve; Task 2: gradual letter reveal; Task 5: randomly jittered mask). In each task, participants were first asked to press a button at the time that they were able to make a decision about the stimulus (regardless of the actual decision). The timing of this first response was used to bin activations in analysis. At the end of the trial, the item was fully revealed and participants were asked to press a button again to either verify whether their previous decision was correct (Tasks 1–3 and 5, referred to as verification of accuracy or VoA) or to repeat their old/new judgment (Task 4). A subset of these tasks has been reported in previous publications (Task 1: Ploran et al. 2007; Wheeler et al. 2008, Task 5: Ploran et al. 2011). See Table 1 for details on each task.
Image Acquisition
All tasks were acquired on a 3T scanner at either the University of Pittsburgh (a Siemens Allegra or Trio) or Washington University (a Siemens Trio). All anatomical images were acquired using a T1-weighted MPRAGE sequence. Functional images were acquired with a Blood Oxygen Level Dependent (BOLD) contrast-sensitive scan using a spin-echo echo-planar (Tasks 1, 2, and 5) or a gradient echo echo-planar (Tasks 3–4) T2*-weighted pulse sequence. See Table 1 for specific scan parameters and details reported in Ploran et al. (2007) (Task 1; Task 2 also had the same scan parameters as Task 1), and Ploran et al. (2011) (Task 5). The first 3–4 volumes from each functional imaging run were discarded to allow the scanner magnetization to reach steady state.
Imaging Analysis
Preprocessing
A number of automated steps were undertaken to reduce noise and artifacts for all studies in this meta-analysis. These included 1) motion correction within and across runs using a rigid body algorithm (Snyder 1996), 2) whole-brain intensity normalization to a mode of 1000 to allow for inter-subject comparisons (Ojemann et al. 1997), 3) temporal realignment of slices to midpoint of first slice using sinc-interpolation to account for slice acquisition time, and 4) resampling to 2 mm isotropic space and transformation to a stereotaxic atlas (Talairach and Tournoux 1988). Atlas registration involved aligning a subject's anatomical image with a custom atlas-transformed target template using a series of affine transforms (Lancaster et al. 1995; Snyder 1996).
General Linear Model
A general linear model (GLM) was used to model the BOLD response in individual voxels for each subject for task events (Friston et al. 1994; Miezin et al. 2000). Modeling was conducted using in-house imaging software written in IDL [Research Systems, Inc.]. The GLM included a linear trend and constant term for each run to remove baseline and drift effects. Individual timepoints from each trial type were modeled using delta functions. Trials lasted 8 TRs (16 seconds), and 16 timepoints (32 s) were modeled per trial to capture the full extent of the BOLD response. Note that this approach makes no assumptions about the shape of the hemodynamic response (Ollinger, Corbetta et al. 2001; Ollinger, Shulman et al. 2001), allowing us to analyze variability in response shapes as well as response magnitudes. Effects expressed as percent signal change were derived by dividing the magnitude of activation for the relevant trial type by the baseline term for each run.
For each participant, trials were modeled separately based on participants' response step (binned by whether they responded during TR 1-7; also called the moment of decision) and accuracy (correct or incorrect; self-reported at VoA for Tasks 1–3 and 5 and based on old/new judgment for Task 4). Responses occurring during the final VoA period were coded separately and not analyzed. In addition, in Task 3 and 4, trials were further coded based on whether they had previously been seen in an encoding task (this difference was collapsed over in our analysis). Response step bins were combined if too few trials (<2 total trials for a subject) were present in a given step (as was generally the case for early response steps, i.e., 1–3, but did not occur for any of the response steps we analyzed in detail).
Fixed-Effects Analysis
For each task, data were aggregated across participants in a second-level repeated-measures ANOVA with factors of timepoint (1–16) and response step (4–7; we selected these steps since the majority of participants' responses occurred in this period across all 5 tasks; see Fig. 1B and (Ploran et al. 2007)). Only correct trials were examined. Data were smoothed at this stage (4 mm). This analysis yielded an interaction F map that showed responses with different timecourses for different response steps, highlighting regions involved in the decision-making process. The interaction F-map was then transformed into a z-score map. Z-maps were combined in a fixed-effects analysis by taking the mean across maps from the 5 tasks analyzed in this meta-analysis (see Fig. 2A).
Figure 2.
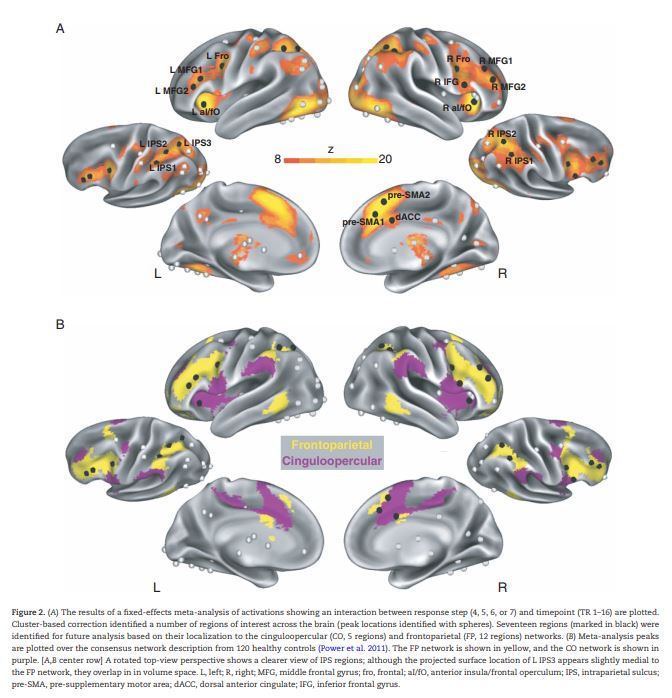
(A) The results of a fixed-effects meta-analysis of activations showing an interaction between response step (4, 5, 6, or 7) and timepoint (TR 1–16) are plotted. Cluster-based correction identified a number of regions of interest across the brain (peak locations identified with spheres). Seventeen regions (marked in black) were identified for future analysis based on their localization to the cinguloopercular (CO, 5 regions) and frontoparietal (FP, 12 regions) networks. (B) Meta-analysis peaks are plotted over the consensus network description from 120 healthy controls (Power et al. 2011). The FP network is shown in yellow, and the CO network is shown in purple. [A,B center row] A rotated top-view perspective shows a clearer view of IPS regions; although the projected surface location of L IPS3 appears slightly medial to the FP network, they overlap in in volume space. L, left; R, right; MFG, middle frontal gyrus; fro, frontal; aI/fO, anterior insula/frontal operculum; IPS, intraparietal sulcus; pre-SMA, pre-supplementary motor area; dACC, dorsal anterior cingulate; IFG, inferior frontal gyrus.
A second, mixed-effects meta-analysis approach was used to confirm these results. In the mixed-effects analysis, individual maps from the timepoint by response step interaction in each study were thresholded (Z > 3.0). The resultant binary images were summed across studies. This approach produced analogous results to the fixed-effects analysis (see overlay of fixed-effects peaks with mixed-effects results in Supplementary Fig. 1).
Region of Interest Definition
Potential regions of interest from the fixed effect map were identified by growing regions around peak voxels using an algorithm developed by Abraham Snyder (Wheeler et al. 2006). This analysis yielded 69 peak regions across the brain (shown as spheres projected onto the surface in Fig. 2). We then selected peaks that overlapped with the CO (5) or FP (12) networks using networks defined in 120 healthy controls (Power et al. 2011). We centered 10 mm spheres on these peak coordinates, creating regions of interest (ROIs) that we examined in detail in our subsequent analyses (note that while these ROIs may correspond to putative functional areas, given potential spatial smearing of responses we treat them here simply as measures of central tendency in response activations). Network overlap was determined by examining the position of our ROIs in the volume-space data with respect to volume-space representation of the networks (the surface representations shown in Fig. 2 are 2-D projections of the network overlap that exists in 3-D volume space and therefore may not always correspond precisely with the original ROI and network locations, particularly for ROIs that appear along borders). We confirmed that ROIs along the border of the FP or CO networks (i.e., IPS regions, preSMA regions) displayed a functional connectivity pattern consistent with the labeled network using resting-state data from the same group of 120 healthy controls (Power et al. 2011). Selected regions are shown as black spheres in Figure 2. Peak coordinates and network assignments from these regions are shown in Table 2.
Table 2.
The properties of FP and CO regions showing an interaction between response step and timepoint in the meta-analysis of our 5 tasks
| ROI | Coordinates (MNI, x y z) | Network assignment | Cluster | Response profile |
|---|---|---|---|---|
| L IPS 1 | −42 −41 45 | FP | Blue | Early, accumulator-like |
| L IPS 2 | −32 −50 45 | FP | Blue | Early, accumulator-like |
| L IPS 3 | −24 −67 49 | FP | Blue | Early, accumulator-like |
| L Frontal | −43 4 33 | FP | Blue | Early, accumulator-like |
| L MFG 1 | −45 25 22 | FP | Blue | Early, accumulator-like |
| L MFG 2 | −43 34 14 | FP | Blue | Early, accumulator-like |
| R IPS 2 | 32 −53 49 | FP | Blue | Early, accumulator-like |
| R Frontal | 44 9 28 | FP | Blue | Early, accumulator-like |
| R IPS 1 | 44 −45 50 | FP | Red | Late, prolonged |
| R IFG | 53 15 16 | FP | Red | Late, prolonged |
| R MFG 1 | 44 32 30 | FP | Red | Late, prolonged |
| R MFG 2 | 43 42 18 | FP | Red | Late, prolonged |
| L aI/fO | −31 25 −1 | CO | Green | Late, transient |
| R aI/fO | 33 26 1 | CO | Green | Late, transient |
| pre-SMA1 | 1 15 51 | CO | Green | Late, transient |
| Pre-SMA2 | 7 24 37 | CO | Green | Late, transient |
| dACC | 1 8 32 | CO | Black | Late, transient, small magnitude |
Hierarchical Clustering Analysis
A hierarchical clustering analysis was used on this group of ROIs to identify regions showing similar activation profiles during these decision-making tasks (Cordes et al. 2002; Salvador et al. 2005; Ploran et al. 2007; Neta et al. 2015). Timecourses from trials with responses at 4 different steps (4, 5, 6, and 7) were averaged across tasks and subjects creating a single 16-TR timecourse for each response step in each region. These averaged timecourses were then concatenated, resulting in a 64-point vector for each region. The distances between the concatenated timecourses from all 17 regions were calculated by taking a “1 − r” calculation. These distances were submitted to a UPGMA (unweighted paired group method with arithmetic mean; Handl et al. 2005) hierarchical clustering algorithm in Matlab R2012a (7.14, [The Mathworks; Natick, MA]). This algorithm unites clusters at each step based on the average distance between all points within each cluster. A cophenetic correlation coefficient (cophenetic r) was calculated on the final dendrogram to evaluate how well this hierarchical representation modeled the original similarity among timecourses. A separate modularity analysis (Newman 2006) of the linkage graph was used to determine objectively where to cut the graph (i.e., how many clusters were present; Neta et al. 2015). Maximal modularity was seen for structures with 4 clusters in the linkage graph.
An additional clustering analysis was also included to test the robustness of results across response steps. In this analysis, clustering was conducted separately on each response step. Apart from the input data, all clustering procedures were kept identical to those described above. A confusion matrix was then used to summarize the consistency of clustering results across iterations, by counting the number of times that a region was clustered together with another region.
Response Shape Characterization
We next examined the timecourse profiles for each identified cluster by calculating a set of parameters to characterize the observed response shapes (following the methods in Ploran et al. 2007). Linear interpolation was used to expand the 16 TRs from each response step timecourse into 16 000 data points. The resultant interpolated timecourses were used to calculate 4 timecourse parameters: time to response onset (“onset”), time to peak (“peak”), full-width half maximum of the response (“FWHM”), and time to response offset (“offset”). Onset was calculated as the time at which 50% of the peak amplitude of response was initially reached (stepping back from the peak), peak was calculated as the time at which the timecourse reached its peak amplitude, and offset was calculated as the time at which 50% of the peak amplitude was reached (stepping forward from the peak). FWHM was taken as the difference between offset and onset. This linear interpolation and response characterization approach was chosen over explicitly modeling the shape of timecourses to allow for more faithful representation of the variety of timecourse shapes that we observed (Ploran et al. 2007).
Timecourse parameters were estimated for each ROI in a cluster, and statistical analyses comparing parameters for ROIs from different clusters were carried out in SPSS [version 22] using the Repeated Measures functions. First, a top-level ANOVA with within-group factors of response step (4, 5, 6, or 7) and parameter (Onset, Peak, FWHM, and Offset) and between-group factor of cluster (Left FP, CO, Right FP) was conducted to provide a quantitative description of the cluster differences. Next, separate (4) second-level ANOVAs were conducted for each parameter to characterize which parameters were associated with differences between the clusters. A within-group factor of response step (4, 5, 6, or 7) and a between-group factor of cluster (Left FP, CO, Right FP) were included in these ANOVAs. Significant cluster main effects were compared post hoc using t-tests.
In addition, timecourses from each condition were averaged across ROIs in each cluster and then were normalized by dividing all values by the peak amplitude of that timecourse to emphasize differences in the timing of responses above and beyond amplitude-based differences.
Results
Behavioral Responses Were Distributed Across 4 Timepoints of the Trial
Figure 1B displays the distribution of correct responses across the 7 potential response steps for all participants. A very similar distribution was seen for the average number of correct responses at each step per subject. Most responses occurred at Steps 4–7; therefore, we focused our analyses on these steps (Ploran et al. 2007).
A Number of Regions Show Response-dependent Activity in This Task, Many of Which Localize to the Frontoparietal and Cinguloopercular Control Networks
To identify response step-dependent activation over the course of a trial, we computed an ANOVA interaction map between factors of response step (4–7) and time (TR 1-16) for each task. These results were then input into a fixed-effects analysis to identify activations that were consistent across tasks (Fig. 2A). From the resultant fixed-effects map, we identified 69 regions with response step-dependent activation across the brain (spheres in Fig. 2A). Seventeen of these regions (shown in black in Fig. 2) overlapped with FP and CO control networks. These regions were distributed across frontal, parietal, and cingulate cortex in both hemispheres. These 17 regions were selected for further analyses examining the relative contributions of CO and FP networks to different components of the trial. The coordinates and other relevant information from each selected region can be seen in Table 2.
Distinct Response Profiles Are Seen in CO, Left FP, and Right FP Regions
For each selected region, we concatenated the average timecourse (across tasks) from trials associated with different response steps (4–7). We conducted a hierarchical clustering analysis on these concatenated timecourses and found that control regions segregated into 4 clusters (see Fig. 3A,B): 1) a cluster in blue composed primarily of regions in the left hemisphere of the FP network (Left FP cluster; L IPS 1, L IPS 2, L IPS 3, L Frontal, L MFG1, L MFG2, R Frontal, and R IPS 2; L = left, R = right, IPS = intraparietal sulcus, MFG = middle frontal gyrus), 2) a cluster in red composed of the majority of regions in the right hemisphere of the FP network (Right FP cluster; R IPS 1, R IFG, R MFG1, and R MFG2; IFG = inferior frontal gyrus), 3) a cluster in green composed of regions in the CO network (CO cluster; R aI/fO, L aI/fO, preSMA1, and preSMA2; aI/fO = anterior insula/frontal operculum, preSMA = supplementary motor area), and 4) a final cluster in black composed of a single region (dorsal anterior cingulate cortex or dACC cluster) from the CO network. The cophenetic correlation of the dendrogram was high (cophenetic r = 0.80), indicating that the clustering dendrogram represented the similarity between timecourses.
Figure 3.
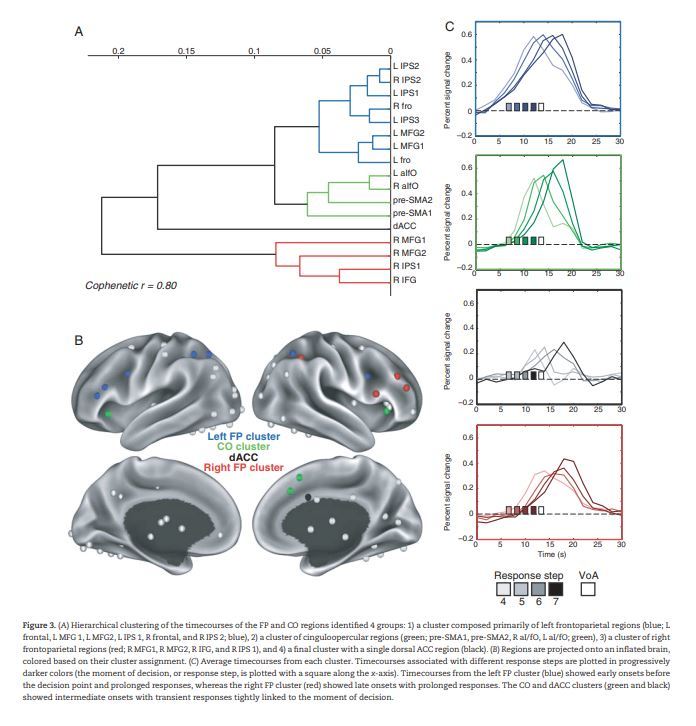
(A) Hierarchical clustering of the timecourses of the FP and CO regions identified 4 groups: 1) a cluster composed primarily of left frontoparietal regions (blue; L frontal, L MFG 1, L MFG2, L IPS 1, R frontal, and R IPS 2; blue), 2) a cluster of cinguloopercular regions (green; pre-SMA1, pre-SMA2, R aI/fO, L aI/fO; green), 3) a cluster of right frontoparietal regions (red; R MFG1, R MFG2, R IFG, and R IPS 1), and 4) a final cluster with a single dorsal ACC region (black). (B) Regions are projected onto an inflated brain, colored based on their cluster assignment. (C) Average timecourses from each cluster. Timecourses associated with different response steps are plotted in progressively darker colors (the moment of decision, or response step, is plotted with a square along the x-axis). Timecourses from the left FP cluster (blue) showed early onsets before the decision point and prolonged responses, whereas the right FP cluster (red) showed late onsets with prolonged responses. The CO and dACC clusters (green and black) showed intermediate onsets with transient responses tightly linked to the moment of decision.
In addition, a supplementary approach was adopted to examine the robustness of our clustering results across individual response step subsamples of our data. Despite the smaller amounts of data, and despite allowing both the clustering assignment and number of clusters to be decided in a data-driven fashion, regions were grouped in broadly the same fashion in these subsamples as we report above for the dataset as a whole (including, in particular, separate clustering of the R FP and L FP systems). These findings are reported in detail in Supplementary Figure 2.
Average timecourses from each cluster for the different response steps are shown in Figure 3C. As expected from the clustering results, timecourse profiles appeared to vary by cluster. The L FP cluster (blue) showed early onset, gradual activations with peaks that varied linearly with decision time, peaking around the moment of decision (if an ∼5–6 s hemodynamic lag is assumed; Friston et al. 1994; Henson and Friston 2011), with higher accumulation slopes when decisions were made earlier. The CO and dACC clusters (green and black, respectively) showed late onset and relatively transient activations closely locked to the time of response. Finally, the right FP cluster (red) showed delayed onset (post-response) and prolonged activations. These timecourses within each cluster were similar for individual regions (see Supplementary Fig. 3) and for individual tasks (see Supplementary Fig. 4), with the potential exception of the dACC (single-node) cluster. We quantified differences between the timecourse profiles in more detail in the following analyses.
Response Profiles Differ in Their Onset Times and Transience
To compare the shapes of the temporal profiles across clusters irrespective of amplitude, trials were grouped by cluster, sorted by response step, and normalized to remove amplitude differences (displayed in Fig. 4A). The previously described differences in timecourse shapes between the left FP, right FP, and CO/dACC clusters are emphasized in these normalized timecourses and appear consistent across the 4 response steps.
Figure 4.
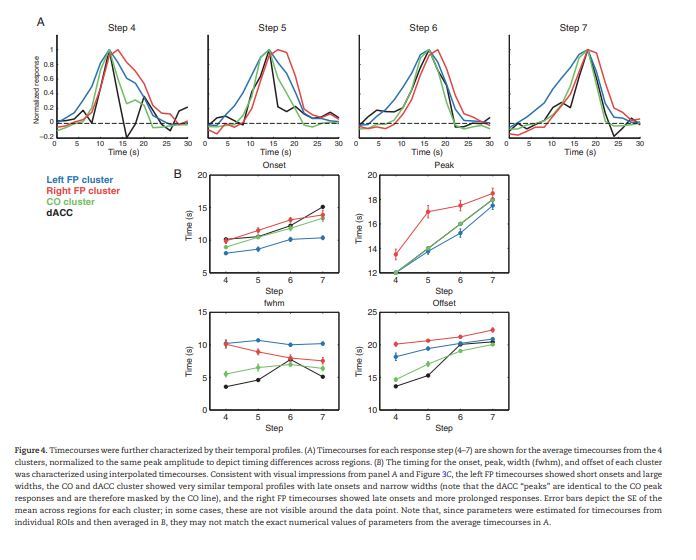
Timecourses were further characterized by their temporal profiles. (A) Timecourses for each response step (4–7) are shown for the average timecourses from the 4 clusters, normalized to the same peak amplitude to depict timing differences across regions. (B) The timing for the onset, peak, width (fwhm), and offset of each cluster was characterized using interpolated timecourses. Consistent with visual impressions from panel A and Figure 3C, the left FP timecourses showed short onsets and large widths, the CO and dACC cluster showed very similar temporal profiles with late onsets and narrow widths (note that the dACC “peaks” are identical to the CO peak responses and are therefore masked by the CO line), and the right FP timecourses showed late onsets and more prolonged responses. Error bars depict the SE of the mean across regions for each cluster; in some cases, these are not visible around the data point. Note that, since parameters were estimated for timecourses from individual ROIs and then averaged in B, they may not match the exact numerical values of parameters from the average timecourses in A.
To compare response shapes in a quantitative fashion, we measured 4 aspects of each timecourse: the time to onset, time of peak, full-width half maximum (FWHM), and time to offset for each timecourse. Cluster averages are shown in Figure 4B for each response step. ROI parameter values were analyzed in a parameter (onset, peak, FWHM, and offset) × response step (4–7) ANOVA with a between-group factor of cluster (Left FP, Right FP, CO). Note that the dACC cluster was omitted from this and the following analyses since only one region was present in this cluster (visual inspection of Fig. 4B suggests that it had parameters analogous to the CO cluster). As expected given their separation in the clustering analysis, the clusters differed reliably in their timecourses (F2,13 = 29.34, P < 0.001). There was also a significant cluster × parameter interaction (F6,117 = 27.94, P < 0.001) and interactions with response step for each of these factors (cluster × response step: F6,117 = 8.31, P < 0.001; cluster × parameter × response step: F18,117 = 3.48, P < 0.001). To determine what timecourse parameters were associated with these differences, we next conducted post hoc ANOVAs for each parameter separately. Significant effects of cluster and interactions between response step and cluster were found for each parameter (all P < 0.005; see Table 3 for a summary).
Table 3.
This table reports the main effects and interaction results of mixed-effects ANOVAs conducted separately on each timecourse parameter, with within-group factor of step (4, 5, 6, or 7) and between-group factor of cluster (Left FP, CO, Right FP)
| Cluster (main) | Step × Cluster | Significant pairwise relationships | |
|---|---|---|---|
| Onset | F2,13 = 19.66, P < 0.001 | F6,39 = 4.72, P < 0.005 | Left FP < Right FP Left FP < CO |
| Peak | F2,13 = 19.93, P < 0.001 | F6,39 = 3.95, P < 0.005 | Left FP < Right FP CO < Right FP |
| FWHM | F2,13 = 41.47, P < 0.001 | F6,39 = 4.15, P < 0.005 | CO < Left FP CO < Right FP Right FP < Left FP |
| Offset | F2,13 = 31.60, P < 0.001 | F6,39 = 6.42, P < 0.001 | CO < Left FP CO < Right FP Left FP < Right FP |
As expected given their separation in the clustering analysis, a higher level mixed-effects ANOVA, with the additional within-group factor of parameter (Onset, Peak, FWHM, and Offset), had significant effects of cluster. In addition, there was a significant step × cluster effect, as well as interactions with parameter for each of these effects (see Results). The final column reports significant pairwise relationships (P < 0.05) found in post hoc t-tests from the parameter-level ANOVAs (see Results for specific statistics).
The data presented in Figure 4B suggest that these effects were driven by 3 factors. First, the left FP cluster timecourses had the earliest onsets, peaked linearly with decision time, near the moment of decision (assuming an ∼6 s hemodynamic delay; Friston et al. 1994; Henson and Friston 2011), and displayed extended responses (i.e., a large FWHM). Second, the CO/dACC cluster timecourses had a late onset time combined with a transient response (i.e., low FWHM), with early peaks and early offsets. Third, the right FP cluster displayed late onset times, and especially late peak and offset times, combined with prolonged responses (i.e., large FWHM; although note that this value declined for later response steps). These observations were supported by post hoc t-tests of the significant effects in each parameter-level ANOVA (see summary in Table 3). Onsets were significantly earlier in the left FP cluster than the right FP (t(10) = 5.72, P < 0.001) and CO (t(10) = 4.19, P < 0.005) clusters. Peaks occurred significantly later in the right FP cluster than the left FP (t(10) = 5.47, P < 0.001) and CO (t(6) = 4.33, P < 0.005) clusters. FWHM was significantly lower for the CO cluster than the left FP (t(10) = 10.66, P < 0.001) and right FP (t(6) = 3.44, P < 0.05) clusters, which in turn also differed significantly from one another (t(10) = 4.20, P < 0.005, right FP lower than left FP). Similarly, offsets occurred significantly earlier in the CO cluster than the left FP (t(10) = 4.94, P < 0.001) and right FP (t(6)= 13.33, P < 0.001) clusters, and the left FP cluster offset occurred significantly earlier than the right FP cluster offset (t(10) = 3.40, P < 0.01).
Discussion
Here, we used data from 5 “slow reveal” decision-making tasks to examine the relative contributions of the frontoparietal and cinguloopercular networks to moment-to-moment processing within a trial. We found that a number of regions in both networks showed decision-related activity in these tasks. The timecourse parameters from these regions argue that they were differentially related to distinct processes within a trial: 1) timecourses from regions primarily in the left FP network had early onsets and extended responses peaking linearly with decision time, around the moment of decision (i.e., the response step), pointing to a role in pre-decision processing, 2) timecourses from the CO network showed late onsets and transient responses closely linked to the moment of decision, consistent with a role in performance reporting, and 3) timecourses from the majority of regions in the right FP network were characterized by late onsets and prolonged durations, trailing the moment of decision, suggesting a role in post-decision processing, perhaps through continuing response evaluation, feedback implementation, or next trial adjustments (see Fig. 5 and discussion below for an elaboration of these ideas).
Figure 5.
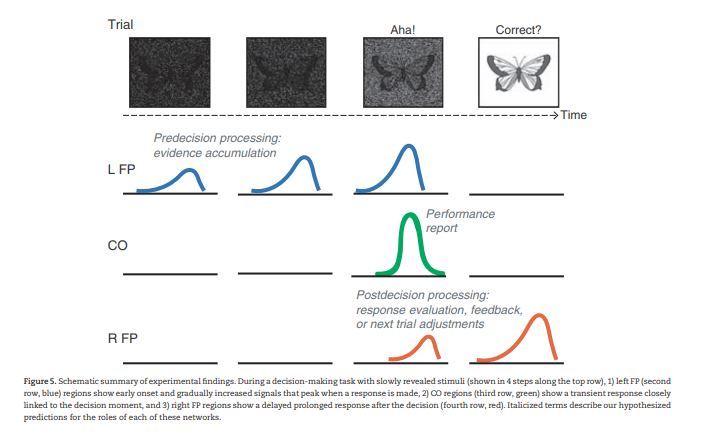
Schematic summary of experimental findings. During a decision-making task with slowly revealed stimuli (shown in 4 steps along the top row), 1) left FP (second row, blue) regions show early onset and gradually increased signals that peak when a response is made, 2) CO regions (third row, green) show a transient response closely linked to the decision moment, and 3) right FP regions show a delayed prolonged response after the decision (fourth row, red). Italicized terms describe our hypothesized predictions for the roles of each of these networks.
These findings build on previous work showing a distinction between evidence accumulation and moment of recognition responses across regions throughout the brain including both control and sensory systems ((Ploran et al. 2007, 2011; Wheeler et al. 2008); see also (Kayser et al. 2010; Tremel and Wheeler 2015) for additional work on evidence accumulation). We used data from 5 tasks to conduct a detailed analysis of the trial timecourses from the CO and FP networks, elucidating the role of these putative control networks in decision-making.
Control System Model
These data provide a window into the timecourse of FP and CO network activations during a trial. Previous investigations of the FP and CO systems have focused on their relative contributions throughout an entire task (i.e., sustained activations; Dubis et al. 2016; Sestieri et al. 2014) or for different trial types (i.e., error trials, cues; Dosenbach et al. 2006; Power and Petersen 2013; Neta et al. 2015; Wallis et al. 2015), that represented periods with high control demands necessary for optimizing task performance. Core regions in the CO network (dACC/msFC, left and right aI/fO) show enhanced signals for all 3 task periods (sustained activations, errors, and cues), consistent with the CO network playing a role in initializing a task set and maintaining it within a trial (Dosenbach et al. 2006; Power and Petersen 2013; Sestieri et al. 2014). FP regions, instead, primarily showed cue and error signals (but not sustained activations) (Dosenbach et al. 2006; Power and Petersen 2013), and their activations tend to be less domain-general (Sestieri et al. 2014). Together with the working memory and top-down attention signals reported in these regions (D'Esposito et al. 2000; Curtis and D'Esposito 2003; Gazzaley et al. 2007), these findings suggest that the FP system may have a more prominent role in interactions between processing demands and adaptive control within a trial.
Therefore, although the FP and CO systems appear to carry out distinct aspects of executive control, past evidence has suggested that both systems are active during moment-to-moment event processing in a wide variety of tasks (Nelson et al. 2010). Using a slow reveal paradigm especially designed to reveal different stages of processing within a trial, our data provide a new window into the adaptive moment-to-moment signals of FP and CO systems. Specifically, we found that regions in the CO, left FP, and right FP systems clustered separately from one another and showed distinct timecourse profiles of activation, pointing to dissociable roles in evidence accumulation and control processing and adding new insight to our control system models (Fig. 5).
In our study, the CO network was transiently active at the end of the trial, closely linked to the moment at which participants were able to reach a decision. We suggest that CO system activations represent a performance reporting signal that is tightly linked with a decision. This transient signal may then be incorporated into the greater task control model maintained by the CO network throughout task performance (that may be reflected by the sustained responses seen in these areas across entire task blocks; Dosenbach et al. 2006; Dubis et al. 2014). Notably, given the transience of the CO network moment-to-moment responses, we believe that their activations are more consistent with a short performance “reporting” role rather than prolonged performance “monitoring” (see additional discussion below in Function of the Medial Frontal Cortex in Trial Level Control). Previous data have shown that the CO network signals various aspects of performance separately, including accuracy, reaction time, and ambiguity (Neta et al. 2014), consistent with an enhanced role for the CO network when performance measures indicate a need for updating task set signals. Furthermore, in the case of errors, CO regions show fast, transient responses much like in correct trials, but with higher amplitudes (Neta et al. 2015), and errors in these regions primarily deviate from correct responses in the postrecognition period of a slow reveal task (Wheeler et al. 2008).
The FP system, instead, showed different timecourses in the 2 hemispheres. Left hemisphere regions of the FP system were characterized by early onset and gradual responses that occurred primarily before the decision-making period. Response onsets in these regions were similar for all decision events, but peaked at different times depending on when the decision was made (as in Ploran et al. 2007). Thus, sharper forward slopes were seen for earlier, relative to later, decisions. Based on the similarity of these timecourses to that of decision-making neurons, we propose that left hemisphere FP regions are involved in the accumulation of evidence toward a decision (Gold and Shadlen 2007). Note, however, that in a recent study (Tremel and Wheeler 2015) where participants were required to distinguish between 2 stimulus categories embedded in noise, only more posterior visual and dorsal attention regions showed signatures of evidence accumulation, suggesting that evidence accumulation in the FP network may only be required in cases with more complex decisions. An alternative explanation is that accumulator-like timecourses present in the L FP system may represent a continuous top-down refinement of stimulus processing (Curtis and D'Esposito 2003; Gazzaley et al. 2007) via an accumulation of attention signals over the course of the trial.
Finally, the majority of regions in the right FP network showed prolonged responses with a late onset, primarily after the decision-making event (and, unlike left FP regions, the forward slope of activations in right FP regions did not appear to differ with response step). We propose that right FP regions are involved in extended post-decision processing that may include evaluation of the response, feedback implementation, and/or next trial effects (perhaps acting upon performance signals from the CO network). This signature suggests a role more related to control-related response adjustment than the accumulation-like signals from the left component of the FP network. Consistent with the delayed post-decision processing signals seen here, error responses in right FP regions also show prolonged durations across 12 tasks (Neta et al. 2015). One possibility is that the delayed processing in R FP regions is related to the presence of an explicit response re-evaluation point in our paradigm (the “verification of accuracy” or VoA event, at the end of the trial). While it does not appear that the R FP response is evoked directly by the VoA event (because, at 14 s, the VoA follows the onset of the R FP timecourses and because the R FP timecourses vary with response step whereas the VoA event occurred at a set time in each trial), it is possible that asking participants to explicitly re-assess the accuracy of their responses caused them, in anticipation, to continue to evaluate the stimulus with respect to their decision. This function would be consistent with a re-evaluation role that we propose regions in the R FP may be carrying out during post-decision processing. Based on the data we present here, it is unclear whether an explicit re-evaluation is required to drive delayed activations in R FP; notably, however, the aforementioned delayed R FP responses after errors occurred in the absence of an explicit VoA or performance feedback signal (Neta et al. 2015), suggesting that delayed R FP responses may be internally driven as well. Future research will be needed to establish more definitively what the role is of delayed signals in the right FP system, using paradigms designed to dissociate the enumerated possibilities.
Relationship to Alternative Control System Models
Others have proposed related models for the function of the CO and FP systems. In one conception, the CO network supports tonic alertness, perhaps by inhibiting distraction, whereas the FP network supports phasic aspects of selective attention connected with enhanced processing of stimulus-specific information (Sadaghiani et al. 2010, 2012). Evidence in favor of this conception includes a relationship between the CO network and alpha power (commonly thought to index inhibition; Sadaghiani et al. 2010) and the FP network and alpha band phase synchrony (which may index transient integration across disparate brain areas; Sadaghiani et al. 2012). Furthermore, separately manipulating task difficulty through the similarity between stimuli or the regularity of the trial structure was related to increased activation in the dorsal attention/FP and CO networks, respectively (Sadaghiani and D'Esposito 2015).
Despite differences between this theoretical account and our proposed model, many similarities exist, including an emphasis on sustained processing and sensitivity to task structure variables for the CO network (i.e., in our previous work, CO signals are sustained across entire task blocks, we suggest for task set maintenance—Dosenbach et al. 2006; Dubis et al. 2014), and a close connection with moment-to-moment processing for the (left) FP network. In the context of the current decision-making tasks, it is unclear how the transient moment-to-moment signals exhibited by the CO network in individual trials are related to tonic alertness. They may relate to CO inhibitory functions proposed by Sadaghiani and colleagues (2010), if additional response alternatives are inhibited once a single decision option has been selected. One possibility is that the CO system may carry out multiple functions that reflect both our performance report and these tonic alertness/inhibition characterizations.
Frontoparietal System Asymmetries
In this study, we provide new evidence for FP network asymmetries. We found that regions in the right and left hemispheres of the FP network showed distinct temporal profiles in this set of decision-making tasks, linked together only at the final step of the clustering dendrogram (indicating a low degree of similarity; see Fig. 3). While both sets of regions showed prolonged responses, left FP regions had early onsets that peaked around the moment of decision (assuming an ∼6 s hemodynamic delay; Friston et al. 1994; Henson and Friston 2011), with sharper slopes associated with earlier decisions in “accumulator” like responses. The majority of right FP regions, instead, had delayed onsets, primarily post-decision, and late peaks. This evidence links to, and expands upon, previous findings from neuropsychological, task fMRI, and resting-state fMRI studies, suggesting that the FP system (especially in lateral frontal cortex) may show a heterogeneous, asymmetric profile.
Neuropsychological: Evidence from patients (Stuss and Alexander 2007; Stuss 2011) has demonstrated that lesions to left lateral, medial, and right lateral prefrontal cortex each lead to distinct characteristic deficits, especially in complex tasks requiring control. Lesions to left lateral frontal cortex are characterized by increases in false alarms, especially in more complex tasks with conflicting options. Lesions to medial prefrontal cortex are related to longer response times, particularly in later or more extended periods of a task. Finally, lesions to right lateral frontal cortex are associated with increased variability in performance and increased errors of all types. This set of observations led to the proposal that each of these regions participates in separable aspects of moment-to-moment processing, respectively: task setting (establishing a stimulus-response relationship), energization (initiating and sustaining a response), and monitoring (checking the quality of responses and making adjustments to behavior) (Stuss and Alexander 2007). These characterizations support the idea that the left and right components of the FP network (along with CO regions in medial frontal cortex) may have distinct functional roles. Furthermore, the specific deficits align with aspects of our model (discussed above): we propose that the left FP system is related to pre-decision processing, while the right FP system is related to delayed response evaluation, and the CO system is closely linked to the performance aspects of the decision-making act.
Task fMRI: A number of fMRI task studies have also provided evidence for lateralization of responses in frontal cortex (D'Esposito et al. 1998; Kelley et al. 1998; Henson et al. 2000; Habib et al. 2003; Dobbins et al. 2004; Nee et al. 2007; Neta et al. 2015). As described above, the left and right FP responses in this study map particularly well to differences that these regions exhibit in error responses (left: early and fast error responses, right: prolonged error responses extending late into the trial; Neta et al. 2015). A meta-analysis of conflict interference effects also suggested a similar timing asymmetry, with left dorsolateral prefrontal cortex associated with conflict resolution during stimulus encoding and right dorsolateral prefrontal cortex associated with conflict resolution during response selection (Nee et al. 2007). Once again, these characterizations fit with the idea that the left component of the FP system is involved in earlier processing, while the right component of the FP system is involved in later, response-related control.
Resting-state fMRI: Finally, resting-state fMRI studies also support the presence of FP asymmetries. Wang et al. (2014) examined functional connectivity patterns at rest for the two hemispheres separately. They found that the FP network, more than other networks, showed particularly high levels of intrahemispheric relative to interhemispheric, connections, arguing for some degree of hemispheric autonomy in the system. This evidence is consistent with the idea that FP regions in the two hemispheres may carry out distinct specialized functions.
As a whole, this evidence for heterogeneity may indicate that the FP network acts as a multifaceted system, with different subcomponents carrying out distinct processes of a task. This mix of response characteristics suggests that the FP system is well posed to mediate between processing and control requirements needed to complete many goal-directed tasks. In support of this idea, a recent study (Power et al. 2013) found that the FP system was positioned at the center of a spring embedded graph of whole-brain network organization, with connections to both processing and control systems.
Function of the Medial Frontal Cortex in Moment-to-Moment Control
The medial frontal cortex, including the dorsal anterior cingulate, the supplementary motor cortex, and pre-supplementary motor cortex, has been ascribed a large number of functions by different groups (see reviews in Rushworth et al. 2007; Nachev et al. 2008; Shenhav et al. 2013). These include processes such as volition (Nachev et al. 2005), complex stimulus-action associations (Nachev et al. 2008), tracking uncertainty (Grinband et al. 2006; Neta et al. 2014), exerting task control (Dosenbach et al. 2006, 2007, 2008), error detection (Dehaene et al. 1994), conflict monitoring (Botvinick et al. 1999, 2001; MacDonald et al. 2000; Kerns 2004), tracking reinforcement history (Rushworth et al. 2007), and predicting response outcomes (Alexander and Brown 2011).
The slow reveal paradigms examined in this meta-analysis provide evidence about the relative timing of activations across a trial that help to discriminate among some of these accounts. Specifically, one popular model of the function of medial frontal cortex proposes that it plays a distinct role in monitoring for conflict signals, and if conflict is found, then relays a need for increased control to parts of lateral prefrontal cortex which, in turn, execute top-down controlled regulation of other regions ((MacDonald et al. 2000; Botvinick et al. 2001; Kerns 2004); note that updates to this model frame the function of the medial frontal cortex as both having a role in monitoring for conflict and errors as well as specifying the control characteristics that are then sent to lateral prefrontal cortex (Shenhav et al. 2013)). The timing of processes in our study, however, would appear to be inconsistent with a “monitoring” role in medial frontal cortex. A region that monitors stimulus processing for conflict over a trial might be expected to show an early onset and prolonged activation during decision-making, more analogous to what is seen in left FP regions in this study. A region that continuously monitors response outcomes might instead be expected to show an extended activation post-decision while awaiting feedback, analogous to right FP activations in our experiment. Instead, we found that regions in the medial frontal cortex, along with other CO regions in the anterior insula, displayed transient signals closely tied to the moment of decision. This set of observations suggests that, unlike in conflict-monitoring accounts, these regions play a role in transient reporting/signaling of the decision response (and related aspects of performance including conflict, ambiguity, or uncertainty, and time on task; MacDonald et al. 2000; Kerns 2004; Grinband et al. 2006; Neta et al. 2014), rather than prolonged monitoring of more basic stimulus or response processes.
We propose that these signals may then be used to update sustained task set representations within the CO network and make control adjustments as needed, perhaps in conjunction with lateralized components of the FP control system. Interestingly, 2 studies testing the conflict-monitoring model of control found differential recruitment of regions in left (MacDonald et al. 2000) and right (Kerns 2004) dorsolateral prefrontal cortex during variants of the Stroop task. Specifically, the left dorsolateral prefrontal cortex showed both cue-related activation (especially in the more difficult control condition) as well as target-processing activation (MacDonald et al. 2000), whereas right dorsolateral prefrontal cortex activation correlated with behavioral adjustments in the trial following conflict (Kerns 2004). In both cases, medial frontal cortex showed conflict-related signals, specifically preceding behavioral adjustments and right dorsolateral prefrontal cortex activity. It is notable that these characteristics could again be consistent with an early, predecision processing role for the left component of the FP network, a response adjustment role for the right component of the FP network, and a performance reporting (rather than monitoring) role for the CO network.
Caveats
First, although responses were generally divided into groups of CO, L FP, and R FP by the results of data-driven clustering, a few regions showed exceptions to this pattern. Despite these exceptions, adopting an a priori division of regions into CO, L FP, and R FP groups produced similar results (including significant differences in response parameter characterizations, see Supplementary Fig. 5, Table 1), suggesting that our model is good description of the data. However, we discuss the unique cases in more detail below.
dACC
A CO region along the ventral border of the dorsal anterior cingulate clustered separately from the other CO regions we examined (as well as from all other groups). This distinct clustering was preserved even when subsamples of the data were examined from individual response steps (see Supplementary Fig. 2). However, the timecourse parameters of the dACC were very similar to the timecourse parameters of other CO regions (Fig. 4). This suggests that the dACC region shows a similar response profile to the other CO regions (and presumably, therefore, related functional role). The distinct clustering of the dACC may be associated with its more variable response characteristics (see Supplementary Fig. 4).
R Frontal and R IPS2
The right frontal and right IPS 2 regions of the FP system clustered with left FP regions. As would be expected given this clustering, a more detailed examination of their timecourse parameters demonstrates that they are more similar to L FP regions than other R FP regions (they have earlier onsets than all of the other R FP regions, have earlier peaks than all but 1 R FP region, and have higher FWHM than all other R FP regions). Furthermore, these regions clustered fairly consistently with the L FP group even when separate response step samples of the data were clustered independently (see Supplementary Fig. 2). This suggests that the left/right dissociation of the FP system, while a useful heuristic to describe the results in the majority of FP regions, does not perfectly characterize responses across the entire frontoparietal system.
Secondly, although we characterize general roles for regions in the CO, L FP, and R FP networks based on the similarity of their responses in decision-making, we do not believe that this indicates that the CO network as a whole (or the L FP or R FP) carries out a single cognitive process. Instead, we believe that the common response characteristics suggest that the regions within each cluster carry out a related set of processes in decision-making that are clearly distinct between the CO, L FP, and R FP clusters.
Third, past studies have shown that some regions (especially in the FP network) may show high degrees of variability in connectivity across individuals (Mueller et al. 2013; Gordon et al. 2015). In this study, we adopted a large group (meta-analysis) approach to circumvent variability at the individual subject level, allowing us to detect group differences between these clusters, despite potentially elevated levels of individual variability. However, it is possible that high variability across subjects contributed to the distinct classification of R frontal and R IPS2 regions (see above).
Finally, in this study we analyzed experiments that adopted a specialized “slow reveal” paradigm to separate responses for different phases of a decision-making trial. It is worth noting the possibility that use of this specialized paradigm may have influenced the results and their ability to generalize to other contexts. However, 1) other decision-making studies with more classical designs have implicated similar regions in evidence accumulation (Kayser et al. 2010) (although see also (Tremel and Wheeler 2015), which found that only more posterior visual association regions show evidence accumulation for relatively easy decisions among few options), and 2) we show that our findings generalize across several slow reveal studies, despite a number of differences in their parameters (e.g., stimulus modality, decision type, and method of reveal). Therefore, we feel that the findings are representative of processing that would occur in other deliberative decision-making contexts.
Conclusion
In summary, we found that the cinguloopercular, left, and right frontoparietal network regions showed distinct response profiles in decision-making trials. These findings argue for different functional specializations in moment-to-moment processing within the frontoparietal and cinguloopercular networks. The left component of the frontoparietal network showed early and gradual accumulator-like responses, suggesting a role in pre-decision evidence accumulation. The cinguloopercular network showed transient responses tightly linked to the moment of decision; together with previous evidence on its relationship to errors, ambiguity, and reaction time, these findings indicate that cinguloopercular regions have a role in performance-related signaling (i.e., through a transient response, rather than extended monitoring), perhaps to update a task set that is sustained across entire task periods. Finally, right hemisphere regions of the frontoparietal network showed late prolonged responses indicating a role in post-decision processing, potentially consisting of response evaluation, feedback implementation, and/or subsequent trial processing. Taken together with past evidence, these findings refine models of cinguloopercular and frontoparietal network function, indicating that the networks may participate in dissociable cognitive processes within a trial.
Supplementary Material
Supplementary material can be found at: http://www.cercor.oxfordjournals.org/.
Funding
This research was supported by a McDonnell Foundation Collaborative Activity Award (S.E.P.), NIH R01NS32979 (S.E.P.), NIH R01NS06424 (S.E.P.), NIH R01MH086492 (M.E.W.), NIH T32NS0007205-33 (C.G.), and NIH F32NS092290 (C.G.).
Supplementary Material
Notes
We thank Rebecca Coalson, Fran Miezin, and Mark McAvoy for technical assistance. Conflict of Interest: None declared.
References
- Alexander WH, Brown JW. 2011. Medial prefrontal cortex as an action-outcome predictor. Nat Neurosci. 14:1338–1344. [DOI] [PMC free article] [PubMed] [Google Scholar]
- Badre D, D'Esposito M. 2007. Functional magnetic resonance imaging evidence for a hierarchical organization of the prefrontal cortex. J Cogn Neurosci. 19:2082–2099. [DOI] [PubMed] [Google Scholar]
- Botvinick M, Nystrom LE, Fissell K, Carter CS, Cohen JD. 1999. Conflict monitoring versus selection-for-action in anterior cingulate cortex. Nature. 402:179–181. [DOI] [PubMed] [Google Scholar]
- Botvinick MM, Braver TS, Barch DM, Carter CS, Cohen JD. 2001. Conflict monitoring and cognitive control. Psychol Rev. 108:624–652. [DOI] [PubMed] [Google Scholar]
- Cordes D, Haughton V, Carew JD, Arfanakis K, Maravilla K. 2002. Hierarchical clustering to measure connectivity in fMRI resting-state data. Magn Reson Imaging. 20:305–317. [DOI] [PubMed] [Google Scholar]
- Curtis CE, D'Esposito M. 2003. Persistent activity in the prefrontal cortex during working memory. Trends Cogn Sci. 7:415–423. [DOI] [PubMed] [Google Scholar]
- Dehaene S, Posner MI, Tucker DM. 1994. Localization of a neural system for error detection and compensation. Psychol Sci. 5:303–305. [Google Scholar]
- D'Esposito M, Aguirre GK, Ballard E, Shin D, Zarahn RK, Lease J. 1998. Functional MRI studies of spatial and nonspatial working memory. Cogn Brain Res. 7:1–13. [DOI] [PubMed] [Google Scholar]
- D'Esposito M, Postle BR, Rypma B. 2000. Prefrontal cortical contributions to working memory: evidence from event-related fMRI studies. Exp Brain Res. 133:3–11. [DOI] [PubMed] [Google Scholar]
- Dobbins IG, Simons JS, Schacter DL. 2004. fMRI evidence for separable and lateralized prefrontal memory monitoring processes. J Cogn Neurosci. 16:908–920. [DOI] [PubMed] [Google Scholar]
- Dosenbach NUF, Fair DA, Cohen AL, Schlaggar BL, Petersen SE. 2008. A dual-networks architecture of top-down control. Trends Cogn Sci. 12:99–105. [DOI] [PMC free article] [PubMed] [Google Scholar]
- Dosenbach NUF, Fair DA, Miezin FM, Cohen AL, Wenger KK, Dosenbach RAT, Fox MD, Snyder AZ, Vincent JL, Raichle ME et al. 2007. Distinct brain networks for adaptive and stable task control in humans. Proc Natl Acad Sci USA. 104:11073–11078. [DOI] [PMC free article] [PubMed] [Google Scholar]
- Dosenbach NUF, Visscher KM, Palmer ED, Miezin FM, Wenger KK, Kang HC, Burgund ED, Grimes AL, Schlaggar BL, Petersen SE. 2006. A core system for the implementation of task sets. Neuron. 50:799–812. [DOI] [PMC free article] [PubMed] [Google Scholar]
- Dubis JW, Siegel JS, Visscher KM, Petersen SE. 2016. Tasks driven by perceptual information do not recruit sustained BOLD activity in cingulo-opercular regions. Cereb Cortex. 261:192–201. [DOI] [PMC free article] [PubMed] [Google Scholar]
- Duncan J, Owen AM. 2000. Common regions of the human frontal lobe recruited by diverse cognitive demands. Trends Neurosci. 23:475–483. [DOI] [PubMed] [Google Scholar]
- Fedorenko E, Duncan J, Kanwisher N. 2013. Broad domain generality in focal regions of frontal and parietal cortex. Proc Natl Acad Sci USA. 110:16616–16621. [DOI] [PMC free article] [PubMed] [Google Scholar]
- Friston K, Jezzard P, Turner R. 1994. Analysis of functional MRI time-series. Hum Brain Mapp. 1:153–171. [Google Scholar]
- Gazzaley A, Rissman J, Cooney J, Rutman A, Seibert T, Clapp W, D'Esposito M. 2007. Functional interactions between prefrontal and visual association cortex contribute to top-down modulation of visual processing. Cereb Cortex. 17(Suppl. 1):i125–i135. [DOI] [PMC free article] [PubMed] [Google Scholar]
- Gold J, Shadlen M. 2007. The neural basis of decision making. Annu Rev Neurosci. 30:535–574. [DOI] [PubMed] [Google Scholar]
- Gordon EM, Laumann TO, Adeyemo B, Petersen SE. 2015. Individual variability of the system-level organization of the human brain. Cereb Cortex. 10.1093/cercor/bhv239. [DOI] [PMC free article] [PubMed] [Google Scholar]
- Grinband J, Hirsch J, Ferrera VP. 2006. A neural representation of categorization uncertainty in the human brain. Neuron. 49:757–763. [DOI] [PubMed] [Google Scholar]
- Habib R, Nyberg L, Tulving E. 2003. Hemispheric asymmetries of memory: the HERA model revisited. Trends Cogn Sci. 7:241–245. [DOI] [PubMed] [Google Scholar]
- Handl J, Knowles J, Kell DB. 2005. Computational cluster validation in post-genomic data analysis. Bioinformatics. 21:3201–3212. [DOI] [PubMed] [Google Scholar]
- Henson R, Friston K. 2011. Convolution models for fMRI. In: Friston KJ, Ashburner JT, Kiebel SJ, Nichols TE, Penny WD, editors. Statistical parametric mapping: The analysis of functional brain images. 1st ed. London (UK): Elsevier. p 178–192. [Google Scholar]
- Henson RN, Rugg MD, Shallice T, Dolan RJ. 2000. Confidence in recognition memory for words: Dissociating right prefrontal roles in episodic retrieval. J Cogn Neurosci. 12:913–923. [DOI] [PubMed] [Google Scholar]
- Kayser AS, Buchsbaum BR, Erickson DT, D'Esposito M. 2010. The functional anatomy of a perceptual decision in the human brain. J Neurophysiol. 103:1179–1194. [DOI] [PMC free article] [PubMed] [Google Scholar]
- Kelley WM, Miezin FM, McDermott KB, Buckner RL, Raichle ME, Cohen NJ, Ollinger JM, Akbudak E, Conturo TE, Snyder AZ et al. 1998. Hemispheric specialization in human dorsal frontal cortex and medial temporal lobe for verbal and nonverbal memory encoding. Neuron. 20:927–936. [DOI] [PubMed] [Google Scholar]
- Kerns JG. 2004. Anterior cingulate conflict monitoring and adjustments in control. Science. 303:1023–1026. [DOI] [PubMed] [Google Scholar]
- Koechlin E, Summerfield C. 2007. An information theoretical approach to prefrontal executive function. Trends Cogn Sci. 11:229–235. [DOI] [PubMed] [Google Scholar]
- Lancaster JL, Glass TG, Lankipalli BR, Downs H, Mayberg H, Fox PT. 1995. A modality-independent approach to spatial normalization of tomographic images of the human brain. Hum Brain Mapp. 3:209–223. [Google Scholar]
- MacDonald AW, Cohen JD, Stenger VA, Carter CS. 2000. Dissociating the role of the dorsolateral prefrontal and anterior cingulate cortex in cognitive control. Science. 288:1835–1838. [DOI] [PubMed] [Google Scholar]
- Miezin F, Maccotta L, Ollinger JM, Petersen SE, Buckner RL. 2000. Characterizing the hemodynamic response: effects of presentation rate, sampling procedure, and the possibility of ordering brain activity based on relative timing. Neuroimage. 11:735–759. [DOI] [PubMed] [Google Scholar]
- Miller EK, Cohen JD. 2001. An integrative theory of prefrontal cortex function. Annu Rev Neurosci. 24:167–202. [DOI] [PubMed] [Google Scholar]
- Mueller S, Wang D, Fox MD, Yeo BT, Sepulcre J, Sabuncu MR, Shafee R, Lu J, Liu H. 2013. Individual variability in functional connectivity architecture of the human brain. Neuron. 77:586–595. [DOI] [PMC free article] [PubMed] [Google Scholar]
- Nachev P, Kennard C, Husain M. 2008. Functional role of the supplementary and pre-supplementary motor areas. Nat Rev Neurosci. 9:856–869. [DOI] [PubMed] [Google Scholar]
- Nachev P, Rees G, Parton A, Kennard C, Husain M. 2005. Volition and conflict in human medial frontal cortex. Curr Biol. 15:122–128. [DOI] [PMC free article] [PubMed] [Google Scholar]
- Nee DE, Wager TD, Jonides J. 2007. Interference resolution: insights from a meta-analysis of neuroimaging tasks. Cogn Affect Behav Neurosci. 7:1–17. [DOI] [PubMed] [Google Scholar]
- Nelson SM, Dosenbach NU, Cohen AL, Wheeler ME, Schlaggar BL, Petersen SE. 2010. Role of the anterior insula in task-level control and focal attention. Brain Struct Funct. 214:669–680. [DOI] [PMC free article] [PubMed] [Google Scholar]
- Neta M, Miezin FM, Nelson SM, Dubis JW, Dosenbach NU, Schlaggar BL, Petersen SE. 2015. Spatial and temporal characteristics of error-related activity in the human brain. J Neurosci. 35:253–266. [DOI] [PMC free article] [PubMed] [Google Scholar]
- Neta M, Schlaggar BL, Petersen SE. 2014. Separable responses to error, ambiguity, and reaction time in cingulo-opercular task control regions. Neuroimage. 99:59–68. [DOI] [PMC free article] [PubMed] [Google Scholar]
- Newman ME. 2006. Modularity and community structure in networks. Proc Natl Acad Sci USA. 103:8577–8582. [DOI] [PMC free article] [PubMed] [Google Scholar]
- Nomura EM, Gratton C, Visser RM, Kayser A, Perez F, D'Esposito M. 2010. Double dissociation of two cognitive control networks in patients with focal brain lesions. Proc Natl Acad Sci USA. 107:12017–12022. [DOI] [PMC free article] [PubMed] [Google Scholar]
- Ojemann JG, Akbudak E, Snyder AZ, McKinstry RC, Raichle ME, Conturo TE. 1997. Anatomic localization and quantitative analysis of gradient refocused echo-planar fMRI susceptibility artifacts. Neuroimage. 6:156–167. [DOI] [PubMed] [Google Scholar]
- Ollinger JM, Corbetta M, Shulman GL. 2001. Separating processes within a trial in event-related functional MRI II. Analysis. Neuroimage. 13:218–229. [DOI] [PubMed] [Google Scholar]
- Ollinger JM, Shulman GL, Corbetta M. 2001. Separating processes within a trial in event-related functional MRI I. The method. Neuroimage. 13:210–217. [DOI] [PubMed] [Google Scholar]
- Ploran EJ, Nelson SM, Velanova K, Donaldson DI, Petersen SE, Wheeler ME. 2007. Evidence accumulation and the moment of recognition: dissociating perceptual recognition processes using fMRI. J Neurosci. 27:11912–11924. [DOI] [PMC free article] [PubMed] [Google Scholar]
- Ploran EJ, Tremel JJ, Nelson SM, Wheeler ME. 2011. High quality but limited quantity perceptual evidence produces neural accumulation in frontal and parietal cortex. Cereb Cortex. 21:2650–2662. [DOI] [PMC free article] [PubMed] [Google Scholar]
- Power JD, Cohen AL, Nelson SM, Wig GS, Barnes KA, Church JA, Vogel AC, Laumann TO, Miezin FM, Schlaggar BL et al. 2011. Functional network organization of the human brain. Neuron. 72:665–678. [DOI] [PMC free article] [PubMed] [Google Scholar]
- Power JD, Petersen SE. 2013. Control-related systems in the human brain. Curr Opin Neurobiol. 23:223–228. [DOI] [PMC free article] [PubMed] [Google Scholar]
- Power JD, Schlaggar BL, Lessov-Schlaggar CN, Petersen SE. 2013. Evidence for hubs in human functional brain networks. Neuron. 79:798–813. [DOI] [PMC free article] [PubMed] [Google Scholar]
- Rushworth MF, Buckley MJ, Behrens TE, Walton ME, Bannerman DM. 2007. Functional organization of the medial frontal cortex. Curr Opin Neurobiol. 17:220–227. [DOI] [PubMed] [Google Scholar]
- Sadaghiani S, D'Esposito M. 2015. Functional characterization of the cingulo-opercular network in the maintenance of tonic alertness. Cereb Cortex. 25:2763–2773. [DOI] [PMC free article] [PubMed] [Google Scholar]
- Sadaghiani S, Scheeringa R, Lehongre K, Morillon B, Giraud AL, D'Esposito M, Kleinschmidt A. 2012. Alpha-band phase synchrony is related to activity in the fronto-parietal adaptive control network. J Neurosci. 32:14305–14310. [DOI] [PMC free article] [PubMed] [Google Scholar]
- Sadaghiani S, Scheeringa R, Lehongre K, Morillon B, Giraud AL, Kleinschmidt A. 2010. Intrinsic connectivity networks, alpha oscillations, and tonic alertness: a simultaneous electroencephalography/functional magnetic resonance imaging study. J Neurosci. 30:10243–10250. [DOI] [PMC free article] [PubMed] [Google Scholar]
- Salvador R, Suckling J, Coleman MR, Pickard JD, Menon D, Bullmore E. 2005. Neurophysiological architecture of functional magnetic resonance images of human brain. Cereb Cortex. 15:1332–1342. [DOI] [PubMed] [Google Scholar]
- Sestieri C, Corbetta M, Spadone S, Romani GL, Shulman GL. 2014. Domain-general signals in the cingulo-opercular network for visuospatial attention and episodic memory. J Cogn Neurosci. 26:551–568. [DOI] [PMC free article] [PubMed] [Google Scholar]
- Shenhav A, Botvinick MM, Cohen JD. 2013. The expected value of control: an integrative theory of anterior cingulate cortex function. Neuron. 79:217–240. [DOI] [PMC free article] [PubMed] [Google Scholar]
- Snyder AZ. 1996. Difference image vs. ratio image error function forms in PET-PET realignment. In: Myer R, Cunningham VJ, Bailey DL, Jones T, editors. Quantification of brain function using PET. San Diego: (CA: ): Academic Press; pp. 131–137. [Google Scholar]
- Stuss DT. 2011. Functions of the frontal lobes: relation to executive functions. J Int Neuropsychol Soc. 17:759–765. [DOI] [PubMed] [Google Scholar]
- Stuss DT, Alexander MP. 2007. Is there a dysexecutive syndrome? Philos Trans R Soc B Biol Sci. 362:901–915. [DOI] [PMC free article] [PubMed] [Google Scholar]
- Talairach J, Tournoux P. 1988. Co-planar stereotaxic atlas of the human brain. New York: Thieme Medical Publishers, Inc; (Chapter Chapter). [Google Scholar]
- Tremel JJ, Wheeler ME. 2015. Content-specific evidence accumulation in inferior temporal cortex during perceptual decision-making. Neuroimage. 109:35–49. [DOI] [PMC free article] [PubMed] [Google Scholar]
- Wallis G, Stokes M, Cousijn H, Woolrich M, Nobre AC. 2015. Frontoparietal and cingulo-opercular networks play dissociable roles in control of working memory. J Cogn Neurosci. 27:2019–2034. [DOI] [PubMed] [Google Scholar]
- Wang D, Buckner RL, Liu H. 2014. Functional specialization in the human brain estimated by intrinsic hemispheric interaction. J Neurosci. 34:12341–12352. [DOI] [PMC free article] [PubMed] [Google Scholar]
- Wheeler ME, Petersen SE, Nelson SM, Ploran EJ, Velanova K. 2008. Dissociating early and late error signals in perceptual recognition. J Cogn Neurosci. 20:2211–2225. [DOI] [PubMed] [Google Scholar]
- Wheeler ME, Shulman GL, Buckner RL, Miezin FM, Velanova K, Petersen SE. 2006. Evidence for separate perceptual reactivation and search processes during remembering. Cereb Cortex. 16:949–959. [DOI] [PubMed] [Google Scholar]
Associated Data
This section collects any data citations, data availability statements, or supplementary materials included in this article.