

Abstract
Background:
Circulating inflammation markers are being increasingly measured in prospective cohorts to investigate cancer etiology. However, it is unclear how the measurements are affected by the freeze-thaw cycles of the specimens prior to marker analysis.
Methods:
We compared concentrations of 45 inflammation markers between paired serum vials of 55 participants in the Prostate, Lung, Colorectal, and Ovarian (PLCO) Cancer Screening Trial that have undergone one (T1), two (T2), and three (T3) freeze-thaw cycles at the time of assay. We computed the difference of analyte concentrations across paired vials (T1 vs. T2, T2 vs. T3) and tested whether the difference deviated from zero using the Wilcoxon signed-rank test. We also calculated Spearman rank correlation and weighted kappa statistics for T1 vs. T2 and T2 vs. T3 comparisons to assess agreement in rank ordering of subjects.
Results:
Measurements between paired T1 and T2 samples were largely similar, with the difference not statistically deviating from zero for 36 of the 45 markers. In contrast, tests of the difference between paired T2 and T3 samples were statistically significant for 36 markers. However, the rank ordering of participants by marker concentration remained largely consistent across T2 and T3 samples, with Spearman correlation coefficients >0.8 for 42 markers and weighted kappas >0.7 for 37 markers.
Conclusion:
We recommend that studies measuring inflammation markers use previously unthawed specimens to the extent possible, or match on the number of prior freeze-thaw cycles in nested case-control studies.
Keywords: freeze-thaw, serum, cytokine inflammation markers, multiplex bead-based assay
1. Introduction
Inflammation markers, including cytokines, chemokines, and other immune markers, are a diverse group of small secreted soluble proteins acting as mediators of B and T cell responses to infection, inflammation, and other immunological processes, which are suspected to play critical roles in cancer development (1). Circulating levels of these analytes have been increasingly measured in epidemiologic studies as biomarkers of inflammation or immune dysregulation, and multiplex detection technologies have made it possible to simultaneously measure a large number of markers with a limited sample volume (2).
Prospectively collected serum or plasma samples in population cohorts offer the opportunity to measure pre-diagnostic circulating levels of inflammation markers and investigate their associations with subsequent disease outcomes. Such pre-diagnostic cohort samples may be used for multiple scientific projects, and often stored in freezers in volumes larger than needed for any given investigation, requiring a thawing step to prepare samples into adequate aliquot sizes. Investigators planning to measure inflammation markers using banked specimens are often faced with the question of whether to use previously unthawed serum (“parent vials”) or stored serum aliquots created from previously thawed parent vials. The former approach is typically recommended by assay vendors and laboratories to minimize potential changes in protein concentrations due to freeze-thaw effects, while the latter approach avoids thawing of parent vials and safeguards biospecimens for future projects. It is thus important to evaluate how freeze-thaw cycles may impact the measurement levels of inflammation markers in banked serum.
To address this question, we designed a study to assess how inflammation marker levels change between serum samples that experienced a total of 2 controlled thaws prior to assaying (the thaw for aliquotting and the thaw for marker analysis; T2) and samples that had undergone one additional prior freeze-thaw cycle (i.e., 3 total thaws; T3). We also measured marker levels in serum samples that were analyzed immediately after one thaw (T1) as a gold-standard reference.
2. Materials and methods
2.1. Study Design and Samples
We used serum samples from 55 healthy subjects in the Prostate, Lung, Colorectal, and Ovarian (PLCO) Cancer Screening Trial, each with two banked serum vials (1.8 mL each) collected from the same blood draw at study entry. Details on the specimens collected in the PLCO Trial were described elsewhere (3–6). Briefly, serum samples were collected from consented intervention arm participants, processed within two hours of the blood draw, centrifuged for either 15 minutes at 1200xg or 6 minutes at 3900xg, and stored at −70°C or lower. Samples included in this experiment had been stored in freezers for a range of 14 to 21 years prior to this study, with a median of 18 years (interquartile range: 16–20 years).
A summary of the experimental design and procedures is provided in Supplementary Figure 1. On Day 1, we thawed the #1 vial of all subjects overnight in a refrigerator(2–8°C) and created two 400uL aliquots. For each subject, one of the aliquots was further centrifuged with the supernatant transferred to a new tube to avoid debris, creating the T2 specimen. We returned all aliquots immediately to a −80°C freezer to re-freeze. On Day 7, we thawed the other 400uL aliquot of each subject overnight in a refrigerator, centrifuged the samples, and transferred the supernatant to new tubes, thus creating the T3 specimen. All tubes were returned immediately to −80°C. Between Days 8 and 12 (Day 8+), we thawed the #2 vial of all subjects overnight in a refrigerator, centrifuged, transferred the supernatant to new tubes, and made a 400uL aliquot, thus creating the T1 specimen. In summary, at the time of assay, T3 samples had experienced a total of 3 controlled thaws prior to assay (Day 1, Day 7, and Day 8+), whereas the T2 and T1 samples had experienced 2 (Day 1 and Day 8+) and 1 (Day 8+) thaws, respectively. The T1, T2, and T3 specimens of the same subject were then assayed together shortly thereafter on that same day.
2.2. Inflammation Marker Testing
Circulating levels of 45 inflammation markers were measured across 5 multiplexed Luminex bead-based assays (EMD Millipore, Billerica, MA; Supplementary Table 1). All samples were assayed in duplicate. Samples from the 55 subjects were divided into 5 batches and assayed on consecutive days (Day 8+). The T1, T2, and T3 specimens of the same subject (i.e., 6 wells per subject) were assayed immediately adjacent to one another on the same plate. Besides the manufacturer-provided quality control (QC) samples (duplicates of 2 samples; n =4), we inserted three blinded QC replicates of pooled serum (n=6 wells) in every batch. We calculated the concentrations of markers using a four or five-parameter logistic curve fit model using measurements from a set of 7 standard concentration samples included on each batch. Based on the analyte concentrations from the blinded QC sample included in triplicate in each of the five batches, we observed relatively small intra-batch coefficients of variation (CVs) (median 3%, ranging between 1% - 21%;Supplementary Table 1), and slightly larger inter-batch CVs (median 15%, ranging from 3% - 55%), comparable to those observed in a previous reproducibility evaluation of these panels (2).
2.3. Statistical Analysis
All statistical tests were two-sided with an alpha of 0.05. For each marker, the percentage of paired samples (i.e., T1 vs. T2 and T2 vs. T3) with measurements above the lower limit of quantitation (LLOQ) was compared using McNemar’s test (Supplementary Table 2). We restricted our analysis to markers with measurements above the LLOQ in all paired vials for at least 40% of subjects; 45 of the 51 markers met this criterion, excluding FGF-2, IL-3, IL-33, IL-7, TNF-B, and TSLP. We used the Wilcoxon signed rank test to test whether the absolute difference in measured marker concentrations between the paired samples (T1 vs. T2, T2 vs. T3) deviated from zero. We also calculated the percent difference between the paired samples (i.e., 100%×(T3 –T2)/T2 and 100%×(T2 –T1)/T1) to facilitate the graphical presentation of results across analytes (Figure 1 and Supplementary Table 3). We also calculated the Spearman rank correlation coefficients for the paired measures to assess the extent to which the rank ordering of analyte concentrations across subjects was preserved (Figure 2 and Supplementary Table 3). These calculations were done both among all participants and in the subset of participants with measurements above the LLOQ in both samples; as results were very similar, we only present the latter in this report.
Figure 1. Mean percent difference1 of inflammation marker measurements between the paired samples2.
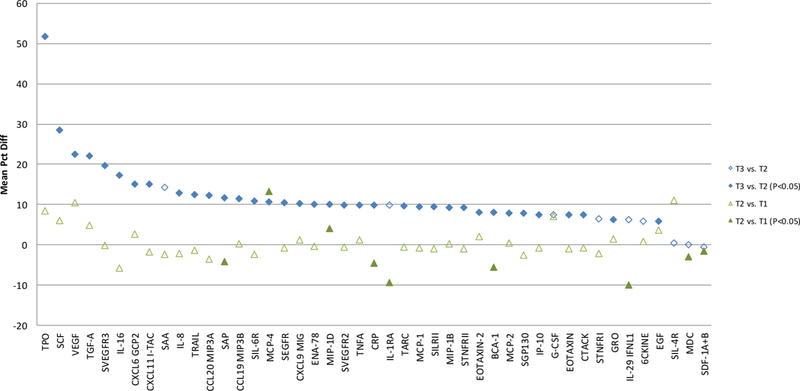
1Percent difference calcuated as (100% × (T3 − T2) / T2) for the T3 vs. T2 comparison and (100% × (T2 − T1) / T1) for the T2 vs. T1 comparison; T3, T2, and T1 samples have undergone 3, 2, and 1 freeze-thaw cycles, respectively, at the time of marker testing
2Calculated among participants with measurements above the detection limit for both of the paired samples
3Wilcoxon signed rank test P value comparing absolute difference of marker measurements between the paired samples
Figure 2. Spearman rank correlation of inflammation marker measurements between the paired samples1.

1Calculated among participants with measurements above the detection limit for both of the paired samples; T3, T2, and T1 samples have undergone 3, 2, and 1 freeze-thaw cycles, respectively, at the time of marker testing
Additionally, we conducted analyses of categorized analyte concentrations, evaluating the agreement in rank ordering of analyte categories with the use of weighted kappa coefficients (Supplementary Table 4). Markers with detectable concentrations in >75% of samples were categorized into quartiles using T1-, T2-, and T3-specific cutpoints; markers with 50–75% detectability were categorized as less than LLOQ and tertiles of detectable measurements (also 4 groups); and markers with 40–50% detectability were categorized into 3 groups, with values below the LLOQ in the lowest category and the remaining categories split using the median among samples above the LLOQ.
3. Results
The proportions of measurements below the LLOQ were comparable between the paired samples for all 45 markers (Supplemental Table 2). Marker concentrations between T1 and T2 were largely similar; the absolute difference significantly deviated from zero for only 9 of the 45 markers (BCA-1, CRP, IL-1RA, IL-29 IFNL1, MCP-4, MDC, MIP-1D, SAP, and SDF-1A+B), with the mean percent difference ranging from −10% to 13% (median: −1%) (Figure 1 and Supplementary Table 3). In contrast, tests of the difference between T3 and T2 measurements were statistically significant for 36 markers (all but 6CKINE, G-CSF, IL-1RA, IL-29 IFNL1, MDC, SAA, SDF-1A+B, SIL-4R, and STNFRI), with the mean percent difference ranging between −1% and 52% (median: 10%).
However, the rank ordering of participants by marker concentration remained largely consistent across the T2 and T3 samples (Figure 2 and Supplemental Table 3), with Spearman correlation coefficients >0.8 for 42 markers (and >0.9 for 32 markers). Spearman correlation coefficients were similarly strong when comparing measurements across the T1 and T2 samples, exceeding 0.8 for 41 markers. The weighted kappas for agreement in categorical grouping between the paired samples were also generally high, exceeding 0.7 for 41 markers in the T1 vs. T2 comparison, and 37 markers in the T2 vs. T3 comparison (Supplementary Table 4). Most markers with a weighted kappa <0.7 were found in the SR9P1 panel (i.e., 3 out of 4: SEGFR, SVEGFR2, SIL-4R in the T1 vs. T2 comparison; 6 out of 8: SEGFR, SGP130, STNFRI, SVEGFR2, SIL-4R, and SVEGFR3 in the T2 vs. T3 comparison).
4. Discussion
We conducted this methodologic study to evaluate how inflammation marker levels change between serum that has undergone one prior freeze-thaw cycle and serum previously unthawed at the time of sample selection (T3 and T2, respectively), and how these levels compared to those measured in samples that were analyzed immediately after being thawed (T1); that is, we compared how inflammation marker levels differed when samples have undergone 3, 2, and 1 freeze-thaw cycles, respectively, at the time of marker analysis. We observed statistically significant differences in concentration between the T2 and T3 samples for most markers included in the analysis, while the differences in analyte concentrations between T1 and T2 were generally small and not statistically significant. However, whether comparing T3 to T2 samples or T2 to T1 samples, we observed strong rank correlation and weighted kappa coefficients comparing continuous and categorized marker concentrations.
Taken together, these findings suggest that for most inflammation markers, concentrations did not change much when comparing samples assayed immediately after the thaw (T1) to samples that suffered one additional freeze-thaw cycle due to sample aliquotting (T2), but the use of previously thawed serum samples that have undergone three freeze-thaw cycles at the time of marker testing (T3) can lead to a different measured absolute concentration. However, the magnitudes of observed differences, even when statistically significant, were typically small (median: 10%) and the rank ordering of marker concentrations across subjects generally remained intact.
Our results were generally consistent with others in the literature, although previous studies were conducted based on a smaller number of subjects and a limited number of analytes. A comparison of our findings with the literature is summarized in Table 1. TNFα, a marker that was examined in seven studies (7–12), was found to be relatively stable through the freeze-thaw cycle. Similar to our findings, most studies found the TNFα concentration changes to be within ±10% whether in samples that had gone through three, compared to two, or two, compared to one, freeze-thaw cycles prior to assay. One exception was the study by De Jager et al. (8), which observed a larger increase in measured TNFα concentrations with additional freeze-thaw cycles (a ~45% increase from T1 to T2 and a ~20% increase from T2 to T3). Available data for the other markers evaluated in previous studies also showed marker concentration changes by an additional freeze-thaw cycle to be mostly within ±10%.
Table 1.
Comparison of our study findings with the literature
| Our Study N = 55 | Hosnijeh 2010 N = 92 | De Jager 2009 N = 34 | Ray 2005 N = 15 | Flower 2000 N = 226 | Aziz 1999 N = 77 | Thavasu 1992 N = 38 | |||
|---|---|---|---|---|---|---|---|---|---|
| Analyte | % Difference1 | R Correlation | % Difference1 | R Correlation3 | % Difference1 | % Difference1 | % Difference1 | % Difference1 | % Difference1 |
| Thrice-thawed (T3) vs. Twice-thawed (T2) | |||||||||
| EOTAXIN | 7% | 0.98 | −3.4% | 0.93, 0.98 | − | − | − | − | − |
| IL-8 | 13% | 0.98 | 0.3% | 0.95, 0.82 | − | −6.4% | − | − | − |
| IP-10 | 8% | 0.97 | −4.3% | 0.90, 0.90 | − | − | − | − | − |
| STNFRII | 9% | 0.9 | − | − | − | − | − | roughly 1% | − |
| TNFα | 10% | 0.9 | −0.3% | 0.33, 0.57 | roughly 20% | −8.2% | roughly 5% | roughly −2% | roughly the same |
| Twice-thawed (T2) vs. Once-thawed (T1) | |||||||||
| EOTAXIN | −1% | 0.98 | −5.7% | 0.98, 1.00 | − | − | − | − | − |
| IL-8 | −2% | 0.96 | −11.3% | 0.82, 0.73 | − | −6.0% | − | − | − |
| IP-10 | −1% | 0.98 | 1.0% | 0.90, 0.90 | − | − | − | − | − |
| STNFRII | −1% | 0.92 | − | − | − | − | − | roughly 1% | − |
| TNFα | 1% | 0.93 | −1.4% | 0.57, 0.27 | roughly 45% | −2.0% | roughly 5% | roughly 1% | roughly the same |
% difference calculated as (T3-T2)/T2 or (T2-T1)/T1 × 100%
Used citrate plasma samples collected from 9 asymptomatic adults that had gone through 1, 2, and 3 freeze-thaw cycles prior to bead-based immunoassays, compared to fresh samples analyzed 2 hours within collection
Spearman Correlation of thrice- and twice-thawed samples, compared to fresh samples, and twice- and once-thawed samples, compared to fresh samples
Used cytokine induced heparin whole blood samples from 3 healthy individuals that had gone through multiple free-thaw cycles prior to multiplex immunoassays
Used a 3000 pg/mL multi-analyte control sample reconstituted with human serum from a healthy subject that was split into four samples corresponding to 1 to 4 freeze-thaw cycles prior to multiplex immunoassays
Used EDTA plasma samples from 22 healthy subjects repeatedly freeze-thawed for up to 6 cycles prior to ELISA assays
Used serum and/or plasma samples from 3 HIV-seropositive and 4 HIV-seronegative individuals with freeze-thaw cycles conducted 1, 2, 3, 4, 5, and 10 times on sequential days prior to ELISA assays
Used serum and plasma samples from 3 healthy volunteers that had gone through up to 6 freeze-thaw cycles prior to radioimmunoassays
We found that measured inflammation marker levels generally tended to be higher, rather than lower, in the T3 than T2 samples. Data in the literature on this subject are still scarce, but there are a number of proteins that have shown an increase in marker concentrations after an additional freeze-thaw cycle, while others have shown a decrease (8–12). It may be possible that an analyte was bound by another molecule or receptor and the freeze-thaw event released the analyte from this state, leading to a higher analyte level after the additional freeze-thaw process. Potential sample evaporation could be another reason why some studies observed a higher analyte level after the additional freeze-thaw cycle. Future studies of adequate sample size on a large number of analytes are needed to confirm our findings.
Our study has several strengths, including a relatively large sample size and large number of analytes evaluated. We used samples from healthy participants in the PLCO cohort, a general population cohort and widely used resource for prospectively molecular epidemiologic studies, to maximize comparability of specimens with an actual PLCO study. A limitation of our study is its relatively narrow scope, in that we only evaluated the differences of up to thrice–thawed specimens at the time of assay. We designed our study to evaluate this specific question because it is particularly germane to the design of serum-based nested case-control studies within cohorts. Given that unthawed serum and plasma vials within repositories are highly valued, and over time become increasingly scarce, it is important for their preservation to restrict their use when possible. Samples not previously thawed prior to assay are not typically available in cohort studies, but were added as a gold standard reference. Given the large number of markers evaluated, some observed differences could have arisen due to chance. However, had we used a Bonferroni-corrected alpha of 0.001, we still would have observed statistically significant differences in marker concentrations between T2 and T3 for the majority of analytes. In addition, some observed differences could result from assay variability; this was not generally observed across all markers but was apparent for MCP-4 which had an intra-batch CV of 21% and SCF with an intra-batch CV of 17%. Markers with a lower kappa agreement tended to reside in the SR9P1 panel; we however didn’t observe a higher intra-batch CV for any of those markers. Inter-batch CVs were not relevant since we assayed all paired and duplicate samples adjacent to one another in the same batches.
We also note that samples for this experimental study were processed in a very controlled fashion designed to evaluate the specific question under study, the variability between the paired samples focused on the additional freeze-thaw cycle. Other pre-analytical factors can also potentially affect measured analyte concentrations, such as variation in sample collection and handling, and storage conditions and length, and should be controlled for in the design of a nested case-control study wherever possible. Variability in such sample factors or those related to subject exposures should not be a plausible explanation for the observed differences in analyte levels by increasing freeze-thaw in this study, since paired samples were all originating from the same source vial collected from the same subject.
5. Conclusions
We observed little changes in the concentrations of inflammation markers between samples that have undergone one versus two freeze-thaw cycles, but statistically significant changes in the absolute levels of inflammation markers after samples have undergone three freeze-thaw cycles at the time of marker analysis. However, the rank ordering of marker concentrations across subjects was generally preserved up to three freeze-thaw cycles. Based on our findings, we recommend that future studies measuring circulating inflammation markers select previously unthawed specimens when possible. Nested case-control studies within cohort studies may use samples that have undergone one prior freeze-thaw cycle at the time of sample selection, but in such cases we recommend that controls be matched to cases on the number of prior thaws.
Supplementary Material
Acknowledgments
Funding sources: This research was supported by the Intramural Research Program of the Division of Cancer Epidemiology and Genetics and contracts from the Division of Cancer Prevention, National Cancer Institute, National Institutes of Health, Department of Health and Human Services.
Footnotes
Conflict of interest: the authors have no conflicts of interest to disclose
REFERENCES
- (1).Coussens LM, Werb Z. Inflammation and cancer. Nature 2002. December 19;420(6917):860–7. [DOI] [PMC free article] [PubMed] [Google Scholar]
- (2).Chaturvedi AK, Kemp TJ, Pfeiffer RM, Biancotto A, Williams M, Munuo S, Purdue MP, Hsing AW, Pinto L, McCoy JP, Hildesheim A. Evaluation of multiplexed cytokine and inflammation marker measurements: a methodologic study. Cancer Epidemiol Biomarkers Prev 2011. September;20(9):1902–11. [DOI] [PMC free article] [PubMed] [Google Scholar]
- (3).Carrick DM, Black A, Gohagan JK, Khan A, Pettit K, Williams C, Yu K, Yurgalevitch S, Huang WY, Zhu C. The PLCO Biorepository: Creating, Maintaining, and Administering a Unique Biospecimen Resource. Rev Recent Clin Trials 2015;10(3):212–22. [DOI] [PMC free article] [PubMed] [Google Scholar]
- (4).Hayes RB, Reding D, Kopp W, Subar AF, Bhat N, Rothman N, Caporaso N, Ziegler RG, Johnson CC, Weissfeld JL, Hoover RN, Hartge P, et al. Etiologic and early marker studies in the prostate, lung, colorectal and ovarian (PLCO) cancer screening trial. Control Clin Trials 2000. December;21(6 Suppl):349S–55S. [DOI] [PubMed] [Google Scholar]
- (5).Hayes RB, Sigurdson A, Moore L, Peters U, Huang WY, Pinsky P, Reding D, Gelmann EP, Rothman N, Pfeiffer RM, Hoover RN, Berg CD. Methods for etiologic and early marker investigations in the PLCO trial. Mutat Res 2005. December 30;592(1–2):147–54. [DOI] [PubMed] [Google Scholar]
- (6).Zhu CS, Pinsky PF, Kramer BS, Prorok PC, Purdue MP, Berg CD, Gohagan JK. The prostate, lung, colorectal, and ovarian cancer screening trial and its associated research resource. J Natl Cancer Inst 2013. November 20;105(22):1684–93. [DOI] [PMC free article] [PubMed] [Google Scholar]
- (7).Aziz N, Nishanian P, Mitsuyasu R, Detels R, Fahey JL. Variables that affect assays for plasma cytokines and soluble activation markers. Clin Diagn Lab Immunol 1999. January;6(1):89–95. [DOI] [PMC free article] [PubMed] [Google Scholar]
- (8).de JW, Bourcier K, Rijkers GT, Prakken BJ, Seyfert-Margolis V. Prerequisites for cytokine measurements in clinical trials with multiplex immunoassays. BMC Immunol 2009;10:52. [DOI] [PMC free article] [PubMed] [Google Scholar]
- (9).Flower L, Ahuja RH, Humphries SE, Mohamed-Ali V. Effects of sample handling on the stability of interleukin 6, tumour necrosis factor-alpha and leptin. Cytokine 2000. November;12(11):1712–6. [DOI] [PubMed] [Google Scholar]
- (10).Hosnijeh FS, Krop EJ, Portengen L, Rabkin CS, Linseisen J, Vineis P, Vermeulen R. Stability and reproducibility of simultaneously detected plasma and serum cytokine levels in asymptomatic subjects. Biomarkers 2010. March;15(2):140–8. [DOI] [PubMed] [Google Scholar]
- (11).Ray CA, Bowsher RR, Smith WC, Devanarayan V, Willey MB, Brandt JT, Dean RA. Development, validation, and implementation of a multiplex immunoassay for the simultaneous determination of five cytokines in human serum. J Pharm Biomed Anal 2005. January 4;36(5):1037–44. [DOI] [PubMed] [Google Scholar]
- (12).Thavasu PW, Longhurst S, Joel SP, Slevin ML, Balkwill FR. Measuring cytokine levels in blood. Importance of anticoagulants, processing, and storage conditions. J Immunol Methods 1992. August 30;153(1–2):115–24. [DOI] [PubMed] [Google Scholar]
Associated Data
This section collects any data citations, data availability statements, or supplementary materials included in this article.