

Abstract
Extracellular vesicles (EVs) are important mediators of cell-cell communication due to their cargo content of proteins, lipids and RNAs. We previously reported that small EVs (SEVs) called exosomes promote directed and random cell motility, invasion, and serum-independent growth. In contrast, larger EVs (LEVs) were not active in those assays, but may have unique functional properties. In order to identify protein cargos that may contribute to different functions of SEVs and LEVs, we used isobaric tag for relative and absolute quantitation (iTRAQ)-liquid chromatography (LC) tandem mass spectrometry (MS) on EVs isolated from a colon cancer cell line. Mass spectrometry proteomics data are available via ProteomeXchange with identifier PXD010840. Bioinformatic analyses revealed that SEVs are enriched in proteins associated with cell-cell junctions, cell-matrix adhesion, exosome biogenesis machinery and various signaling pathways. In contrast, LEVs are enriched in proteins associated with ribosome and RNA biogenesis and processing, and metabolism. Western blot analysis of EVs purified from 2 different cancer cell types confirmed the enrichment of cell-matrix and cell-cell adhesion proteins in SEVs. Consistent with those data, we found that cells exhibit enhanced adhesion to surfaces coated with SEVs compared to an equal protein concentration of LEVs. These data suggest that a major function of SEVs is to promote cellular adhesion.
Keywords: extracellular vesicles, exosomes, microvesicles, iTRAQ, proteomics, adhesion
1. Introduction
Extracellular vesicles (EVs), including exosomes and microvesicles (MVs), are released by diverse cell types under normal and pathological conditions 1, 2. EVs carry biologically active cargoes, including proteins, lipids, and nucleic acids and mediate both autocrine and paracrine functions, including growth, signaling, and promotion of motility 1, 2. The composition of EVs is highly dependent on the cell and tissue type and may depend on the biogenesis mechanism 1. Recent data have indicated that EVs released from cells are highly heterogeneous 3–5 and may have different functions 1, 5, 6.
Exosomes are SEVs that are formed as intraluminal vesicles (ILVs) that bud inward from the endosomal membrane during the maturation of multivesicular endosomes (MVEs) 2. MVEs can fuse with lysosomes for degradation of their contents or fuse with the plasma membrane 2. ILVs are released into the extracellular space when the limiting membrane of MVEs fuse with the plasma membrane; upon their release into the extracellular space, ILVs are called exosomes 2. MVs are formed by the outward budding and fission of the plasma membrane and release into the extracellular space 2. Exosomes typically have a diameter of 30–150 nm, while MV typically have a diameter of 150–1000 nm 2, although smaller shed MVs have been reported 7. In some cancers, especially prostate and ovarian cancer, even larger EVs, known as large oncosomes, are also released by budding from the cell surface 8, 9.
Typically, EVs are purified based on size and used for functional studies. A classic differential centrifugation purification yields larger EVs (LEVs) in the 10,000xg pellet, which includes MVs, and small EVs (SEVs) in the 100,000xg pellet which includes the exosomes. In cancer, exosomes/SEVs have been demonstrated to influence tumor aggressiveness by multiple mechanisms, including promoting cancer cell growth, motility, chemotaxis, invasion, metastasis and angiogenesis and conditioning the tumor microenvironment 10–16. Shed MVs/LEVs have also been shown to impact cancer-associated phenotypes 17–19 and sometimes similar molecules are reported to be carried by exosomes and MVs.
Using a genetic inhibition approach, we previously reported that exosome secretion promotes both random and directed cell motility of cancer cells 14, 15. Rescue experiments with purified SEVs and LEVs, enriched respectively for exosomes and MVs, indicated that only the SEVs could rescue motility defects of cells defective for exosome secretion. Similarly, purified SEVs, but not LEVs, were able to rescue oncogenic functions of exosome-inhibited head and neck squamous cell carcinoma (HNSCC) cells in serum independent growth and transwell invasion 20. These findings suggest that SEVs and LEVs carry different molecular cargoes that mediate distinct functions.
In this present study, we used iTRAQ-quantitative proteomic analysis to identify major differences in the protein compositions of exosome-enriched SEVs and MV-enriched LEVs derived from a colorectal cancer cell line, DKs8. We found that DKs8 SEVs are enriched for proteins associated with cell-cell junctions and cell-matrix adhesion. Likewise, SEVs from a completely different cancer cell type, HT1080 fibrosarcoma cells, showed similar enrichment for adhesion proteins compared to LEVs from the same cell line. Consistent with this finding, SEVs were much more potent in enhancing cell adhesion compared to LEVs. These data suggest that cellular adhesion is a general function associated with SEVs.
2. Materials and Methods
2.1. Cell culture, Reagents and Antibodies
DKs8 cells were cultured in DMEM (Corning) supplemented in 10% fetal bovine serum (FBS, Deville), non-essential amino acids (Sigma), and L-Glutamine (Sigma). HT1080 cells were cultured in DMEM supplemented in 10% bovine growth serum (BGS) (cat no. SH30541.03, Hyclone). HEK 293FT cells were cultured in DMEM supplemented with 10% FBS and 0.5mg/ml G418 Sulfate (Corning). Stable shRNA scrambled control and shRNA ARRDC1 knockdown cell lines was produced using the ViraPower Lentiviral expression system (Thermo Fisher Scientific). The shRNA constructs for ARRDC1 in pLKO.1 lentiviral shRNA expression system were purchased from Dharmacon [sh1: TRCN0000135565 (5’-TTGGCCTTATAGGACACTTTC-3’), sh2: TRCN0000135642 (5’-AGAGACCTGTAAGTAGTAGTC-3’), sh3: TRCN0000136494 (5’ ACCTGTAAGTAGTAGTCGATG-3’)]. The shRNA constructs for Rab27a ARRDC1 in pLKO.1 lentiviral shRNA expression system were purchased from Thermo Scientific [sh1: TRCN0000005296 (5′-CCGGCGGATCAGTTAAGTGAAGAAACTCGAGTTTCTTCACTTAAC-TGATCCGTTTTT-3′) and sh2: TRCN0000005297 (5′-CCGG-GCTGCCAATGGGACAAACAT-ACTCGAGTATGTTTGTCCCATTGGCAGC-TTTTT-3′)]. Scrambled control construct [Plasmid #26701 (5′-CCTAAGGTTAAGTCGCCCTCG-CTCGAG-CGAGGGCGACTTAACCTTAGG-3′)] was acquired from Addgene. Rabbit anti-CD63 (cat no. ab134045), rabbit anti-TSG101 (cat no. ab30871), rabbit anti-ARRDC1 (cat no. ab181758), rabbit anti-integrin alpha-3 (cat no. ab131055) and rabbit anti-integrin beta-8 (cat no. ab80673) were purchased from Abcam. Mouse anti-Hsp70 (cat no. sc-24), mouse anti-EphA2 (cat no. sc-398832) and normal mouse IgG1 (sc-3877) were purchased from Santa Cruz. Mouse anti-EphB1 (cat no. 3980), rabbit anti-Claudin 3 (cat no. 83609), rabbit anti-Thrombospondin-1 (cat no. 14778), rabbit anti-hnRNPA1 (cat no. 8443) and rabbit anti-Rab27a (cat no. 69295) were purchased from Cell Signaling. Mouse anti-beta actin (cat no. AC-74) was purchased from Sigma. Mouse anti-Flotillin-1 (cat no. 610820) was purchased from BD BioSciences. Mouse anti-EphB4 (cat no. CPTC-EphB4–1-s) and mouse anti-integrin alpha 3/CD49c (cat no. P1B5-c) were purchased from Developmental Studies Hybridoma Bank (University of Iowa). Rabbit anti-hnRNPH3 (cat no. PA5–41837) was purchased from Thermo Fisher Scientific.
2.2. Isolation of EVs from conditioned medium
DKs8 and HT1080 cells were cultured at 50% confluence in serum-free DMEM. After 48 hours, the conditioned medium was collected from the cells and the EVs were isolated via serial centrifugation. Floating live cells and dead cell debris were removed from the conditioned medium after centrifugation steps of 300 × g for 10 min and 2,000 × g for 25 min, respectively. A low-speed pellet was collected at a 10,000 × g spin for 30 min, which contains the LEVs. A pellet of ultracentrifuged SEVs was collected after a 100,000 × g spin overnight of the conditioned medium. As a further purification step, the UC collected SEVs were layered on top of a discontinuous density gradient of 5%, 10%, 20% and 40% iodixanol. These iodixanol dilutions were prepared by diluting OptiPrep (60% aqueous iodixanol) with 0.25 M sucrose/10 mM Tris, pH 7.5. After an 18-hour centrifugation step at 100,000 × g, 12 density gradient fractions were collected, diluted in PBS and centrifuged at 100,000 × g for 3 hours. To quantitate size and concentration of EVs, nanoparticle tracking analysis was performed using a Particle Metrix ZetaView PMX 110.
2.3. Preparation of negatively stained grids for transmission electron microscopy
For negative staining of purified LEVs and SEVs, Formvar carbon film–coated grids (FCF-200-Cu; Electron Microscopy Sciences) were washed in double distilled water and then washed by 100% ethanol. For each step, excess liquid was removed by wicking with filter paper. 10-μl samples were added to grids for 2 min. Grids were immediately stained with 2% phosphotungstic acid, pH 6.1, for 30s and allowed to air-dry. Grids were imaged using a FEI Tecnai T12 TEM (120 kV LaB6 source), Gatan cryotransfer stage, and AMT XR41-S side-mounted 2K × 2K CCD camera, 2102 SC.
2.4. Mass Spectrometry
2.4.1. Lysis of EVs, Protein Digestion and iTRAQ labeling
DKs8 EVs were solubilized by adding to an equal volume of 12 M Urea (cat. 9902, Ambion) /1 M triethylammonium bicarbonate buffer (TEAB) (cat. T7408, Sigma) to achieve a final concentration of 6 M Urea/0.5 M TEAB. The samples were sonicated twice for 10 min in ice-cold water in the ultrasonic water bath (model no. 97043–988, VWR) Cleared lysates were collected after centrifugation at top speed (13,500 rpm) for 10 min in a Prism R microcentrifuge (Labnet). The protein concentration of the cleared lysates was determined by Pierce BCA protein assay (cat no. 23225, Thermo Scientific). Protein samples were precipitated with ice-cold acetone overnight at −20°C. Following precipitation, samples were centrifuged at 18,000 × g at 4°C, and precipitates were washed with cold acetone, dried, and reconstituted in 8 M urea in 250 mM TEAB (pH 8.0). Samples were reduced with TCEP, alkylated with MMTS, diluted 4-fold with TEAB to obtain a final solution containing 2 M urea, and digested with sequencing-grade trypsin overnight. To facilitate quantitative analysis, peptides were labeled with iTRAQ reagents according to the manufacturer’s instructions (SCIEX). For 50 μg of protein, 1 unit of labeling reagent was used. Labeling reagent was reconstituted in ethanol such that each protein sample was labeled at a final concentration of 90% ethanol, and labeling was performed for 2 hours. Two-plex iTRAQ experiments were conducted. The resulting labeled peptides were then desalted by a modified Stage-tip method. iTRAQ-labeled samples were mixed and acidified with TFA. A disc of C18 extraction membrane (ChromTech. Inc. C18 SPE Empore disk) was cored with a 16-gauge needle, and the cored piece of membrane was fitted tightly into a 200μl pipet tip. Three mg of C18 resin (Phenomenex Jupiter C18, 5μm particle size) was suspended in 200μl of methanol and loaded into the pipet tip containing the cored C18 membrane. The C18 material was packed into the tip using centrifugation to form a resin-packed C18 clean-up tip (resin tip). Resin tips were equilibrated with 0.1 %TFA in HPLC-grade water, labeled peptides were loaded into the tip by centrifugation, washed with 0.1% TFA, and eluted with 100μl of 80% ACN containing 0.1%TFA. Eluted peptides were dried by speed vacuum centrifugation.
2.4.2. Reverse Phase Liquid Chromatography-MS/MS Analysis
Peptides were reconstituted in 0.1% formic acid, and peptides were loaded onto a self-packed biphasic C18/SCX MudPIT column using a Helium-pressurized cell (pressure bomb). The MudPIT column consisted of 360 × 150μm i.d. fused silica, which was fritted with a filter-end fitting (IDEX Health & Science) and packed with 6cm of Luna SCX material (5μm, 100Å) followed by 4cm of Jupiter C18 material (5μm, 300Å, Phenomenex). Once the sample was loaded, the MudPIT column was connected using an M-520 microfilter union (IDEX Health & Science) to an analytical column (360μm × 100μm i.d.), equipped with a laser-pulled emitter tip and packed with 20cm of C18 reverse phase material (Jupiter, 3μm beads, 300Å, Phenomenex). Using a Dionex Ultimate 3000 nanoLC and autosampler, MudPIT analysis was performed with a 13-step salt pulse gradient (0, 25, 50, 75, 100, 150, 200, 250, 300, 500, 750mM, 1M, and 2M ammonium acetate). Following each salt pulse delivered by the autosampler, peptides were gradient-eluted from the reverse analytical column at a flow rate of 500nL/min. Mobile phase solvents consisted of 0.1% formic acid, 99.9% water (solvent A) and 0.1% formic acid, 99.9% acetonitrile (solvent B). For the peptides from the first 11 SCX fractions, the reverse phase gradient consisted of 2–50 %B in 90 min, followed by a 15 min equilibration at 2 %B. For the last 2 SCX-eluted peptide fractions, the peptides were eluted from the reverse phase analytical column using a gradient of 2–98 %B in 100 min, followed by a 10 min equilibration at 2 %B. Peptides were introduced via nano-electrospray into a Q Exactive mass spectrometer (Thermo Scientific). The Q Exactive was operated in the data-dependent mode acquiring HCD MS/MS scans (R = 17,500) after each MS1 scan (R = 70,000) on the 20 most abundant ions using an MS1 ion target of 1 × 10⁶ ions and an MS2 target of 1 × 10⁵ ions. The HCD-normalized collision energy was set to 30, dynamic exclusion was set to 30 s, and peptide match and isotope exclusion were enabled. Mass spectra were processed using the Spectrum Mill software package (version B.04.00) (Agilent Technologies) and were searched against a database containing the Homo sapiens subset of the UniprotKB protein database (www.uniprot.org). MS/MS spectra acquired on the same precursor m/z (±0.01m/z) within ± 1 s in retention were merged. MS/MS spectra of poor quality which failed the quality filter by not having a sequence tag length >1 were excluded from searching. A minimum matched peak intensity requirement was set to 50%. Additional search parameters included: trypsin enzyme specificity with a maximum of three missed cleavages, ± 20 ppm precursor mass tolerance, ± 20 ppm (HCD) product mass tolerance, and fixed modifications including MMTS alkylation of cysteines and iTRAQ labeling of lysines and peptide N-termini. Oxidation of methionine was allowed as a variable modification. Autovalidation was performed such that peptide assignments to mass spectra were designated as valid following an automated procedure during which score thresholds were optimized separately for each precursor charge state and the maximum target-decoy-based false-discovery rate (FDR) was set to 1.0%. To obtain iTRAQ protein ratios, the median was calculated for all peptides assigned to each protein.
2.4.3. Protein Identification and quantification
MS/MS spectra were searched against a human subset of the UniProt KB protein database, and autovalidation procedures in Spectrum Mill were used to filter the data to <1% false discovery rates at the protein and peptide level. The median log2 iTRAQ protein ratios were calculated over all peptides identified for each protein, and frequency distributions were generated in GraphPad Prizm 6.01. Log2 ratios typically follow a normal distribution and were fit using least squares regression. The mean and d deviation values derived from the Gaussian fit were used to calculate p-values, using Z score statistics, with the calculated mean and standard deviation of the fitted dataset, is transformed to a standard normal variable (z = (x-m)/s). Since the properties of the standard normal curve are known, area under the curve for a particular value can be calculated, providing a p-value for each measured protein ratio. Calculated p-values were subsequently corrected for multiple comparisons using the Benjamini-Hochberg method. The mass spectrometry proteomics data have been deposited to the ProteomeXchange Consortium via the PRIDE 21 partner repository with the dataset identifier PXD010840. For reviewers: These data can be accessed with Username: reviewer10079@ebi.ac.uk and Password: TFElUccn
2.4.4. Differential expression analysis
Using R package Limma (v3.24.12) 22, we performed differential expression analysis on 1,415 proteins which were quantified in each of the three repetitive iTRAQ experiments. Requiring a minimum fold change of 4 and a maximum adjusted p value of 0.01, we identified 122 up-regulated and 1 down-regulated proteins.
2.4.5. Gene set enrichment analysis
Using R package org.Hs.eg.db (v3.1.2), we mapped the 1,415 proteins to 1,374 gene symbols. We used the moderated t-statistic value from the Limma analysis to rank genes, which is the ratio of the log2-fold change between SEV and LEV to its standard error. We performed gene set enrichment analysis 23 on the ranked gene list using one collection of gene sets in the Molecular Sigatures Database (MsigDB) (http://software.broadinstitute.org/gsea/msigdb/index.jsp). Candidate gene sets included 1,895 biological processes from Gene Ontology (GO) 24 that covered 5 to 100 genes from the 1374 mapped genes. At a criterion of FDR < 0.01, we identified 51 upregulated gene sets in SEVs and 52 upregulated ones in LEVs.
2.5. Western blot analysis
The protein concentrations of total cell lysates were determined utilizing Pierce BCA Assay (Cat. 23225, Thermo Fisher). The protein concentrations of the EVs were determined utilizing Pierce Micro BCA Assay (Cat. 23235, Thermo Fisher). For Western blots, 15 μg of TCLs, SEVs, LEVS, total precipitated protein (for gradient fractions) or equal volume of resuspended vesicles (for control and shRab27a-KD experiments) were boiled in SDS-Page sample buffer for 5 min and loaded on 10-well or 15-well 6%, 7%, 10% or 12.5% polyacrylamide gels. Proteins were transferred to nitrocellulose membranes for 1 h at 100 volts at 4°C. Membranes were blocked in 5% non-fat dry milk diluted in Tris-buffered saline with 0.5% Tween 20 (TBST) for 1 hour at room temperature. Primary antibodies were diluted in 5% non-fat dry milk -TBST (ARRDC1, 1:1000; EphA2, 1:1000; EphB1, 1:1000; EphB4, 1:32.5; Claudin 3, 1:1000; Thrombospondin-1, 1:1000; Integrin alpha-3, 1:1000; Integrin beta-8, 1:1000; hnRNPA1, 1:1000; Rab27a, 1:1000; Hsp70, 1:1000; CD63, 1:500; Flotillin, 1:1000; TSG101, 1:1000; and beta actin, 1:10000) and incubated overnight at 4°C. Membranes were washed 3 times for 10 min in TBST and subsequently incubated with species-specific HRP-conjugated secondary antibodies (1:10000; Promega) in 5% non-fat dry milk -TBST for 1 h at room temp. In the case of probing hnRNP H3, those membranes were blocked in 5% BSA in-TBST for 3+ hours at room temperature. The hnRNP H3 primary antibody was diluted in 5% BSA in-TBST (1:10000) and incubated overnight at 4°C. For detecting hnRNP H3, rabbit HRP secondary antibody was diluted at 1:10000 in 5% BSA in-TBST and incubated for 1 h at room temp. All membranes were washed 3 times for 10 min in TBST and incubated with an enhanced chemiluminescence (ECL) reagent (Thermo Scientific) for 1 min before being exposed to film or using a ChemiDoc Imager (BioRad) or Amersham 680 imager (GE). Multiple exposures were taken for each blot to have the complete dynamic range for densitometry measurements. The densitometry measurements for the protein bands were done using the Analysis Gels feature of ImageJ (NIH) 25.
2.6. Cell adhesion assay
Coated black clear bottom 96-well plates were prepared with 100 μl of 5 μg/ml, 10 μg/ml and 20 μg/ml of LEVs or SEVs at 4° C overnight, with triplicate wells per condition per experiment. 20 mg/ml of heat-denatured BSA was prepared in 1x PBS and incubated at 85° C for 10 min. After gently pipetting out the EV coatings, the wells were washed once with PBS. The designated wells were then blocked with the heat-denatured BSA and incubated for 6 h at room temperature. For the experiments in which we inhibited cell adhesion, 5 μg/ml normal mouse IgG1 antibody or integrin α3 blocking antibody (P1B5) was added in the heat-denatured BSA for the last 3 h of the blocking step. After the blocking steps (with or without antibodies), the wells were then washed gently once with PBS. DKs8 cells were detached with 10 mM EDTA and resuspended in DMEM. The cells were added to designated wells at a concentration of 37,500 cells in 100 μl. The cells were incubated at 37° C in a CO2 incubator for 30 min, 1 h or 2 h before washing gently three times with PBS. 100 μl of 5 μM Calcein AM diluted in PBS was added to each well and incubated at 37° C in a CO2 incubator for 1 h. The absorbance of each well was read at 530 nm on a VICTOR3 multilabel plate reader (Perkin Elmer).
2.7. Statistics
Experimental data were acquired from at least three independent experiments. Most data were compared using Welch’s t test in and plotted as mean and standard error of the mean in bar graphs in GraphPad Prism 7. In the assessments of the cargoes of SEVs secreted from control and Rab27a KD lines, the band intensities of the Western blot bands were compared using a paired t test in GraphPad Prism 7. Adhesion data were tested for normality using the D’Agostino-Pearson normality test in GraphPad Prism 7. Adhesion data were compared using Mann-Whitney test and plotted as box and whiskers plots with whiskers indicating 5–95 percentiles GraphPad Prism 7.
3. Results
3.1. Isolation and characterization of DKs8 LEVs and SEVs.
DKs8 EVs were isolated by a serial centrifugation protocol. The LEVs were collected by centrifuging conditioned media for 30 min at 10,000 × g. The supernatant was then further centrifuged at 100,000 × g for 18 h. The 100,000 × g pellet containing SEVs was further purified with an iodixanol density gradient, as described in the methods. Fractions 6 and 7 contained the highest concentration of SEVs, as shown by EV marker proteins present in Western blot analyses (Figure 1A). Notably Tsg101, CD63, Hsp70, and Flotillin-1 were all present in SEV preparations, whereas only Hsp70 and Flotillin-1 were present in LEVs (Figure 1A). Nanoparticle tracking analysis of the LEV and SEV fractions showed a respective mean vesicle diameter of ~ 200 and 100 nm (Figure 1B). The overall yield of SEVs was ~3 fold higher than the LEVs, suggesting that they are released in higher concentrations (Figure 1C). To further characterize the EVs, transmission electron microscopy (TEM) imaging of negatively stained samples was performed. The size of EVs in the TEM images was consistent with the NTA size analysis.
Figure 1. Characterization and proteomic analysis of DKs8 EVs.
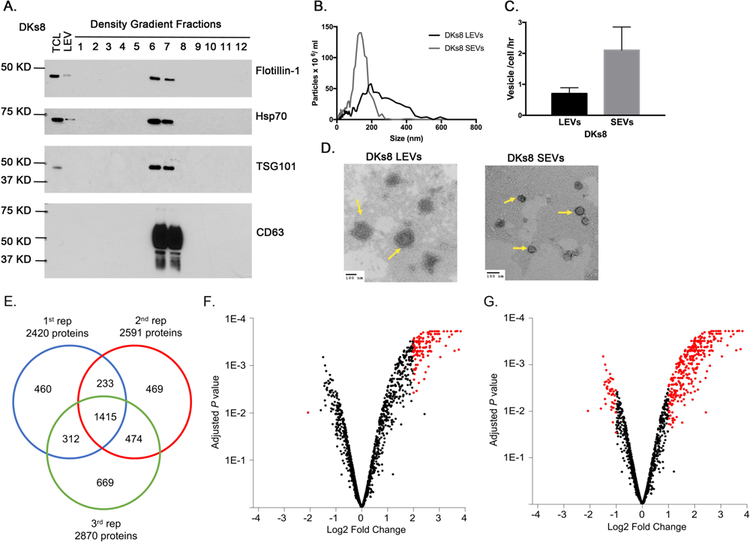
A. Western blot analysis of DKs8 total cell lysate, LEVs and density gradient fractions for Flotillin, Hsp70, Tsg101 and CD63. B. Representative traces from nanoparticle tracking analysis of DKs8 LEVs and SEVs. C. Quantitation of vesicle numbers from nanoparticle tracking analysis (n=3). D. Representative TEM images of DKs8 LEVs and SEVs. Yellow arrows point to the EVs. Scale bar shows 100 nm. E. Venn diagram showing the overlap of the proteins identified in the three iTRAQ replicates. F. Volcano plot highlighting proteins having p<0.01 and absolute log2 fold change >2 in red. G. Volcano plot highlighting proteins having p<0.05 and absolute log2 fold change >1 in red.
3.2. Comparison of protein composition of DKs8 EVs by iTRAQ.
To identify differences in the EV protein cargos, we utilized iTRAQ coupled with tandem mass spectrometry. Briefly LEVs and SEVs were solubilized in urea in triethylammonium bicarbonate (TEAB). Proteins were digested with trypsin and each peptide digest was labeled with a different iTRAQ reagent and before combining in a 1:1 ratio. The combined peptide mixture was analyzed by LC-MS/MS. The peptide sequences and relative quantity of peptides was determined by comparing the intensities of reporter ion signals in the MS/MS scan. The three independent experiments each reliably identified over 2400 proteins (2420, 2591, and 2870 proteins respectively, see Supplemental Table 1 for identified proteins from each replicate). Of these,1415 proteins were identified in all three replicates (Supplemental Table 1, Figure 1E). Differential expression analysis for the 1415 shared proteins indicated a significant degree of differential expression, with many proteins highly enriched in SEVs (Figure 1F, G). The volcano plot in Figure 1F highlights in red proteins having an adjusted P value <0.01 and absolute log2 fold change greater than 2 (i.e. > an absolute 4-fold difference in protein ratio). Under these criteria, there were 122 proteins significantly upregulated in SEVs as compared to LEVs; conversely, only one protein was significantly upregulated in LEVs. As iTRAQ can underestimate differences in protein ratios, we loosened the criteria for significant differential expression to an adjusted P value <0.05 and absolute log2 fold change greater than 1 (i.e. > an absolute 2-fold difference in protein ratio). Using these criteria, there were 333 proteins significantly upregulated in SEVs and 44 proteins significantly upregulated in LEVs (Figure 1G).
3.3. Gene set enrichment analysis of DKs8 EV protein cargos reveals enrichment of adhesion proteins in SEVs.
We performed Gene Set Enrichment Analysis to identify common classes of proteins enriched in EV subsets. We identified 51 gene sets that are significantly enriched for proteins up-regulated in DKs8 SEVs. Consistent with SEVs being highly enriched for exosomes, these gene sets include proteins associated with exosome biogenesis, including endosome organization, multivesicular body organization, and regulation of vesicle mediated transport (selected gene sets shown in Table 1, full list of gene sets shown in Supplemental Table 2). In addition, SEVs were also enriched for adhesion and motility processes, including cell junction organization, cell-matrix adhesion, and regulation of epithelial cell migration. We identified 52 gene sets that were significantly enriched for proteins up-regulated in LEVs. Many of these gene sets related to ribosomes, RNA biogenesis and processing, mitochondria, and metabolism (Table 1; Supplemental Table 2). As LEVs are generally considered to be representative of the shed MV EV population, these data are consistent with possible inclusion of cytoplasmic proteins and small organelles in budding MVs. Selected enrichment plots for the gene sets corresponding to the proteins up-regulated in SEVs and LEVs can be found in Supplemental Figures 1 and 2, respectively.
Table 1. Abbreviated list of GSEA categories for proteins enriched in SEVs and LEVs.
Some of the top gene sets for upregulated proteins in SEVs and in LEVs. For each gene set, the gene ontology (GO) name, # of proteins, normalized enrichment score, and false discovery rate (FDR) q value are listed.
| GO Name | # proteins | Normalized Enrichment Score | FDR q value |
|---|---|---|---|
| GO Upregulated in SEVs | |||
| GO Multi Organism Membrane Organization | 18 | 2.091002 | 0 |
| GO Multi Organism Membrane Budding | 16 | 2.0209222 | 3.25E-04 |
| GO Multivesicular Body Organization | 19 | 2.0184302 | 2.44E-04 |
| GO Endosome Organization | 26 | 1.9933468 | 2.74E-04 |
| GO Cell Junction Organization | 49 | 1.9155988 | 4.10E-04 |
| GO Extracellular Structure Organization | 45 | 1.8950502 | 5.96E-04 |
| GO Cell Junction Assembly | 36 | 1.8805888 | 0.001056492 |
| GO Regulation of Vesicle Mediated Transport | 69 | 1.8767959 | 0.001003668 |
| GO Cell Matrix Adhesion | 23 | 1.8749791 | 9.56E-04 |
| GO Cell Substrate Adhesion | 31 | 1.819944 | 0.002413904 |
| GO Cell Cell Adhesion | 65 | 1.7905699 | 0.00444845 |
| GO Regulation of Epithelial Cell Migration | 23 | 1.789166 | 0.004487467 |
| GO Movement in Host Environment | 23 | 1.7880955 | 0.004318077 |
| GO Cell Cell Signaling | 46 | 1.7619483 | 0.007418346 |
| GO Positive Regulation of Secretion | 30 | 1.7545458 | 0.008125004 |
| GO Upregulated in LEVs | |||
| GO Nuclear Transcribed mRNA Catabolic Process Nonsense Mediated Decay | 47 | −3.415154 | 0 |
| GO Ribosome Biogenesis | 64 | −3.395158 | 0 |
| GO rRNA Metabolic Process | 56 | −3.3872197 | 0 |
| GO Translational Initiation | 68 | −3.381736 | 0 |
| GO Multi Organism Metabolic Process | 52 | −3.27132 | 0 |
| GO ncRNA Processing | 70 | −3.0250304 | 0 |
| GO Ribonucleoprotein Complex Biogenesis | 97 | −2.8909724 | 0 |
| GO Carboxylic Acid Catabolic Process | 27 | −2.8225589 | 0 |
| GO RNA Catabolic Process | 65 | −2.8172946 | 0 |
| GO Protein Localization to Endoplasmic Reticulum | 51 | −2.8149292 | 0 |
| GO Generation of Precursor Metabolites and Energy | 46 | −2.7052698 | 0 |
| GO ncRNA Metabolic Process | 97 | −2.5512993 | 7.90E-05 |
| GO Protein Targeting to Membrane | 51 | −2.2677689 | 9.73E-04 |
| GO mRNA Processing | 77 | −2.0591824 | 0.008367863 |
3.4. Validation of proteins enriched in SEVs.
144 proteins were identified in all 3 replicates to be enriched in SEVs by at least four-fold (i.e. absolute log2 fold change greater than 2, Figure 1F), including cell-cell junction, cell-matrix adhesion, and MVB biogenesis proteins. As shown in Supplemental Table 3, these include an ephrin ligand (ephrin B2) and ephrin receptors (EphA2, EphB1, EphB4), tight junction proteins (junctional adhesion molecule A, claudin 3 and protocadherin-1), integrins and ECM proteins. To validate proteins for each of these general classes, Western blot analysis for specific candidate proteins was performed on DKs8 LEVs and SEVs (Figure 2). Western blot analysis confirmed that Eph receptors, integrin α3, integrin β8, the ECM protein thrombospondin-1, and claudin 3 were highly enriched in DKs8 SEVs in comparison to LEVs (Figure 2). This enrichment did not appear to be due to unequal protein loading, as assessed by Ponceau stains of blots (Supplemental Figure 3). To determine whether these results could be generalized to another cell type, we performed Western blot analysis for the same candidate proteins in a fibrosarcoma cell line, HT1080. We confirmed that Eph receptors, integrins and thrombospondin-1 are more abundant in HT1080 SEVs in comparison to HT1080 LEVs (Figure 2). We did not detect claudin 3 expressed in HT1080 EVs (Figure 2); however, these results are not surprising, since HT1080 cells do not form strong cell-cell junctions and may not form tight junctions at all 26–28. Note that in HT1080 cells, the EV marker Hsp70 is expressed equivalently in SEVs and LEVs, whereas in Dks8 cells, Hsp70 was expressed at a higher level in SEVs compared to LEVs. Therefore, we did not use it as an EV loading control.
Figure 2. Western blot validation of selected proteins in both the DKs8 and HT1080 EVs.
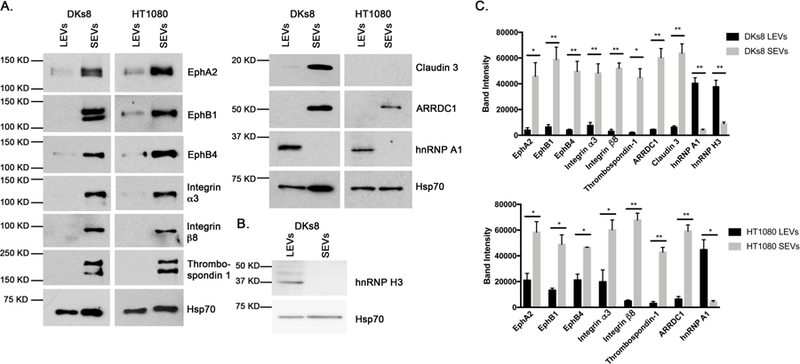
A. Western blot analysis of DKs8 and HT1080 EVs validating selected proteins (EphA2, EphB1, EphB4, Integrin α3, Integrin β8, Thrombospondin-1, ARRDC1, Claudin 3, hnRNP A1) identified in the iTRAQ study. B. Western blot analysis of DKs8 EVs validating hnRNP H3 identified in the iTRAQ study. C. Quantitation of Western blots from ≥3 independent experiments. * p < 0.05; ** p < 0.01; *** p < 0.001 comparing the band intensities of the DKs8 or HT1080 LEVs and SEVs.
There were 41 proteins that were identified by iTRAQ as two-fold enriched in LEVs compared to SEVs (adjusted P value <0.01). Although fewer proteins were enriched in LEVs, there was enrichment of proteins associated with RNA biogenesis and processing. Two of these proteins are heterogeneous nuclear ribonucleoprotein (hnRNP) A1 and hnRNP H3, which are both known to localize to cytoplasmic stress granules 29–31. Indeed, upon Western blot analysis, hnRNP A1 and hnRNP H3 were both greatly enriched in LEVs compared to SEVs (Figures 2A and2B).
3.5. Analysis of the contribution of ARRDC1 and Rab27a to SEV number and cargo.
Another highly abundant protein in the SEV preparation was arrestin-domain containing protein 1 (ARRDC1), which has been previously reported to induce budding of SEVs which are the size of exosomes (~100 nm in diameter) from the plasma membrane 7. Due to the size and density of ARRDC1-mediated microvesicles (ARMMs), these ARMMs are likely to be collected with exosomes in our serial centrifugation protocol 7. We confirmed by Western blot analysis that ARRDC1 is highly abundant In DKs8 and HT1080 SEVs when compared to their respective LEV preparations (Figure 2). To assess whether the protein cargos we validated are selectively enriched in DKs8 ARMMs in our SEV population, we down-regulated ARRDC1 in DKs8 cells by expressing shRNAs. Since ARRDC1 shRNA constructs 2 and 3 yielded the best knockdown (KD, Figure 3A), they were used for further experiments. Nanoparticle tracking analysis of EVs purified from control and KD cells revealed similar vesicle numbers (Figure 3B, C), suggesting that ARMMs are not a major contributor to the number of vesicles in the total SEV population. Western blot analysis for the presence of Eph receptors (A2, B1, B4), integrin α3, integrin β8, thrombospondin-1, claudin 3 and ARRDC1 in the SEVs from control and KD cells was performed (Figure 3D). We confirmed that ARRDC1 is present in control SEVs and undetectable in SEVs purified from the ARRDC1-KD lines (Figure 3D, E). The other protein cargos that we previously assessed did not show significant changes in SEVs in the ARRDC1 knockdown lines, with the exception of EphB1, which showed an increase in SEVs from DKs8 shARRDC1–3 cells (Figure 3D, E). These findings suggest that the ARMMs are a small subpopulation of the SEV population collected and not likely to be responsible for most of the cargo changes identified by proteomics between SEVs and LEVs.
Figure 3. Western blot analysis confirmed cell adhesion proteins are still present in ARRDC1 KD SEVs.

A. Western blot analysis of DKs8 shScramb. and shARRDC1-KD TCLs for ARRDC1 and Beta actin. B. Representative nanoparticle tracking traces of SEVs from DKs8 shScramb. and shARRDC1-KD cells. C. Quantitation of SEVs numbers from DKs8 shScramb. and shARRDC1–2 and −3 cells determined in nanoparticle tracking analysis (n=4). D. Western blot analysis of DKs8 shScramb. and shARRDC1-KD SEVs assessing the levels of EphA2, EphB1, EphB4, Integrin α3, Integrin β8, Thrombospondin-1, ARRDC1, Claudin 3 and Hsp70. E. Quantitation of Western blots from ≥3 independent experiments. * p < 0.05; *** p < 0.001 comparing the band intensities of DKs8 shScramb., shARRDC1-KD SEVs.
We also assessed the role of Rab27a in the biogenesis of our SEV population by KD in Dks8 cells. Rab27a is known to be a docking factor for MVBs 32 and thus should inhibit secretion of the exosome portion of the SEV population. Western blot analysis of the Rab27a-KD DKs8 cells revealed that Rab27a levels were decreased by 72% and 69% in KD1 and KD2 cells. Analysis of the purified EV yield from conditioned media collected from the Rab27a KD cells showed reductions in the number of SEVs secreted by 60% and 56%, respectively, in KD1 and KD2 cells, suggesting that a large portion of SEVs corresponds to exosomes (Fig S4A-C). Western blot analysis for the presence of Eph receptors (A2, B1, B4), integrin α3, integrin β8, thrombospondin-1, claudin 3, ARRD C1 and Rab27a in the SEVs from control and Rab27a KD cells was performed. We observed thrombospondin-1 and Rab27a were significantly reduced in the SEVs of the Rab27a KD lines when we compared loading of equal concentration of SEVs (Figure S4 D and E). The loading of equal volume of SEVs showed significant changes in all the protein cargoes assessed in both the Rab27a KD lines (Figure S4 D and E). It is unclear whether the lack of change in most SEV cargoes is due to incomplete KD of Rab27a, the presence of those cargoes on non-exosome populations, or the presence of those cargoes on both exosomal and non-exosomal SEV populations. Future studies with full gene KO of multiple biogenesis genes will likely be required to address this issue.
3.6. SEVs promote adhesion of DKs8 cells.
To validate that the increase in adhesion proteins identified in SEVs corresponds to functional differences, we tested whether SEVs preferentially promote adhesion of DKs8 cells. Various concentrations of LEVs and SEVs were coated onto black clear-bottom 96-well plates overnight before allowing cells to adhere for 30, 60 and 120 min. After gentle washing with PBS, cells were stained with calcein AM and adhesion was quantitated in a fluorimeter. We found that at all three time points and for all three coating concentrations, both the LEVs and SEVs significantly promoted Dks8 adhesion compared to the no coating condition. Consistent with their adhesion protein cargo content, SEVs were significantly more effective at promoting Dks8 adhesion at all three time points and for all three coating concentrations (Figure 4A). In order to further assess the contribution of integrin α3 in the enhanced cell adhesion by SEVs, we conducted the cell adhesion assay after preincubation with an integrin α3 blocking antibody (P1B5), a matched IgG control antibody, or no antibody. P1B5 has been previously shown to inhibit integrin α3 function 33, 34. In the presence of no antibody or IgG control antibody, SEVs similarly promoted DKs8 cell adhesion at all three time points and for all three coating concentrations compared to the no coating condition or to the LEV coating condition (Figure 4B). In contrast, in the presence of P1B5 integrin α3 blocking antibody, SEVs no longer enhanced Dks8 adhesion compared to LEVs (Figure 4B).
Figure 4. Small EVs promoted cell adhesion of DKs8 cells.

A. Calcein AM fluorescence of adherent cells was measured. In each of the independent experiments, all of conditions were performed in triplicate. Data is shown from four independent experiments. Note that at all three time points and for all three coating concentrations, both the LEVs and SEVs significantly promoted DKs8 adhesion compared to the no coating condition (p < 0.001). * p < 0.05; ** p < 0.01; *** p < 0.001 compared to equal LEVs and SEVs coating concentrations. B. Calcein AM fluorescence of adherent cells was measured for the cell adhesion assay in the presence of an integrin α3 blocking antibody (P1B5), a matched IgG control antibody or no antibody. In each of the independent experiments, all of conditions were performed in triplicate. Data is shown from three independent experiments. Note that the enhancements in cell adhesion by SEVs in the matched IgG conditions were not significantly altered when you compare the SEV-no antibody conditions at all three time points and for all three coating concentrations. *** p < 0.001 for equal SEVs coating concentrations in the presence of no antibody (top ***) and matched IgG (bottom ***) compared to in the presence of P1B5 integrin α3 blocking antibody.
4. Discussion
In this study, we performed a quantitative proteomic analysis of protein cargos in DKs8 LEVs, enriched for shed MVs, and SEVs, enriched for exosomes. In addition to exosome biogenesis proteins, we identified several proteins linked to cell-cell junctions and cell-matrix adhesion in SEVs, including Eph receptors, integrins, thrombospondin-1 and claudin 3. In contrast, the LEVs showed an abundance of proteins associated to metabolism, ribosomes, and RNA biogenesis and processing. Consistent with cell adhesion proteins being enriched in SEVs, we find that cell adhesion of DKs8 cells is enhanced with SEV coating compared to LEV coating, dependent on integrin α3. These findings contribute to understanding how the protein content of these different EVs can impact their different functional properties.
iTRAQ enables both relative and absolute quantitation of proteins and peptides by labeling peptides with isobaric reporter ions, thus facilitating the identification and quantitation of multiple samples simultaneously 35. Although many proteomic methods have been used, iTRAQ has emerged as a reliable discovery-based proteomic approach to quantitatively compare the protein content of EVs 16, 36–46. While previous iTRAQ studies mostly focused on exosomes, in this study we focused in comparing EV populations in unperturbed cells that have functional and biogenesis differences. In the three independent iTRAQ experiments done in this study, over 2400 proteins were reliably identified and all differences in the protein compositions of exosome-enriched SEVs and MV-enriched LEVs that we tested by Western blot analysis were validated. While we chose proteins to validate based on a 4-fold or 2-fold difference in the proteomic data, the differences were apparently much larger by Western blot analysis. This is consistent with the known compression of the dynamic range in iTRAQ 47, 48 and suggests that even small changes detected by iTRAQ may be worth following up if biologically interesting.
Our data suggest that a major function of SEVs is to promote cell-matrix and cell-cell adhesion. These findings are consistent with our previous report that HT1080 exosomes carry fibronectin and promote nascent adhesion formation and cell motility 15. Likewise, other reports have found that purified exosomes can promote cell adhesion 49–52. In one case, integrin αvβ6 in prostate cancer cell exosomes was found to be transferred to target cells to promote prostate cancer cell adhesion and migration 50. Thus, either surface binding of ECM or transfer of integrins are possible mechanisms by which exosomes/SEVs can promote cell adhesion and migration. Notably, we found both types of molecules were enriched in SEVs, including the integrins α3 and β8 and the ECM molecule thrombospondin-1 that we validated by Western blot. Thrombospondin-1 is known to play an integral role in cell adhesion through its integrin interactions 53–55 and exosomal thrombospondin-1 has been shown to bind leukocyte surface antigen (CD47) and facilitate MDSC chemotaxis and migration 56. Exosomal integrins have also been shown to direct metastatic niche formation and lead to organ-specific metastasis 57. This function is presumably related to their importance in mediating cellular adhesion, either by carrying ECM molecules, binding ECM at target organs, or by transferring the integrins to target cells. The interactions with surface tetraspanins, integrins and other intercellular adhesion molecules may facilitate the binding and internalization of EVs by recipient cells 2.
We also identified a number of cell-cell adhesion molecules to be enriched in SEVs. Notably, we identified that an ephrin and three Eph receptors were enriched in SEVs by at least four-fold. Eph receptors and their ephrin ligands play pivotal roles in the regulation of various physiological processes, including cellular adhesion and migration 58–65. Eph receptors are a family of receptor tyrosine kinases (RTKs) that bind to membrane-tethered ephrin ligands on neighboring cells 66, 67. Eph-ephrin signaling can be bidirectional and typically relies on cell-cell contacts 66, 67. Eph receptors and their ligands have been previously identified on exosomes 68–70. Gong et al. reported that EphB2 expressing exosomes trigger tyrosine phosphorylation of ephrin-B1 on neurons and cause neuronal growth cone collapse 68. The Eph receptors and ephrin ligand found in our SEVs have been found to regulate integrin signaling, cell adhesion and migration 58, 59, 64, 65, 71–75. It is unclear what the net result of Eph/ephrin signaling is since Ephs have been shown to both promote 71, 72, 76, 77, and suppress integrin-mediated cell adhesion 64, 78–80. In one study, EphB4 was found to enhance the expression and protein levels of integrin β8, which led to promotion of prostate cancer cell motility and invasion 81. Since we found both EphB4 and integrin β8 in our SEVs, it seems possible that they are transferred together in a signaling complex to exosomes.
Of the few proteins that were enriched in LEVs, there were three stress granule-associated RNA-binding proteins: heterogeneous nuclear ribonucleoprotein (hnRNP) A1, A/B and H3, identified by proteomics and we validated 2 of these by Western blot analysis 29, 31, 82–85. Of these, the most widely characterized stress granule-associated RNA-binding protein is hnRNP A1 29–31, 82, 85. hnRNP A1 is a RNA-binding protein that acts to transport pre-mRNA from the nucleus to the cytoplasm 86. hnRNP A1 is also involved in pre-mRNA processing 86. Under normal conditions, hnRNP A1 will return to the nucleus. However, under stress conditions, including heat shock, oxidative stress, high osmolarity medium and activation of p38 stress signaling pathway, hnRNP A1 is phosphorylated, methylated and accumulates in the cytoplasm in association with stress granules 29, 31, 85. hnRNP A1 has been reported to be overexpressed in gastric cancer (GC) and hepatocellular carcinoma (HCC) and drives invasion of GC and HCC cells 87, 88. Other hnRNPs have been implicated in the loading of RNAs, including miRNAs, into exosomes 89–91. Of these, we detected hnRNPA2B1, hnRNPQ (SYNCRIP), and MVP in this study along with 20 additional proteins predicted to bind EV RNA from the dataset in Statello et al. Most of these proteins were not preferentially enriched in the LEVs or SEVs, with the exceptions of 60S ribosomal protein L12 (2.4 higher in LEVs) and heat shock cognate 71 kDa protein (2.8 higher in SEVs).
In addition to the stress granule-associated RNA-binding proteins, some mitochondrial and ribosomal proteins were more abundant in the LEVs (Supplemental Table 3). Mitochondrial fragments, as well as mitochondrial proteins and DNA, have been detected in EVs 92–96. Phinney et al. also found LEVs have entire functional mitochondria 92. Ribosomal proteins have been found in both LEVs 93 and SEVs 94. Consistent with our data, Tricarico et al. used FunRich software to analyze public proteomics data on MVs in Vesiclepedia and identified many of similar functions to those that we found to be enriched in LEVs, including protein metabolism, energy and metabolic pathways and regulation of nucleic acid metabolism 97. At this point, it is not clear how specific cytoplasmic cargoes and organellar proteins are incorporated into LEVs/shedding MVs, i.e. whether it is a selective or random process 1, 97.
In this study, we collected SEVs by ultracentrifugation at 100,000 × g followed by purification with an iodixanol density gradient. Since ARMMs have a similar size distribution to exosomes 7, ARMMs were collected with exosomes in our serial centrifugation protocol. This is consistent with numerous reports of EV heterogeneity 3, 4, 98. Several groups have performed subfractionation of EV preparations. Willms et al. described two exosome subpopulations, low-density exosomes (LD-Exo) and high-density exosomes (HD-Exo), which have different protein and RNA compositions and biological effects on recipient cells 98. Kowal et al. compared the proteomes of dendritic cell EVs, collected after 2,000 × g (2K), 10,000 × g (10K) and 100,000 × g (100K) centrifugation 3. Consistent with our findings for the LEVs and SEVs, they found that Hsp70 and Flotillin-1 were detected in all three EVs populations 3. They used an iodixanol density gradient to further separate each of the 10K and 100K vesicles into two subfractions. The F3 and F5 fractions of the 10K EVs showed an enrichment of ribosomal proteins, while F5 fraction of the 10K EVs showed an enrichment of mitochondrial and ER proteins 3. The F3 fraction of the 100K EVs showed an enrichment of endosomal and plasma membrane proteins, while the F5 fraction of the 100K EVs showed an enrichment of extracellular matrix proteins 3. Recently the Lyden group utilized asymmetric flow-field flow fractionation (AF4) to characterize three subsets of SEVs: two exosome subpopulations (small exosomes, Exo-S, 60–80nm; large exosomes, Exo-L, 90–120nm) and a smaller population of vesicles that lack an external membrane (exomeres, <50nm) 4. Proteomic profiling of two exosome subpopulations identified enrichment of both populations with endosomal proteins and enrichment of cell-cell contact/junction proteins and most integrins in Exo-L 4. Proteomic profiling of exomeres showed enrichment of proteins of metabolic processes 4. Our findings are consistent with those previous studies and further emphasize the role of at least a subfraction of SEVs in potently promoting cellular adhesion and migration.
In our study, we assessed the contribution of ARRDC1 to the number and protein cargoes of SEVs. We found that knockdown of ARRDC1 did not affect the number of SEVs, suggesting that ARMMs are a small subpopulation of the collected SEVs. Besides showing that ARRDC1 is significantly reduced in SEVs purified from the ARRDC1 KD lines, the other previously assessed protein cargos did not show significant changes with the exception of EphB1, which was slightly upregulated. A previous proteomic comparison of the protein components of EVs secreted from GFP and ARRDC1-GFP expressing HEK293T cells found an enrichment of ESCRT proteins, NEDD4 E3 ligases, proteasome components, components of the NOTCH pathway and various integrins in ARRDC1-GFP ARMMs 19. While some of the same integrins were found to be enriched in our dataset, the two that we validated (integrin α3 and β8) were not among those enriched in ARMMs in that study. Recently Anand et al. assessed the role of Arrdc1 in the regulation of protein cargoes in exosomes/SEVs and ectosomes/LEVs isolated from WT and Arrdc1−/− mouse embryonic fibroblasts (MEFs) 99. They found that LEVs from Arrdc1−/− MEFs were depleted of proteins associated with mitochondria, urea cycle and transport between ER and Golgi membrane and SEVs from Arrdc1−/− MEFs were depleted of proteins involved with apoptotic cleavage of cell adhesion proteins and formation of the cornified envelope 99. Consistent with our results, none of the proteins that we validated by Western blot were found to be significantly different between WT and Arrdc1−/− MEFs.
In summary, iTRAQ is a useful method to identify protein differences in complex EV populations. Adhesion proteins appear to be particularly enriched in SEVs and may function to promote cell motility. We reported here that SEV coating promoted DKs8 cell adhesion compared to LEV coating. An interesting future direction could be to further explore the role of SEVs in other adhesion contexts, such as whether they promote or inhibit cell-cell adhesion.
Supplementary Material
Figure S1. Selected enrichment plots from Gene Set Enrichment Analysis representing proteins upregulated in SEVs.
Eight of the 51 significantly upregulated gene sets with proteins that show a striking enrichment in SEVs. The top portion of each plot shows the running enrichment score (ES) for the gene set. Each of these plots show a distinct peak at the beginning. The lower portion of each plot shows the proteins associated with the gene set and how they ranked in the ranked list, represented as black lines. There was an abundance of proteins near the enrichment peak. The red to blue bar corresponding to the log2 fold ratio of proteins in the SEVs over the LEVs, with red indicating an elevated level in exosome. The Normalized Enrichment Scores (NES) and False Discovery Rates (FDR) for each of these plots are shown in the upper right corner.
Figure S2. Selected enrichment plots from Gene Set Enrichment Analysis representing proteins upregulated in LEVs.
Eight of the 52 significantly upregulated gene sets with proteins that show an enrichment in LEVs. The top portion of each plot shows the running enrichment score (ES) for the gene set. Each of these plots show a distinct peak at the end of the plot. The lower portion of each plot shows the proteins associated with the gene set and how they ranked in the ranked list, represented as black lines. There was an abundance of proteins near the enrichment peak. The red to blue bar corresponding to the log2 fold ratio of proteins in the SEVs over the LEVs, with blue indicating an elevated level in LEVs. The Normalized Enrichment Scores (NES) and False Discovery Rates (FDR) for each of these plots are shown in the lower left corner.
Figure S3. Representative Ponceau-stained Western blot membranes.
Ponceau-stained Western blot 6% and 10% membranes of LEVs and SEVs from DKs8 and HT1080 cells. B. Ponceau-stained Western blot 7% and 10% membranes of SEVs from DKs8 shScramb. and shARRDC1-KD cells. C. Ponceau-stained Western blot 7% and 12.5% membranes of SEVs from DKs8 shScramb. and shRab27a-KD cells.
Figure S4. Western blot analysis of Rab27a KD SEVs.
A. Western blot analysis of DKs8 shScramb. and shRab27a-KD TCLs for Rab27a and Beta actin. B. Representative nanoparticle tracking traces of SEVs from DKs8 shScramb. and shRab27a-KD cells. C. Quantitation of SEV numbers from DKs8 shScramb. and shRab27a-KD cells determined in nanoparticle tracking analysis (n=3). D. Western blot analysis of DKs8 shScramb. and shRab27a-KD SEVs assessing the levels of SEV cargoes, as indicated. DKs8 shScramb. and shRab27a-KD SEVs were loaded at equal protein concentration or equal volume of resuspended vesicles. E. Quantitation of Western blots from 3 independent experiments * p < 0.05; ** p < 0.01 paired t test comparisons of the band intensities of DKs8 shScramb., shRab27a-KD SEVs.
Table S1. All the proteins identified in iTRAQ experiments.
Sheet 1- Proteins Identified in iTRAQ experiment 1; Sheet 2- Proteins Identified in iTRAQ experiment 2; Sheet 3- Proteins Identified in iTRAQ experiment 3; Sheet 4- The commonly identified proteins in all three iTRAQ Replicates; Sheet 5- The commonly identified proteins that showed an adjusted P value of < 0.01 in Limma analysis; Sheet 6- The proteins that showed an adjusted P value of < 0.01 and at least 2 fold enrichment in SEVs; Sheet 7- The proteins that showed an adjusted P value of < 0.01 and at least 2 fold enrichment in LEVs.
Table S2. Complete list of GSEA categories for proteins enriched in SEVs and LEVs.
The top 51 gene sets for upregulated proteins in SEV and the top 52 gene sets for upregulated proteins in LEVs. For each gene set, the gene ontology (GO) name, # of proteins, enrichment score, normalized enrichment score, nominal (NOM) p value, and false discovery rate (FDR) q value are listed.
Table S3. Categorization of proteins enriched in SEVs and LEVs.
Sheet 1- Categorization of proteins enriched in SEVs (at least 4-fold change, P value < 0.01); Sheet 2- Categorization of proteins enriched in LEVs (at least 2-fold change, P value < 0.01).
Acknowledgements
This study was funded by NIH grants U19 CA197514, U54CA217450, R01 GM117916, R01CA206458, UL1TR002243, T32 CA119925, and F32 CA217064. We thank Kristie Rose in the Mass Spectrometry Research Center (MSRC) Proteomics Laboratory at Vanderbilt University for conducting the iTRAQ-LC-MS/MS analysis.
Abbreviations:
- ARRDC1
arrestin-domain containing protein 1
- ARMMs
ARRDC1-mediated microvesicles
- EVs
extracellular vesicles
- ILVs
intraluminal vesicles
- iTRAQ
isobaric tag for relative and absolute quantitation
- GO
Gene Ontology
- LEVs
large EVs
- MVs
microvesicles
- MVEs
multivesicular endosomes
- RTKs
receptor tyrosine kinases
- SEVs
small EVs
Footnotes
Data are available via ProteomeXchange with identifier PXD010840.
Conflict of interest statement
No potential conflicts of interest were disclosed.
5. References
- 1.Maas SLN; Breakefield XO; Weaver AM, Extracellular Vesicles: Unique Intercellular Delivery Vehicles. Trends Cell Biol 2017, 27, (3), 172–188. [DOI] [PMC free article] [PubMed] [Google Scholar]
- 2.van Niel G; D’Angelo G; Raposo G, Shedding light on the cell biology of extracellular vesicles. Nature Reviews Molecular Cell Biology 2018, 19, (4), 213–228. [DOI] [PubMed] [Google Scholar]
- 3.Kowal J; Arras G; Colombo M; Jouve M; Morath JP; Primdal-Bengtson B; Dingli F; Loew D; Tkach M; Thery C, Proteomic comparison defines novel markers to characterize heterogeneous populations of extracellular vesicle subtypes. Proc Natl Acad Sci U S A 2016, 113, (8), E968–77. [DOI] [PMC free article] [PubMed] [Google Scholar]
- 4.Zhang H; Freitas D; Kim HS; Fabijanic K; Li Z; Chen H; Mark MT; Molina H; Martin AB; Bojmar L; Fang J; Rampersaud S; Hoshino A; Matei I; Kenific CM; Nakajima M; Mutvei AP; Sansone P; Buehring W; Wang H; Jimenez JP; Cohen-Gould L; Paknejad N; Brendel M; Manova-Todorova K; Magalhaes A; Ferreira JA; Osorio H; Silva AM; Massey A; Cubillos-Ruiz JR; Galletti G; Giannakakou P; Cuervo AM; Blenis J; Schwartz R; Brady MS; Peinado H; Bromberg J; Matsui H; Reis CA; Lyden D, Identification of distinct nanoparticles and subsets of extracellular vesicles by asymmetric flow field-flow fractionation. Nat Cell Biol 2018, 20, (3), 332–343. [DOI] [PMC free article] [PubMed] [Google Scholar]
- 5.Willms E; Cabanas C; Mager I; Wood MJA; Vader P, Extracellular Vesicle Heterogeneity: Subpopulations, Isolation Techniques, and Diverse Functions in Cancer Progression. Front Immunol 2018, 9, 738. [DOI] [PMC free article] [PubMed] [Google Scholar]
- 6.Sato S; Weaver AM, Extracellular vesicles: important collaborators in cancer progression. Essays Biochem 2018, 62, (2), 149–163. [DOI] [PMC free article] [PubMed] [Google Scholar]
- 7.Nabhan JF; Hu RX; Oh RS; Cohen SN; Lu Q, Formation and release of arrestin domain-containing protein 1-mediated microvesicles (ARMMs) at plasma membrane by recruitment of TSG101 protein. Proceedings of the National Academy of Sciences of the United States of America 2012, 109, (11), 4146–4151. [DOI] [PMC free article] [PubMed] [Google Scholar]
- 8.Stone L, Prostate cancer: Sending a signal through oncosomes. Nat Rev Urol 2017, 14, (5), 259. [DOI] [PubMed] [Google Scholar]
- 9.Minciacchi VR; Freeman MR; Di Vizio D, Extracellular vesicles in cancer: exosomes, microvesicles and the emerging role of large oncosomes. Semin Cell Dev Biol 2015, 40, 41–51. [DOI] [PMC free article] [PubMed] [Google Scholar]
- 10.Zhuang G; Wu X; Jiang Z; Kasman I; Yao J; Guan Y; Oeh J; Modrusan Z; Bais C; Sampath D; Ferrara N, Tumour-secreted miR-9 promotes endothelial cell migration and angiogenesis by activating the JAK-STAT pathway. EMBO J 2012, 31, (17), 3513–23. [DOI] [PMC free article] [PubMed] [Google Scholar]
- 11.Zhou W; Fong MY; Min Y; Somlo G; Liu L; Palomares MR; Yu Y; Chow A; O’Connor ST; Chin AR; Yen Y; Wang Y; Marcusson EG; Chu P; Wu J; Wu X; Li AX; Li Z; Gao H; Ren X; Boldin MP; Lin PC; Wang SE, Cancer-secreted miR-105 destroys vascular endothelial barriers to promote metastasis. Cancer Cell 2014, 25, (4), 501–15. [DOI] [PMC free article] [PubMed] [Google Scholar]
- 12.Rana S; Malinowska K; Zoller M, Exosomal tumor microRNA modulates premetastatic organ cells. Neoplasia 2013, 15, (3), 281–95. [DOI] [PMC free article] [PubMed] [Google Scholar]
- 13.Milane L; Singh A; Mattheolabakis G; Suresh M; Amiji MM, Exosome mediated communication within the tumor microenvironment. J Control Release 2015, 219, 278–94. [DOI] [PubMed] [Google Scholar]
- 14.Sung BH; Weaver AM, Exosome secretion promotes chemotaxis of cancer cells. Cell Adhesion & Migration 2017, 11, (2), 187–195. [DOI] [PMC free article] [PubMed] [Google Scholar]
- 15.Sung BH; Ketova T; Hoshino D; Zijlstra A; Weaver AM, Directional cell movement through tissues is controlled by exosome secretion. Nature Communications 2015, 6, 7164. [DOI] [PMC free article] [PubMed] [Google Scholar]
- 16.Yu Z; Zhao S; Ren L; Wang L; Chen Z; Hoffman RM; Zhou J, Pancreatic cancer-derived exosomes promote tumor metastasis and liver pre-metastatic niche formation. Oncotarget 2017, 8, (38), 63461–63483. [DOI] [PMC free article] [PubMed] [Google Scholar]
- 17.Berchem G; Noman MZ; Bosseler M; Paggetti J; Baconnais S; Le Cam E; Nanbakhsh A; Moussay E; Mami-Chouaib F; Janji B; Chouaib S, Hypoxic tumor-derived microvesicles negatively regulate NK cell function by a mechanism involving TGF-beta and miR23a transfer. Oncoimmunology 2016, 5, (4), e1062968. [DOI] [PMC free article] [PubMed] [Google Scholar]
- 18.Sedgwick AE; Clancy JW; Olivia Balmert M; D’Souza-Schorey C, Extracellular microvesicles and invadopodia mediate non-overlapping modes of tumor cell invasion. Sci Rep 2015, 5, 14748. [DOI] [PMC free article] [PubMed] [Google Scholar]
- 19.Wang Q; Lu Q, Plasma membrane-derived extracellular microvesicles mediate non-canonical intercellular NOTCH signaling. Nat Commun 2017, 8, (1), 709. [DOI] [PMC free article] [PubMed] [Google Scholar]
- 20.Sinha S; Hoshino D; Hong NH; Kirkbride KC; Grega-Larson NE; Seiki M; Tyska MJ; Weaver AM, Cortactin promotes exosome secretion by controlling branched actin dynamics. J Cell Biol 2016, 214, (2), 197–213. [DOI] [PMC free article] [PubMed] [Google Scholar]
- 21.Vizcaino JA; Csordas A; del-Toro N; Dianes JA; Griss J; Lavidas I; Mayer G; Perez-Riverol Y; Reisinger F; Ternent T; Xu QW; Wang R; Hermjakob H, 2016. update of the PRIDE database and its related tools. Nucleic Acids Res 2016, 44, (D1), D447–56. [DOI] [PMC free article] [PubMed] [Google Scholar]
- 22.Diboun I; Wernisch L; Orengo CA; Koltzenburg M, Microarray analysis after RNA amplification can detect pronounced differences in gene expression using limma. BMC Genomics 2006, 7, 252. [DOI] [PMC free article] [PubMed] [Google Scholar]
- 23.Subramanian A; Tamayo P; Mootha VK; Mukherjee S; Ebert BL; Gillette MA; Paulovich A; Pomeroy SL; Golub TR; Lander ES; Mesirov JP, Gene set enrichment analysis: a knowledge-based approach for interpreting genome-wide expression profiles. Proc Natl Acad Sci U S A 2005, 102, (43), 15545–50. [DOI] [PMC free article] [PubMed] [Google Scholar]
- 24.Ashburner M; Ball CA; Blake JA; Botstein D; Butler H; Cherry JM; Davis AP; Dolinski K; Dwight SS; Eppig JT; Harris MA; Hill DP; Issel-Tarver L; Kasarskis A; Lewis S; Matese JC; Richardson JE; Ringwald M; Rubin GM; Sherlock G, Gene ontology: tool for the unification of biology. The Gene Ontology Consortium. Nat Genet 2000, 25, (1), 25–9. [DOI] [PMC free article] [PubMed] [Google Scholar]
- 25.Schneider CA; Rasband WS; Eliceiri KW, NIH Image to ImageJ: 25 years of image analysis. Nat Methods 2012, 9, (7), 671–5. [DOI] [PMC free article] [PubMed] [Google Scholar]
- 26.Nakajima M; Nagase S; Iida M; Takeda S; Yamashita M; Watari A; Shirasago Y; Fukasawa M; Takeda H; Sawasaki T; Yagi K; Kondoh M, Claudin-1 Binder Enhances Epidermal Permeability in a Human Keratinocyte Model. J Pharmacol Exp Ther 2015, 354, (3), 440–7. [DOI] [PubMed] [Google Scholar]
- 27.Neesse A; Hahnenkamp A; Griesmann H; Buchholz M; Hahn SA; Maghnouj A; Fendrich V; Ring J; Sipos B; Tuveson DA; Bremer C; Gress TM; Michl P, Claudin-4-targeted optical imaging detects pancreatic cancer and its precursor lesions. Gut 2013, 62, (7), 1034–43. [DOI] [PubMed] [Google Scholar]
- 28.Mosley M; Knight J; Neesse A; Michl P; Iezzi M; Kersemans V; Cornelissen B, Claudin-4 SPECT Imaging Allows Detection of Aplastic Lesions in a Mouse Model of Breast Cancer. J Nucl Med 2015, 56, (5), 745–51. [DOI] [PubMed] [Google Scholar]
- 29.Guil S; Long JC; Caceres JF, hnRNP A1 relocalization to the stress granules reflects a role in the stress response. Mol Cell Biol 2006, 26, (15), 5744–58. [DOI] [PMC free article] [PubMed] [Google Scholar]
- 30.Goodier JL; Zhang L; Vetter MR; Kazazian HH Jr., LINE-1 ORF1 protein localizes in stress granules with other RNA-binding proteins, including components of RNA interference RNA-induced silencing complex. Mol Cell Biol 2007, 27, (18), 6469–83. [DOI] [PMC free article] [PubMed] [Google Scholar]
- 31.Wall ML; Lewis SM, Methylarginines within the RGG-Motif Region of hnRNP A1 Affect Its IRES Trans-Acting Factor Activity and Are Required for hnRNP A1 Stress Granule Localization and Formation. J Mol Biol 2017, 429, (2), 295–307. [DOI] [PubMed] [Google Scholar]
- 32.Ostrowski M; Carmo NB; Krumeich S; Fanget I; Raposo G; Savina A; Moita CF; Schauer K; Hume AN; Freitas RP; Goud B; Benaroch P; Hacohen N; Fukuda M; Desnos C; Seabra MC; Darchen F; Amigorena S; Moita LF; Thery C, Rab27a and Rab27b control different steps of the exosome secretion pathway. Nat Cell Biol 2010, 12, (1), 19–30; sup pp 1–13. [DOI] [PubMed] [Google Scholar]
- 33.Sugisawa M; Masaoka T; Enokiya Y; Muramatsu T; Hashimoto S; Yamada S; Shimono M, Expression and function of laminin and integrins on adhesion/migration of primary culture cells derived from rat oral epithelium. J Periodontal Res 2010, 45, (2), 284–91. [DOI] [PubMed] [Google Scholar]
- 34.Russell AJ; Fincher EF; Millman L; Smith R; Vela V; Waterman EA; Dey CN; Guide S; Weaver VM; Marinkovich MP, Alpha 6 beta 4 integrin regulates keratinocyte chemotaxis through differential GTPase activation and antagonism of alpha 3 beta 1 integrin. J Cell Sci 2003, 116, (Pt 17), 3543–56. [DOI] [PubMed] [Google Scholar]
- 35.Fuller HR; Morris GE, Quantitative Proteomics Using iTRAQ Labeling and Mass Spectrometry. Integrative Proteomics 2012, 442, 347–362. [Google Scholar]
- 36.An M; Lohse I; Tan Z; Zhu J; Wu J; Kurapati H; Morgan MA; Lawrence TS; Cuneo KC; Lubman DM, Quantitative Proteomic Analysis of Serum Exosomes from Patients with Locally Advanced Pancreatic Cancer Undergoing Chemoradiotherapy. J Proteome Res 2017, 16, (4), 1763–1772. [DOI] [PMC free article] [PubMed] [Google Scholar]
- 37.Chan YK; Zhang H; Liu P; Tsao SW; Lung ML; Mak NK; Ngok-Shun Wong R; Ying-Kit Yue P, Proteomic analysis of exosomes from nasopharyngeal carcinoma cell identifies intercellular transfer of angiogenic proteins. Int J Cancer 2015, 137, (8), 1830–41. [DOI] [PubMed] [Google Scholar]
- 38.Creaney J; Dick IM; Leon JS; Robinson BW, A Proteomic Analysis of the Malignant Mesothelioma Secretome Using iTRAQ. Cancer Genomics Proteomics 2017, 14, (2), 103–117. [DOI] [PMC free article] [PubMed] [Google Scholar]
- 39.Jeppesen DK; Nawrocki A; Jensen SG; Thorsen K; Whitehead B; Howard KA; Dyrskjot L; Orntoft TF; Larsen MR; Ostenfeld MS, Quantitative proteomics of fractionated membrane and lumen exosome proteins from isogenic metastatic and nonmetastatic bladder cancer cells reveal differential expression of EMT factors. Proteomics 2014, 14, (6), 699–712. [DOI] [PubMed] [Google Scholar]
- 40.Kawakami K; Fujita Y; Kato T; Mizutani K; Kameyama K; Tsumoto H; Miura Y; Deguchi T; Ito M, Integrin beta4 and vinculin contained in exosomes are potential markers for progression of prostate cancer associated with taxane-resistance. Int J Oncol 2015, 47, (1), 384–90. [DOI] [PubMed] [Google Scholar]
- 41.Raj DA; Fiume I; Capasso G; Pocsfalvi G, A multiplex quantitative proteomics strategy for protein biomarker studies in urinary exosomes. Kidney Int 2012, 81, (12), 1263–72. [DOI] [PubMed] [Google Scholar]
- 42.Sun Y; Zheng W; Guo Z; Ju Q; Zhu L; Gao J; Zhou L; Liu F; Xu Y; Zhan Q; Zhou Z; Sun W; Zhao X, A novel TP53 pathway influences the HGS-mediated exosome formation in colorectal cancer. Sci Rep 2016, 6, 28083. [DOI] [PMC free article] [PubMed] [Google Scholar]
- 43.Yang M; Song D; Cao X; Wu R; Liu B; Ye W; Wu J; Yue X, Comparative proteomic analysis of milk-derived exosomes in human and bovine colostrum and mature milk samples by iTRAQ-coupled LC-MS/MS. Food Res Int 2017, 92, 17–25. [DOI] [PubMed] [Google Scholar]
- 44.Zhu Y; Chen X; Pan Q; Wang Y; Su S; Jiang C; Li Y; Xu N; Wu L; Lou X; Liu S, A Comprehensive Proteomics Analysis Reveals a Secretory Path- and Status-Dependent Signature of Exosomes Released from Tumor-Associated Macrophages. J Proteome Res 2015, 14, (10), 4319–31. [DOI] [PubMed] [Google Scholar]
- 45.Fujita K; Kume H; Matsuzaki K; Kawashima A; Ujike T; Nagahara A; Uemura M; Miyagawa Y; Tomonaga T; Nonomura N, Proteomic analysis of urinary extracellular vesicles from high Gleason score prostate cancer. Sci Rep 2017, 7, 42961. [DOI] [PMC free article] [PubMed] [Google Scholar]
- 46.Brzozowski JS; Bond DR; Jankowski H; Goldie BJ; Burchell R; Naudin C; Smith ND; Scarlett CJ; Larsen MR; Dun MD; Skelding KA; Weidenhofer J, Extracellular vesicles with altered tetraspanin CD9 and CD151 levels confer increased prostate cell motility and invasion. Sci Rep 2018, 8, (1), 8822. [DOI] [PMC free article] [PubMed] [Google Scholar]
- 47.Karp NA; Huber W; Sadowski PG; Charles PD; Hester SV; Lilley KS, Addressing accuracy and precision issues in iTRAQ quantitation. Mol Cell Proteomics 2010, 9, (9), 1885–97. [DOI] [PMC free article] [PubMed] [Google Scholar]
- 48.Rauniyar N; Yates JR 3rd, Isobaric labeling-based relative quantification in shotgun proteomics. J Proteome Res 2014, 13, (12), 5293–309. [DOI] [PMC free article] [PubMed] [Google Scholar]
- 49.Koumangoye RB; Sakwe AM; Goodwin JS; Patel T; Ochieng J, Detachment of breast tumor cells induces rapid secretion of exosomes which subsequently mediate cellular adhesion and spreading. PLoS One 2011, 6, (9), e24234. [DOI] [PMC free article] [PubMed] [Google Scholar]
- 50.Fedele C; Singh A; Zerlanko BJ; Iozzo RV; Languino LR, The alphavbeta6 integrin is transferred intercellularly via exosomes. J Biol Chem 2015, 290, (8), 4545–51. [DOI] [PMC free article] [PubMed] [Google Scholar]
- 51.Fu Q; Zhang Q; Lou Y; Yang J; Nie G; Chen Q; Chen Y; Zhang J; Wang J; Wei T; Qin H; Dang X; Bai X; Liang T, Primary tumor-derived exosomes facilitate metastasis by regulating adhesion of circulating tumor cells via SMAD3 in liver cancer. Oncogene 2018. [DOI] [PMC free article] [PubMed]
- 52.Arita T; Ichikawa D; Konishi H; Komatsu S; Shiozaki A; Ogino S; Fujita Y; Hiramoto H; Hamada J; Shoda K; Kosuga T; Fujiwara H; Okamoto K; Otsuji E, Tumor exosome-mediated promotion of adhesion to mesothelial cells in gastric cancer cells. Oncotarget 2016, 7, (35), 56855–56863. [DOI] [PMC free article] [PubMed] [Google Scholar]
- 53.John AS; Rothman VL; Tuszynski GP, Thrombospondin-1 (TSP-1) Stimulates Expression of Integrin alpha6 in Human Breast Carcinoma Cells: A Downstream Modulator of TSP-1-Induced Cellular Adhesion. J Oncol 2010, 2010, 645376. [DOI] [PMC free article] [PubMed] [Google Scholar]
- 54.Guo N; Templeton NS; Al-Barazi H; Cashel JA; Sipes JM; Krutzsch HC; Roberts DD, Thrombospondin-1 promotes alpha3beta1 integrin-mediated adhesion and neurite-like outgrowth and inhibits proliferation of small cell lung carcinoma cells. Cancer Res 2000, 60, (2), 457–66. [PubMed] [Google Scholar]
- 55.Duquette M; Sadow PM; Lawler J; Nucera C, Thrombospondin-1 Silencing Down-Regulates Integrin Expression Levels in Human Anaplastic Thyroid Cancer Cells with BRAF(V600E): New Insights in the Host Tissue Adaptation and Homeostasis of Tumor Microenvironment. Front Endocrinol (Lausanne) 2013, 4, 189. [DOI] [PMC free article] [PubMed] [Google Scholar]
- 56.Chauhan S; Danielson S; Clements V; Edwards N; Ostrand-Rosenberg S; Fenselau C, Surface Glycoproteins of Exosomes Shed by Myeloid-Derived Suppressor Cells Contribute to Function. J Proteome Res 2017, 16, (1), 238–246. [DOI] [PMC free article] [PubMed] [Google Scholar]
- 57.Hoshino A; Costa-Silva B; Shen TL; Rodrigues G; Hashimoto A; Tesic Mark M; Molina H; Kohsaka S; Di Giannatale A; Ceder S; Singh S; Williams C; Soplop N; Uryu K; Pharmer L; King T; Bojmar L; Davies AE; Ararso Y; Zhang T; Zhang H; Hernandez J; Weiss JM; Dumont-Cole VD; Kramer K; Wexler LH; Narendran A; Schwartz GK; Healey JH; Sandstrom P; Labori KJ; Kure EH; Grandgenett PM; Hollingsworth MA; de Sousa M; Kaur S; Jain M; Mallya K; Batra SK; Jarnagin WR; Brady MS; Fodstad O; Muller V; Pantel K; Minn AJ; Bissell MJ; Garcia BA; Kang Y; Rajasekhar VK; Ghajar CM; Matei I; Peinado H; Bromberg J; Lyden D, Tumour exosome integrins determine organotropic metastasis. Nature 2015, 527, (7578), 329–35. [DOI] [PMC free article] [PubMed] [Google Scholar]
- 58.Han DC; Shen TL; Miao H; Wang B; Guan JL, EphB1 associates with Grb7 and regulates cell migration. J Biol Chem 2002, 277, (47), 45655–61. [DOI] [PubMed] [Google Scholar]
- 59.Vindis C; Teli T; Cerretti DP; Turner CE; Huynh-Do U, EphB1-mediated cell migration requires the phosphorylation of paxillin at Tyr-31/Tyr-118. J Biol Chem 2004, 279, (27), 27965–70. [DOI] [PubMed] [Google Scholar]
- 60.Park I; Lee HS, EphB/ephrinB signaling in cell adhesion and migration. Mol Cells 2015, 38, (1), 14–9. [DOI] [PMC free article] [PubMed] [Google Scholar]
- 61.Yamazaki T; Masuda J; Omori T; Usui R; Akiyama H; Maru Y, EphA1 interacts with integrin-linked kinase and regulates cell morphology and motility. J Cell Sci 2009, 122, (Pt 2), 243–55. [DOI] [PubMed] [Google Scholar]
- 62.Anselmo A; Lauranzano E; Soldani C; Ploia C; Angioni R; D’Amico G; Sarukhan A; Mazzon C; Viola A, Identification of a novel agrin-dependent pathway in cell signaling and adhesion within the erythroid niche. Cell Death Differ 2016, 23, (8), 1322–30. [DOI] [PMC free article] [PubMed] [Google Scholar]
- 63.Vindis C; Cerretti DP; Daniel TO; Huynh-Do U, EphB1 recruits c-Src and p52Shc to activate MAPK/ERK and promote chemotaxis. J Cell Biol 2003, 162, (4), 661–71. [DOI] [PMC free article] [PubMed] [Google Scholar]
- 64.Miao H; Burnett E; Kinch M; Simon E; Wang B, Activation of EphA2 kinase suppresses integrin function and causes focal-adhesion-kinase dephosphorylation. Nat Cell Biol 2000, 2, (2), 62–9. [DOI] [PubMed] [Google Scholar]
- 65.Taddei ML; Parri M; Angelucci A; Bianchini F; Marconi C; Giannoni E; Raugei G; Bologna M; Calorini L; Chiarugi P, EphA2 induces metastatic growth regulating amoeboid motility and clonogenic potential in prostate carcinoma cells. Mol Cancer Res 2011, 9, (2), 149–60. [DOI] [PubMed] [Google Scholar]
- 66.Pasquale EB, Exosomes expand the sphere of influence of Eph receptors and ephrins. J Cell Biol 2016, 214, (1), 5–7. [DOI] [PMC free article] [PubMed] [Google Scholar]
- 67.Taylor H; Campbell J; Nobes CD, Ephs and ephrins. Curr Biol 2017, 27, (3), R90–R95. [DOI] [PubMed] [Google Scholar]
- 68.Gong J; Korner R; Gaitanos L; Klein R, Exosomes mediate cell contact-independent ephrin-Eph signaling during axon guidance. J Cell Biol 2016, 214, (1), 35–44. [DOI] [PMC free article] [PubMed] [Google Scholar]
- 69.Guo J; Cui Y; Yan Z; Luo Y; Zhang W; Deng S; Tang S; Zhang G; He QY; Wang T, Phosphoproteome Characterization of Human Colorectal Cancer SW620 Cell-Derived Exosomes and New Phosphosite Discovery for C-HPP. J Proteome Res 2016, 15, (11), 4060–4072. [DOI] [PubMed] [Google Scholar]
- 70.Ji H; Greening DW; Barnes TW; Lim JW; Tauro BJ; Rai A; Xu R; Adda C; Mathivanan S; Zhao W; Xue Y; Xu T; Zhu HJ; Simpson RJ, Proteome profiling of exosomes derived from human primary and metastatic colorectal cancer cells reveal differential expression of key metastatic factors and signal transduction components. Proteomics 2013, 13, (10–11), 1672–86. [DOI] [PubMed] [Google Scholar]
- 71.de Saint-Vis B; Bouchet C; Gautier G; Valladeau J; Caux C; Garrone P, Human dendritic cells express neuronal Eph receptor tyrosine kinases: role of EphA2 in regulating adhesion to fibronectin. Blood 2003, 102, (13), 4431–40. [DOI] [PubMed] [Google Scholar]
- 72.Saeki N; Nishino S; Shimizu T; Ogawa K, EphA2 promotes cell adhesion and spreading of monocyte and monocyte/macrophage cell lines on integrin ligand-coated surfaces. Cell Adh Migr 2015, 9, (6), 469–82. [DOI] [PMC free article] [PubMed] [Google Scholar]
- 73.Larsen AB; Stockhausen MT; Poulsen HS, Cell adhesion and EGFR activation regulate EphA2 expression in cancer. Cell Signal 2010, 22, (4), 636–44. [DOI] [PubMed] [Google Scholar]
- 74.Heroult M; Schaffner F; Pfaff D; Prahst C; Kirmse R; Kutschera S; Riedel M; Ludwig T; Vajkoczy P; Graeser R; Augustin HG, EphB4 promotes site-specific metastatic tumor cell dissemination by interacting with endothelial cell-expressed ephrinB2. Mol Cancer Res 2010, 8, (10), 1297–309. [DOI] [PubMed] [Google Scholar]
- 75.Pfaff D; Heroult M; Riedel M; Reiss Y; Kirmse R; Ludwig T; Korff T; Hecker M; Augustin HG, Involvement of endothelial ephrin-B2 in adhesion and transmigration of EphB-receptor-expressing monocytes. J Cell Sci 2008, 121, (Pt 22), 3842–50. [DOI] [PubMed] [Google Scholar]
- 76.Gu C; Park S, The EphA8 receptor regulates integrin activity through p110gamma phosphatidylinositol-3 kinase in a tyrosine kinase activity-independent manner. Mol Cell Biol 2001, 21, (14), 4579–97. [DOI] [PMC free article] [PubMed] [Google Scholar]
- 77.Davy A; Robbins SM, Ephrin-A5 modulates cell adhesion and morphology in an integrin-dependent manner. EMBO J 2000, 19, (20), 5396–405. [DOI] [PMC free article] [PubMed] [Google Scholar]
- 78.Zou JX; Wang B; Kalo MS; Zisch AH; Pasquale EB; Ruoslahti E, An Eph receptor regulates integrin activity through R-Ras. Proc Natl Acad Sci U S A 1999, 96, (24), 13813–8. [DOI] [PMC free article] [PubMed] [Google Scholar]
- 79.Bourgin C; Murai KK; Richter M; Pasquale EB, The EphA4 receptor regulates dendritic spine remodeling by affecting beta1-integrin signaling pathways. J Cell Biol 2007, 178, (7), 1295–307. [DOI] [PMC free article] [PubMed] [Google Scholar]
- 80.Deroanne C, EphrinA1 inactivates integrin-mediated vascular smooth muscle cell spreading via the Rac/PAK pathway. Journal of Cell Science 2003, 116, (7), 1367–1376. [DOI] [PubMed] [Google Scholar]
- 81.Mertens-Walker I; Fernandini BC; Maharaj MS; Rockstroh A; Nelson CC; Herington AC; Stephenson SA, The tumour-promoting receptor tyrosine kinase, EphB4, regulates expression of integrin-beta8 in prostate cancer cells. BMC Cancer 2015, 15, 164. [DOI] [PMC free article] [PubMed] [Google Scholar]
- 82.Douglas JN; Gardner LA; Salapa HE; Levin MC, Antibodies to the RNA Binding Protein Heterogeneous Nuclear Ribonucleoprotein A1 Colocalize to Stress Granules Resulting in Altered RNA and Protein Levels in a Model of Neurodegeneration in Multiple Sclerosis. J Clin Cell Immunol 2016, 7, (2), 402. [DOI] [PMC free article] [PubMed] [Google Scholar]
- 83.Markmiller S; Soltanieh S; Server KL; Mak R; Jin W; Fang MY; Luo EC; Krach F; Yang D; Sen A; Fulzele A; Wozniak JM; Gonzalez DJ; Kankel MW; Gao FB; Bennett EJ; Lecuyer E; Yeo GW, Context-Dependent and Disease-Specific Diversity in Protein Interactions within Stress Granules. Cell 2018, 172, (3), 590–604 e13. [DOI] [PMC free article] [PubMed] [Google Scholar]
- 84.Jain S; Wheeler JR; Walters RW; Agrawal A; Barsic A; Parker R, ATPase-Modulated Stress Granules Contain a Diverse Proteome and Substructure. Cell 2016, 164, (3), 487–98. [DOI] [PMC free article] [PubMed] [Google Scholar]
- 85.Papadopoulou C; Ganou V; Patrinou-Georgoula M; Guialis A, HuR-hnRNP interactions and the effect of cellular stress. Mol Cell Biochem 2013, 372, (1–2), 137–47. [DOI] [PubMed] [Google Scholar]
- 86.Ko CC; Chen YJ; Chen CT; Liu YC; Cheng FC; Hsu KC; Chow LP, Chemical proteomics identifies heterogeneous nuclear ribonucleoprotein (hnRNP) A1 as the molecular target of quercetin in its anti-cancer effects in PC-3 cells. J Biol Chem 2014, 289, (32), 22078–89. [DOI] [PMC free article] [PubMed] [Google Scholar]
- 87.Chen YH; Liu J; Wang W; Xiang L; Wang JD; Liu SD; Zhou HY; Guo Z, High expression of hnRNPA1 promotes cell invasion by inducing EMT in gastric cancer. Oncology Reports 2018, 39, (4), 1693–1701. [DOI] [PMC free article] [PubMed] [Google Scholar]
- 88.Zhou ZJ; Dai Z; Zhou SL; Fu XT; Zhao YM; Shi YH; Zhou J; Fan J, Overexpression of HnRNP A1 promotes tumor invasion through regulating CD44v6 and indicates poor prognosis for hepatocellular carcinoma. Int J Cancer 2013, 132, (5), 1080–9. [DOI] [PubMed] [Google Scholar]
- 89.Villarroya-Beltri C; Gutierrez-Vazquez C; Sanchez-Cabo F; Perez-Hernandez D; Vazquez J; Martin-Cofreces N; Martinez-Herrera DJ; Pascual-Montano A; Mittelbrunn M; Sanchez-Madrid F, Sumoylated hnRNPA2B1 controls the sorting of miRNAs into exosomes through binding to specific motifs. Nat Commun 2013, 4, 2980. [DOI] [PMC free article] [PubMed] [Google Scholar]
- 90.Santangelo L; Giurato G; Cicchini C; Montaldo C; Mancone C; Tarallo R; Battistelli C; Alonzi T; Weisz A; Tripodi M, The RNA-Binding Protein SYNCRIP Is a Component of the Hepatocyte Exosomal Machinery Controlling MicroRNA Sorting. Cell Rep 2016, 17, (3), 799–808. [DOI] [PubMed] [Google Scholar]
- 91.Statello L; Maugeri M; Garre E; Nawaz M; Wahlgren J; Papadimitriou A; Lundqvist C; Lindfors L; Collen A; Sunnerhagen P; Ragusa M; Purrello M; Di Pietro C; Tigue N; Valadi H, Identification of RNA-binding proteins in exosomes capable of interacting with different types of RNA: RBP-facilitated transport of RNAs into exosomes. PLoS One 2018, 13, (4), e0195969. [DOI] [PMC free article] [PubMed] [Google Scholar]
- 92.Phinney DG; Di Giuseppe M; Njah J; Sala E; Shiva S; St Croix CM; Stolz DB; Watkins SC; Di YP; Leikauf GD; Kolls J; Riches DW; Deiuliis G; Kaminski N; Boregowda SV; McKenna DH; Ortiz LA, Mesenchymal stem cells use extracellular vesicles to outsource mitophagy and shuttle microRNAs. Nat Commun 2015, 6, 8472. [DOI] [PMC free article] [PubMed] [Google Scholar]
- 93.Keerthikumar S; Gangoda L; Liem M; Fonseka P; Atukorala I; Ozcitti C; Mechler A; Adda CG; Ang CS; Mathivanan S, Proteogenomic analysis reveals exosomes are more oncogenic than ectosomes. Oncotarget 2015, 6, (17), 15375–96. [DOI] [PMC free article] [PubMed] [Google Scholar]
- 94.Dozio V; Sanchez JC, Characterisation of extracellular vesicle-subsets derived from brain endothelial cells and analysis of their protein cargo modulation after TNF exposure. J Extracell Vesicles 2017, 6, (1), 1302705. [DOI] [PMC free article] [PubMed] [Google Scholar]
- 95.Haraszti RA; Didiot MC; Sapp E; Leszyk J; Shaffer SA; Rockwell HE; Gao F; Narain NR; DiFiglia M; Kiebish MA; Aronin N; Khvorova A, High-resolution proteomic and lipidomic analysis of exosomes and microvesicles from different cell sources. J Extracell Vesicles 2016, 5, 32570. [DOI] [PMC free article] [PubMed] [Google Scholar]
- 96.Torralba D; Baixauli F; Sanchez-Madrid F, Mitochondria Know No Boundaries: Mechanisms and Functions of Intercellular Mitochondrial Transfer. Front Cell Dev Biol 2016, 4, 107. [DOI] [PMC free article] [PubMed] [Google Scholar]
- 97.Tricarico C; Clancy J; D’Souza-Schorey C, Biology and biogenesis of shed microvesicles. Small GTPases 2017, 8, (4), 220–232. [DOI] [PMC free article] [PubMed] [Google Scholar]
- 98.Willms E; Johansson HJ; Mager I; Lee Y; Blomberg KE; Sadik M; Alaarg A; Smith CI; Lehtio J; El Andaloussi S; Wood MJ; Vader P, Cells release subpopulations of exosomes with distinct molecular and biological properties. Sci Rep 2016, 6, 22519. [DOI] [PMC free article] [PubMed] [Google Scholar]
- 99.Anand S; Foot N; Ang CS; Gembus KM; Keerthikumar S; Adda CG; Mathivanan S; Kumar S, Arrestin-Domain Containing Protein 1 (Arrdc1) Regulates the Protein Cargo and Release of Extracellular Vesicles. Proteomics 2018, 18, (17), e1800266. [DOI] [PubMed] [Google Scholar]
Associated Data
This section collects any data citations, data availability statements, or supplementary materials included in this article.
Supplementary Materials
Figure S1. Selected enrichment plots from Gene Set Enrichment Analysis representing proteins upregulated in SEVs.
Eight of the 51 significantly upregulated gene sets with proteins that show a striking enrichment in SEVs. The top portion of each plot shows the running enrichment score (ES) for the gene set. Each of these plots show a distinct peak at the beginning. The lower portion of each plot shows the proteins associated with the gene set and how they ranked in the ranked list, represented as black lines. There was an abundance of proteins near the enrichment peak. The red to blue bar corresponding to the log2 fold ratio of proteins in the SEVs over the LEVs, with red indicating an elevated level in exosome. The Normalized Enrichment Scores (NES) and False Discovery Rates (FDR) for each of these plots are shown in the upper right corner.
Figure S2. Selected enrichment plots from Gene Set Enrichment Analysis representing proteins upregulated in LEVs.
Eight of the 52 significantly upregulated gene sets with proteins that show an enrichment in LEVs. The top portion of each plot shows the running enrichment score (ES) for the gene set. Each of these plots show a distinct peak at the end of the plot. The lower portion of each plot shows the proteins associated with the gene set and how they ranked in the ranked list, represented as black lines. There was an abundance of proteins near the enrichment peak. The red to blue bar corresponding to the log2 fold ratio of proteins in the SEVs over the LEVs, with blue indicating an elevated level in LEVs. The Normalized Enrichment Scores (NES) and False Discovery Rates (FDR) for each of these plots are shown in the lower left corner.
Figure S3. Representative Ponceau-stained Western blot membranes.
Ponceau-stained Western blot 6% and 10% membranes of LEVs and SEVs from DKs8 and HT1080 cells. B. Ponceau-stained Western blot 7% and 10% membranes of SEVs from DKs8 shScramb. and shARRDC1-KD cells. C. Ponceau-stained Western blot 7% and 12.5% membranes of SEVs from DKs8 shScramb. and shRab27a-KD cells.
Figure S4. Western blot analysis of Rab27a KD SEVs.
A. Western blot analysis of DKs8 shScramb. and shRab27a-KD TCLs for Rab27a and Beta actin. B. Representative nanoparticle tracking traces of SEVs from DKs8 shScramb. and shRab27a-KD cells. C. Quantitation of SEV numbers from DKs8 shScramb. and shRab27a-KD cells determined in nanoparticle tracking analysis (n=3). D. Western blot analysis of DKs8 shScramb. and shRab27a-KD SEVs assessing the levels of SEV cargoes, as indicated. DKs8 shScramb. and shRab27a-KD SEVs were loaded at equal protein concentration or equal volume of resuspended vesicles. E. Quantitation of Western blots from 3 independent experiments * p < 0.05; ** p < 0.01 paired t test comparisons of the band intensities of DKs8 shScramb., shRab27a-KD SEVs.
Table S1. All the proteins identified in iTRAQ experiments.
Sheet 1- Proteins Identified in iTRAQ experiment 1; Sheet 2- Proteins Identified in iTRAQ experiment 2; Sheet 3- Proteins Identified in iTRAQ experiment 3; Sheet 4- The commonly identified proteins in all three iTRAQ Replicates; Sheet 5- The commonly identified proteins that showed an adjusted P value of < 0.01 in Limma analysis; Sheet 6- The proteins that showed an adjusted P value of < 0.01 and at least 2 fold enrichment in SEVs; Sheet 7- The proteins that showed an adjusted P value of < 0.01 and at least 2 fold enrichment in LEVs.
Table S2. Complete list of GSEA categories for proteins enriched in SEVs and LEVs.
The top 51 gene sets for upregulated proteins in SEV and the top 52 gene sets for upregulated proteins in LEVs. For each gene set, the gene ontology (GO) name, # of proteins, enrichment score, normalized enrichment score, nominal (NOM) p value, and false discovery rate (FDR) q value are listed.
Table S3. Categorization of proteins enriched in SEVs and LEVs.
Sheet 1- Categorization of proteins enriched in SEVs (at least 4-fold change, P value < 0.01); Sheet 2- Categorization of proteins enriched in LEVs (at least 2-fold change, P value < 0.01).