(Molecular Cell 68, 901–912.e1–e3; December 7, 2017)
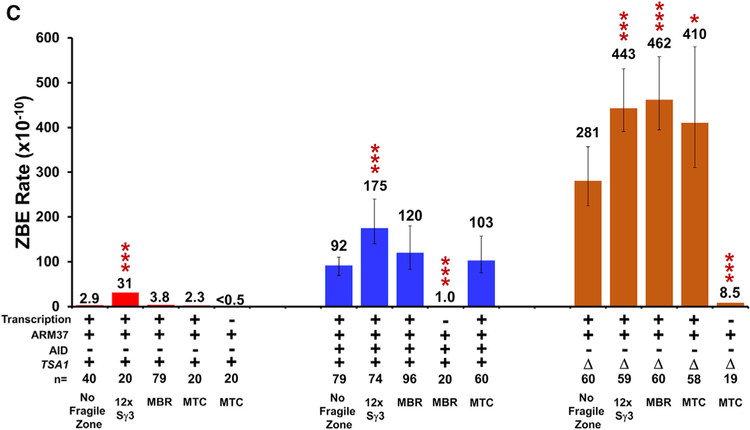
The originally published article contained an error in Figure 4C. The results are correctly described in the text, and the actual numbers are correctly stated in Table S2; however, we have since realized that the plus signs for AID below the right side of Figure 4C (five orange histogram bars) should be minus signs. The other bars in the histogram (blue and red) remain correct and unchanged. The second histogram bar from the right, with a value of 410 (actual data median value of 410.5), was described in the text as 411, but for consistency, this should have read 410:
Figure 4C.
Increased ROS and Expression of Truncated Artemis Synergistically Increases ZBE Rate and Targets Mammalian Fragile Zones
The rates for 12x Sγ3 and MTC are also significantly higher than with no fragile zone at 443 × 10−10 (p = 7 × 10⁻⁵) and 411 × 10−10 (p = 0.023), respectively.
The authors regret this error and any confusion that may have resulted.


