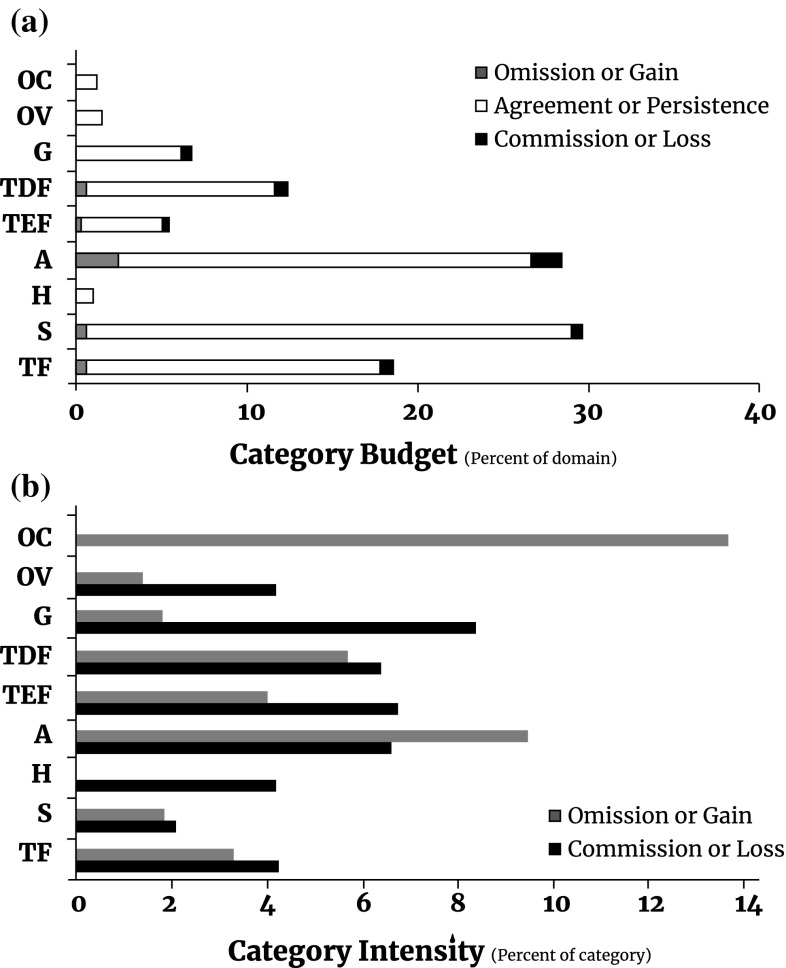
Fig. 3.
Figures of merit show quantity and allocation percentage of correct and error of the LUCC model according to the observed map vs simulated map. a Agreement versus disagreement, b the category intensity refers to the percentage of omission or commission in each category. TF temperate forests, S scrublands, HV hydrophilic vegetation, A agriculture, TEF tropical evergreen forests, TDF tropical dry forests, G grasslands, OV other vegetation, OC other covers

