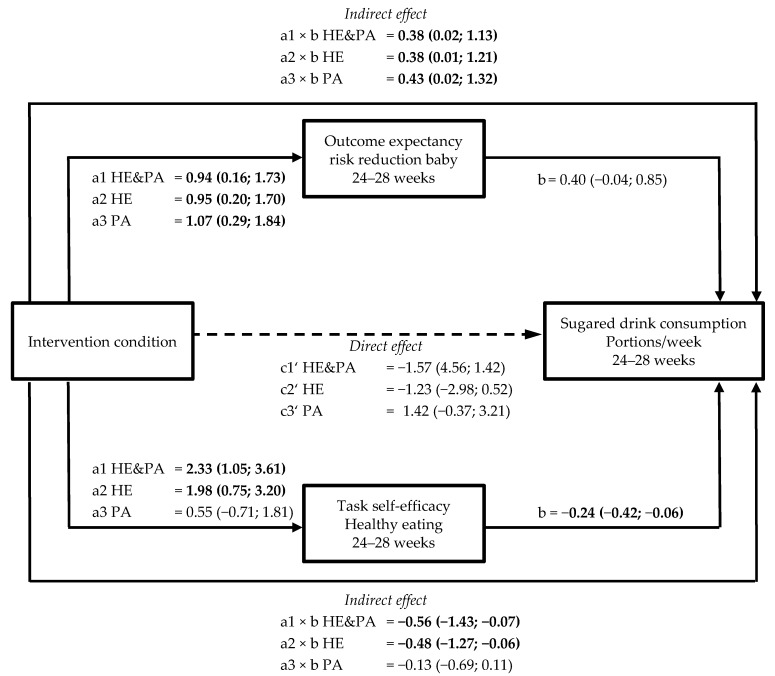
Figure 2.
Schematic diagram of the results of mediation by outcome expectancy and task self-efficacy on sugared drink consumption. Shown are the path coefficients between intervention condition, outcome expectancy of risk reduction for the baby, and task self-efficacy at 24–28 weeks, and sugared drink consumption at 24–28 weeks. Statistically significant path coefficients are shown in bold and with solid lines. Dashed lines indicate non-significant paths. Indirect effects were calculated as the product of the coefficients of the a and b paths (a × b).

