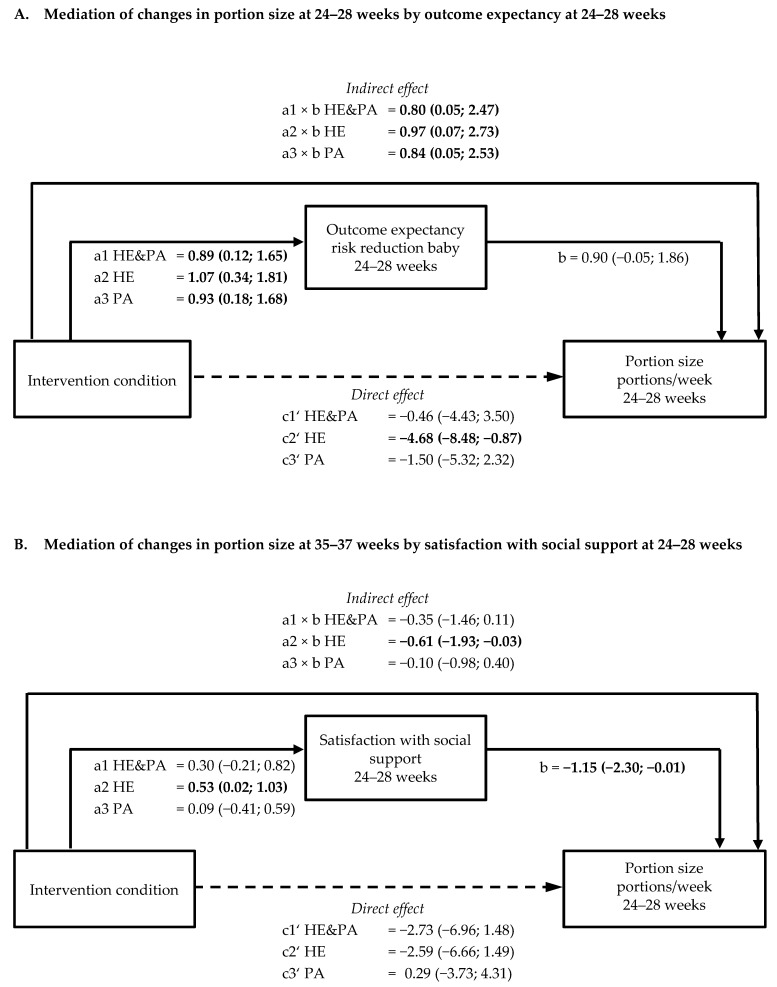
Figure 3.
Schematic diagram of the results of mediation by outcome expectancy or satisfaction with social support on portion size. Shown are the path coefficients between intervention condition, outcome expectancy of risk reduction of the baby at 24–28 weeks, and portion size at 24–28 weeks (A) and between intervention condition, satisfaction with social support, and portion size at 35–37 weeks (B). Statistically significant path coefficients are shown in bold and with solid lines. Dashed lines indicate non-significant paths. Indirect effects were calculated as the product of the coefficients of the a and b paths (a × b).

