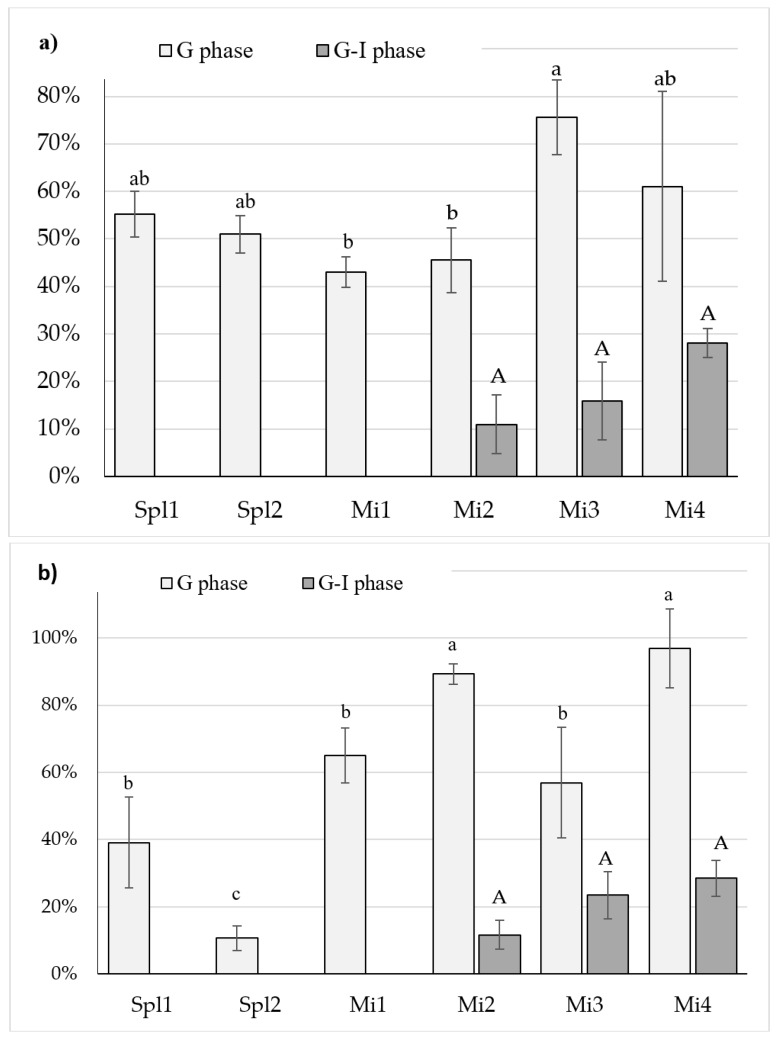
Figure 3.
Percentage content of Fe2+ in the digests of: (a) bread; and (b) breakfast sandwich in the presence of preparations (Spl1 and Spl2—dietary supplements; Mi1—Mi4 fortifcants of encapsulated iron) after simulated gastric and gastrointestinal digestion. The content was expressed as the percentage of Fe2+ relative to total ionic iron content (Fe2+ + Fe3+). Results are presented as the means ± SD; n = 3. Values with the same letter are not significantly different p < 0.05. a, b, c—Letters represent differences between digestates; capital (A): G-I- phase, lowercase (a, b, c): GI- phase

