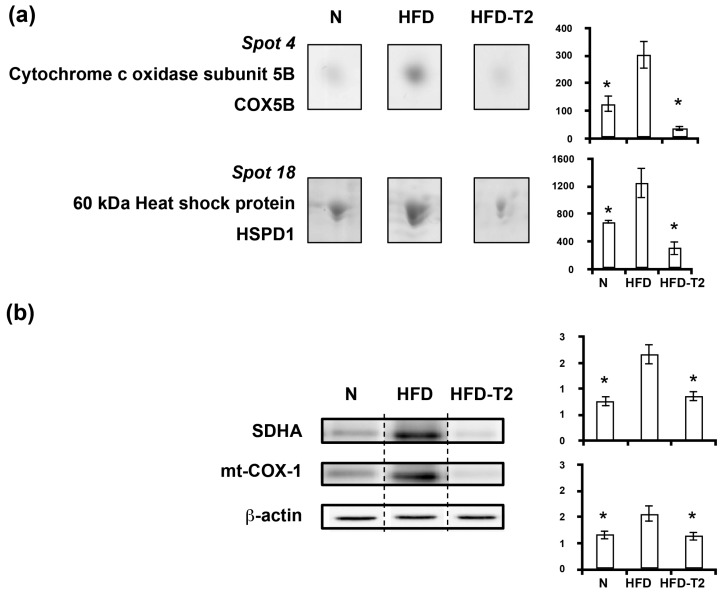
Figure 7.
Four-week 3,5-T2 treatment-associated differential representation within the VAT proteome with regard to mitochondrial proteins. (a) Representative subsections of 2D-E images of VAT of N, HFD, HFD-T2 rats. Results are expressed as arbitrary units (means ± SEM; n = 4) (p < 0.05). Spot numbering refers to Figure 5a. (b) Representative immunoblot analysis of succinate dehydrogenase complex subunit A (SDHA) and mitochondrially-encoded cytochrome c oxidase I (mt-COX-1) protein levels in N, HFD, and HFD-T2 rats. Protein levels were normalized to β-actin. Protein load was 30 μg/lane. The vertical dotted lines indicate cuts in the membrane. Data were normalized to the value obtained for N animals (set as 1). Shown are the mean values ± SEM (n = 4). * p < 0.05 vs. HFD.

