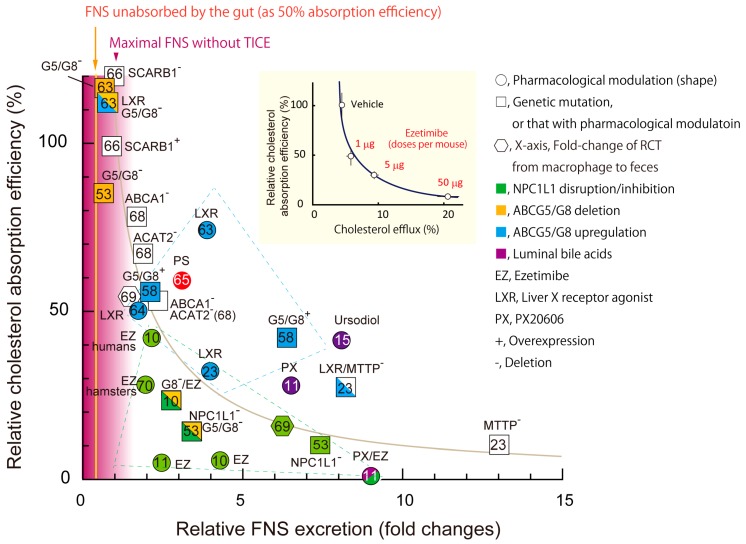
Figure 3.
The relationship between intestinal cholesterol absorption and fecal neutral sterol (FNS) excretion. Inset, the figure was originally published in Nakano, T., et al. PLoS ONE 2016; 11(3): e0152207 [54]. The original titles for the X- and Y-axis were “% of DPM appearing in the lumen/DPM in intestinal segment (Efflux efficiency)” and “Relative lumen-to-circulation 3H-cholesterol transit (% vs. vehicle)”, respectively. The titles were changed to simplify the figure. An inverse relationship between absorption and TICE was hypothesized in the paper. The numbers (micrograms) in the figure indicate the dosages of ezetimibe given to mice. All 28 data sets presented in the figure were obtained from 13 published papers. Cholesterol absorption efficiency (%) indicates relative ratios compared with the respective control groups, for example, wild-types for transgenic mice and vehicle administration for pharmacological treatments. Circles, chemical treatments; squares, transgenic mice or those with chemical treatments; hexagonal shapes, macrophage-to-feces reverse cholesterol transport. EZ, ezetimibe, LXR, liver X receptor agonist; PX, a farnesoid X receptor agonist PX20606. +, mice with overexpression of the indicated gene(s); −, mice with deletion of the indicated gene(s). Green, NPC1L1 was disrupted by genetic deletion or by EZ treatment; yellow, genes for ABCG8 (G8) or both ABCG5 and G8 (G5/G8) were deleted; blue, ABCG5/G8 expression levels were activated by a LXR agonist or genetic modification(s). ACAT2, acyl-CoA acyltransferase 2; ABCA1, ATP-binding cassette A1; MTTP, microsomal triglyceride transfer protein; SCARB1, scavenger-receptor B1. Mice were used as the model unless mentioned otherwise in the plots. Letters in the symbols indicate the references the data were obtained from. The areas shown as blue and green dotted lines indicate experiments with LXR agonists or ABCG5/G8 overexpression, and those with EZ or NPC1L1 deletion, respectively. Yellow vertical line indicates basal FNS excretion originating from unabsorbed cholesterol as 50% absorption efficiency. Purple gradation indicates the approximate maximal FNS excretion originated from unabsorbed cholesterol [52,65,66,67,68,69,70].

