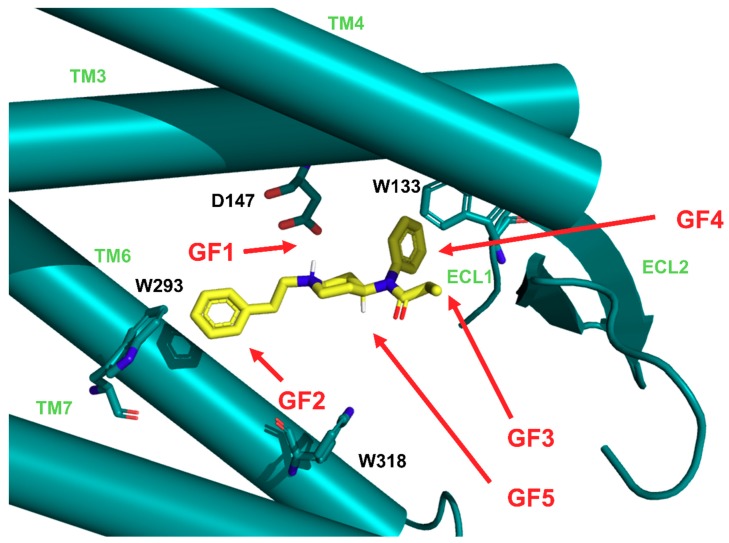
Figure 2.
Fentanyl (in yellow) in the binding pocket of μ-opioid receptor (μOR, in light ‘Tiffany’ blue). The receptor is presented in a simplified and schematic manner with only several residues shown (labelled with black) and transmembrane helices (TM, labelled with light green) depicted as cylinders. Marked are the general features (GF, red arrows) of the binding mode common to the studied derivatives (see text for explanations).

