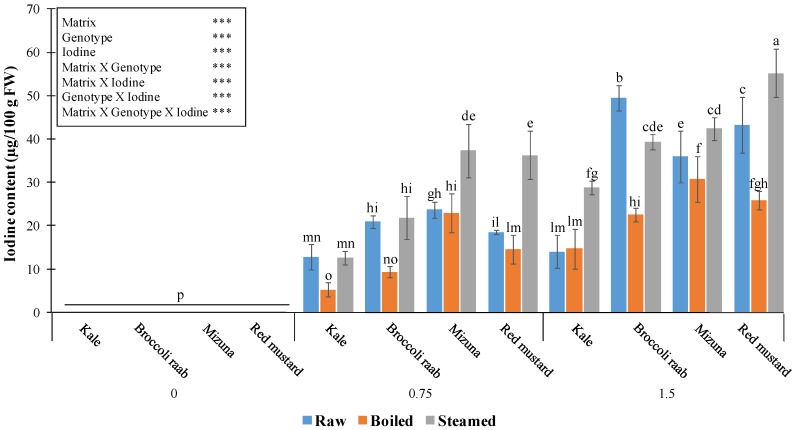
Figure 6.
Iodine content in raw and cooked samples of four Brassica genotypes grown with three I levels (mg/L) in the nutrient solution. For I level 0 mg/L, values are lower than the quantification limit. Different letters indicate significant differences at α = 0.05 by LSD test. In the box in the upper side of the figure, the statistical results (***: significant at p ≤ 0.001) corresponding to the main factors and interactions are reported. Matrix stands for type of material (raw, boiled, and steamed).

