

Abstract
The purpose of this study was to determine the effect of the degenerative medial meniscus and traumatic lesions on the biomechanical behavior of the knee. An elaborate three-dimensional (3D) finite element model of the total knee joint containing bones, articular cartilages, main ligaments, and menisci was developed from a combination of magnetic resonance images and computed tomography. Three types of meniscus tears were employed to represent the degenerative and traumatic lesions. The stress and meniscus extrusion of healthy and injured knees were investigated under the posture of static stance. The traumatic longitudinal tear demonstrated the highest stress and the largest meniscus extrusion displacement. The degenerative horizontal and peripheral tears also showed an irregular biomechanical balance in the knee joint. Despite the damaged hemijoint, the stress on the healthy lateral hemijoint was increased. Although the biomechanics was deteriorated in all meniscus tear models, the variation degree was diverse. The transfixion damage could potentially cause future injury in the knee joint and accelerate the progress of osteoarthritis. Moreover, the meniscus injury may cause high-stress concentration on the contralateral side of the joint. The current results revealed the cause of different clinical manifestation after meniscus tears and the risk of knee osteoarthritis through biomechanical aspects.
Keywords: Meniscus tear, finite element simulation, biomechanics, osteoarthritis, knee joint
Introduction
The menisci are two semi-circular structures consisting of fibrocartilage and act as load sharers and shock absorbers in the knee joint [1]. The wedge shape of these menisci can fill up the space between the convex femur and the flat tibia to increase the contact areas, decrease the axial stresses, and protect the articular cartilage [2]. The tensile strength of the meniscal matrix can resist the extrusion of the meniscus under loading, and the stress can be widely distributed over the surface of the cartilage [3,4]. The lateral meniscus is more mobile than the medial meniscus and bears approximately 70% of the load in the lateral compartment under normal conditions. On the other hand, the medial meniscus has been estimated to carry 50% of the medial load and play a vital role in restraining the anterior drawer of the medial femoral condyle [4,5]. Meniscal tears are common and generally accompanied by the disruption of the hoop fibers, resulting in meniscus extrusion, dislodging, and inter-articular narrowing under the axial load [6]. The recent clinical study proved that the meniscal extrusion promotes the onset of early osteoarthritis (OA) by inducing the cartilage damage and loss, especially the medial meniscus [7].
Meniscal degenerative lesions, especially the horizontal cleavage, are associated with aging and OA [8,9]. The horizontal cleavage tears ordinarily extend from the inner free margin of the meniscus to the exterior margin and divide the meniscus into the upper and lower layers [10]. The healing rates of this tear are poor due to the differential shear stresses between the superior and inferior laminae and the absence of vasculature [11]. The traumatic lesions of the meniscus usually occur due to the excessive forces between the femoral condyle and the tibial plateau. These tears often split the meniscus vertically (like peripheral tear and longitudinal tear) and parallel to the circumferentially oriented collagen fibers [12]. The peripheral tears are usually located in the peripheral vascularized portion, and the lesions do not split the menisci completely. The repair by suturing in this region leads to satisfactory clinical improvement in 70-90% of the patients [13,14]. The longitudinal vertical tears are parallel to the peripheral rim of the meniscus and are often localized in the vascularized portion; also, the menisci are totally split by the lesions. The clinical experience of suture-based repair with this type of tear demonstrates a high frequency of healing and satisfactory functional results [1,15]. Although the causes for these tears are different, the prognosis and outcomes are similar. The abnormal stress distribution in the knee joint induced by meniscus tears leads to damage in the cartilage and subchondral bone that is correlated to the occurrence and development of OA.
Consequently, an in-depth understanding of the stress in the intra-articular region during meniscus tears may help to explore the biomechanical etiology of OA progression. The finite element (FE) simulation can provide intuitive results to explain the biomechanical changes of the knee OA induced by meniscal tears. Several investigators have constructed two-dimensional (2D) or three-dimensional (3D) computational models of the knee joint to analyze the effect of meniscus tears on the biomechanical behavior of the knee [16-19]. Although a majority of the studies demonstrated that stress was exerted on connective tissues, the bones were presumed to be rigid because the equivalent strength of the bones was much higher than that of menisci, ligaments, and cartilages, and ignored the deformation of the bone; also, the application of stress did not alter the bone. However, the stress applied to the femur and tibia cannot be ignored. The stress concentration and microfracture of the subchondral bone are correlated with the cartilage damage and the development of knee OA [20,21]. Thus, the neglected stress on the bone structure might lead to imprecise FE simulation, and the progress of OA cannot be explained systematically.
To investigate the biomechanics effect caused by degenerative meniscus and traumatic lesions, a 3D FE model of the knee joint was established based on the combination of magnetic resonance imaging (MRI) and computed tomography (CT) images. Herein, we introduced three types of medial meniscus tears (horizontal cleavage, peripheral tear, and longitudinal tear) to represent the two kinds of lesions. Vertical and anterior forces were applied to the model to simulate the stance and slight flexion posture. Finally, the compression stress and shear stress on the bone and cartilage were estimated to evaluate the effect of meniscus tears on the biomechanics of the knee joint and OA progression.
Methods
All methods in this study were carried out in accordance with relevant guidelines and regulations. All experimental protocols in this study were approved by the Ethics Committee of Drum Tower Hospital Affiliated to the Medical School of Nanjing University.
Data acquisition
The MR data were obtained from a 35-year-old male by a 3-T clinical MR scanner (uMR 770, United Imaging, Shanghai, China) using the 12-channel knee send-receive radio frequency coil. The patient was placed in a supine position, and the knee to be examined was positioned in the central region of the coil. A modulated flip angle technique in refocused imaging with extended echo train sequence was performed in each subject based on the following parameters: 2 excitations and 176 contiguous slices and a slice thickness of 1.5 mm, repetition time 1000 ms, echo time 56 ms, matrix 240 × 228, field of view (FOV) 152 mm, and voxel size 0.67 × 0.63 × 0.64 mm3 in sagittal planes with the scan time 6 min 44 s. A CT scan was performed using a GE Lightspeed 16 CT equipment (GE, CT, USA) on the same participant on the lower limb at the neutral posture with a slice distance of 0.625 mm and a FOV of 500 mm.
3D reconstruction and combination of the knee joint
The 3D models of the bone structure and soft tissues were reconstructed using MIMICS 19.0 (Materialise, Leuven, Belgium). The DICOM image files were imported into the software and segmented according to the gray intensities. Furthermore, independent 3D reconstruction for each bone was accomplished using CT bone segmentation operation. The contours of articular cartilages (femoral, tibial, and patellar), menisci (medial and lateral), ligaments (medial collateral (MCL), lateral collateral (LCL), anterior cruciate (ACL), posterior cruciate (PCL), and patellar tendon were segmented from MR images. To minimize the variation in the models, the manual segmentation of the bony and non-bony structures of the knee was performed under the supervision of an experienced orthopedist and radiologist with an accuracy of 0.1 mm. The assembly view was demonstrated in Figure 1A-C. Three types of medial meniscus tears (horizontal, peripheral, and longitudinal) were constructed by Magics 19.0 (Materialise) as shown in Figure 1D.
Figure 1.
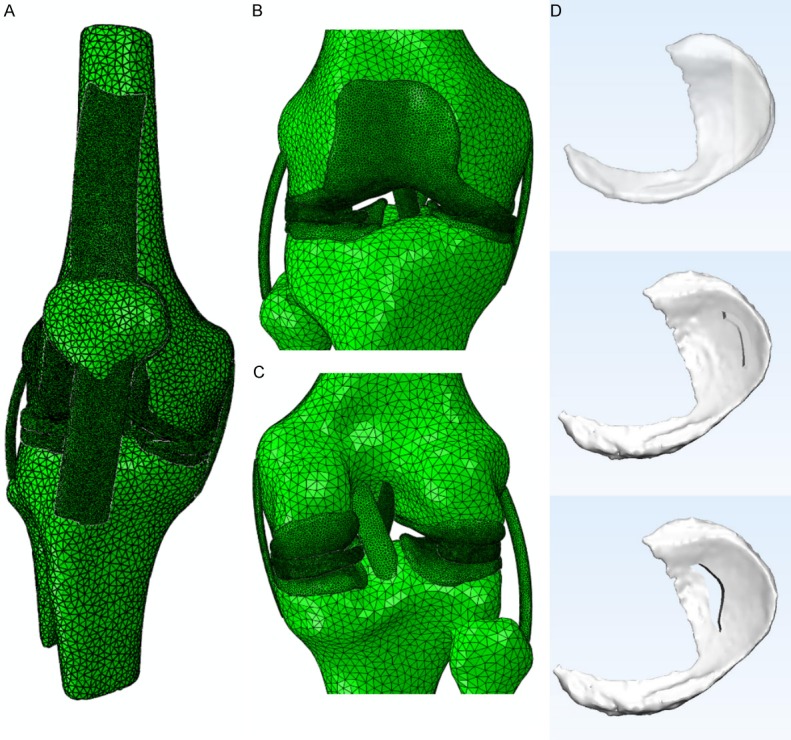
The view of 3D models used in the FE simulation. The general view of knee joint model showed in Abaqus 2017 (A), the frontal partial enlargement view of the knee joint showed in Abaqus 2017 (B), and the rear partial enlargement view of the knee joint showed in Abaqus 2017 (C). The 3D meniscus tear models made by Magics 19.0 and showed in 3-matic 11.0 (D), from top to bottom was a horizontal tear, peripheral tear, and longitudinal tear, respectively.
FE modeling and material properties
All the data were exported as stereolithography (STL) files, and the surface Remesh was operated by Materialise 3-matic 11.0 software. The established models were imported and assembled in the Abaqus 2017 (Similia, Rhode Island, USA). As the ligaments are nonlinear materials, the quadratic hybrid formulation was employed, and the type of unit was a 10-node quadratic tetrahedron (C3D10H); while, for the other linear materials, the type of unit was a 4-node linear tetrahedron (C3D4).
The ligaments were modeled as transversely isotropic nearly-incompressible neo-Hookean materials [17,18,22] with strain energy function as follows (Equation 1):
 |
Here, S(λ) denotes the strain energy function of the fiber family, which satisfies the conditions (Equation 2):
 |
C10 is a bulk material constant related to the shear modulus μ (C10 = 2/μ), JF is the Jacobian determinant of the deformation gradient F, and Mark 1 represents the first invariant of the left Cauchy-Green tensor Mark 2 with the modified deformation gradient Mark 3.
 |
 |
 |
The stress in the fibers was dependent on the fiber stretch λ that is determined from the deformed fiber orientation ad, the deformation gradient F, and the initial fiber orientation a0 (λ · ad = F · a0). The fibers did not support any compressive stresses if they were under compression λ ≤ 1. The stiffness of the fibers increased exponentially when the fibers stretched between 1 and λ* (pre-defined value). Beyond this stretch, the fibers were straightened and the stiffness increased linearly. The constant C3 depicted the exponential stress, C4 was related to the rate of collagen uncramping, C5 represented the elastic modulus of the straightened collagen fibers, and C6 was introduced to ensure the stress continuation at λ*[C 6 = (e C4(λ*-1)-1)·C 3-(C 5 λ*)]. The material constants C10, C3, C4, C5, and D1, are listed in Table 1.
Table 1.
Material constants for the ligaments
| C10 (MPa) | C3 (MPa) | C4 (-) | C5 (MPa) | D1 (MPa-1) | λ* (-) | |
|---|---|---|---|---|---|---|
| ACL | 1.95 | 0.0139 | 116.22 | 535.039 | 0.00683 | 1.046 |
| PCL | 3.25 | 0.1196 | 87.178 | 431.063 | 0.0041 | 1.035 |
| LCL | 1.44 | 0.57 | 48.0 | 467.1 | 0.00126 | 1.063 |
| MCL | 1.44 | 0.57 | 48.0 | 467.1 | 0.00126 | 1.063 |
| PT | 3.25 | 0.1196 | 87.178 | 431.063 | 0.0041 | 1.035 |
ACL: anterior cruciate ligament; PCL: posterior cruciate ligament; LCL: lateral collateral ligament; MCL: medial collateral ligament; PT: patellar tendon.
The bone material was linear with an elastic modulus (E) of 7300 MPa and a Poisson’s ratio (ν) of 0.3 [23]. The articular cartilage and menisci were presumably composed of a single-phase linear elastic and isotropic material with the following average properties: E = 15 MPa, ν = 0.475 and E = 120 MPa, ν = 0.45, respectively [24-27].
Loads and boundary conditions
In the present study, we included the total tibiofemoral joint for the knee joint characterization, and two FE simulations explored the effect of different meniscus tears on the biomechanics of the knee. The boundary conditions were defined as follows: the tibia and fibula were fixed in all translations and rotations, and the femur was unconstrained in all translational and rotational degrees of freedom. All the ligaments were rigidly attached to the corresponding bones to simulate the bone-ligament attachment. The kinematic constraint was modeled between the femur and meniscus, the meniscus and tibia, and the femur and tibia for both the lateral and medial hemijoints. In the case of static stance simulation, a vertical compressive load of 1150 N (two body weights) was applied on the femur at 0° flexion. For the slight flexion simulation, a vertical compressive load of 1150 N and an anterior load of 350 N (60% of the body weight) was applied on the top and anterior side of the femur at 0° flexion to acquire a 4° flexion of the knee joint.
Results
Static stance simulation
The compression stress applied on the medial hemijoints was increased after meniscus tears (Figure 2A). The compression stress has doubled in the femur tear model (increased from 5.5 to 13 MPa). The shear stress on the femur, meniscus, and tibia demonstrated a distinct growth trend; however, only a slight increment was observed on the femur and tibial cartilages (0.2-0.3 MPa) (Figure 2C). For the lateral hemijoints, the compression stress on the tibia demonstrated an obvious increase (from 3.3 MPa to 7.5 MPa) while that on the other parts was raised only slightly (Figure 2B). Except tibia, the shear stress on the femur was increased about 3-fold, from 4 MPa to 13.31 MPa (Figure 2D). In summary, the horizontal and peripheral tears demonstrated maximal compression stress, and the longitudinal tear showed the highest shear stress in the static stance simulation.
Figure 2.

The maximum compression stress and shear stress applied on the knee joint in the static stance simulation. The maximum compression stress in the medial hemijoint (A), the stress on the femur and tibia increased obviously after meniscus tears. The maximum compression stress in the lateral hemijoint (B), the stress on the tibia increased obviously after meniscus tears. The maximum shear stress in the medial hemijoint (C), the stress on the femur, meniscus, and tibia increased obviously after meniscus tears, and the highest value appeared on the longitudinal tear. The maximum shear stress in the lateral hemijoint (D), the stress on the femur increased after meniscus tears, and the highest value appeared on the longitudinal tear.
The stress nephograms in Figures 3 and 4 exhibited identical results. Figure 3 demonstrated that the main color of the femur changed from bright yellow to orange under the same threshold value. Also, the color was altered around the femur condyle, as well as the distribution area. This phenomenon indicated that the compression stress applied to the whole femur and the femur condyle increased significantly. The same varying tendency can be observed on the meniscus and tibial plateau. The stress distribution area on the femur cartilage and tibial cartilage was almost identical, and the values were 4.021-4.657 MPa and 3.256-3.382 MPa, respectively. However, no significant distinction was observed between the three kinds of tears in the compression stress distribution. Figure 4 displayed the stress concentration on the medial and lateral tibiofemoral joint after meniscus tears. Despite the stress-concentrated region, the color distribution on the other stress regions was slightly diverse, a marked alteration did not appear among different tears.
Figure 3.

The results of the compression stress (Min Principal stress) in the static stance simulation. The color change from deep blue to orange represented the stress variation from large to small on the stress nephogram. The same threshold was applied for the same region. The lateral and medial side were labelled on the top of each column. The color and distribution area around the femur condyle, the meniscus, and tibial platea were changed. The stress distribution area on the femur cartilage and tibial cartilage was almost identical. The femur, femur cartilage, menisci, tibial cartilage, and tibia of the intact knee joint were shown in the first line from left to right (A). The femur, femur cartilage, menisci, tibial cartilage, and tibia of the horizontal tear were shown in the second line from left to right (B). The femur, femur cartilage, menisci, tibial cartilage, and tibia of the peripheral tear were shown in the third line from left to right (C). The femur, femur cartilage, menisci, tibial cartilage, and tibia of and the longitudinal tear were shown in the fourth line from left to right (D).
Figure 4.

The results of the shear stress (Tresca stress) in the static stance simulation. The color changed from red to deep blue that represented the stress variation from large to small on the stress nephogram. The same threshold was applied for the same region. The lateral and medial side were labelled on the top of each column. The stress-concentrated region and the color distribution were slightly diverse among different meniscus tears. The femur, femur cartilage, menisci, tibial cartilage, and tibia of the intact knee joint were shown in the first line from left to right (A). The femur, femur cartilage, menisci, tibial cartilage, and tibia of the horizontal tear were shown in the second line from left to right (B). The femur, femur cartilage, menisci, tibial cartilage, and tibia of the peripheral tear were shown in the third line from left to right (C). The femur, femur cartilage, menisci, tibial cartilage, and tibia of and the longitudinal tear were shown in the fourth line from left to right (D).
The extrusion displacement was shown in Table 2. The medial meniscus displacement was approximately 1.8 mm, and the lateral meniscus displacement was about 2.7 mm. The extrusion was increased, albeit insignificantly, after meniscus tears. The longitudinal tear demonstrated the largest extrusion in both medial and lateral sides, followed by the horizontal tear.
Table 2.
Meniscus extrusion in static stance simulation (mm)
| Healthy | Horizontal | Peripheral | Longitudinal | |
|---|---|---|---|---|
| Medial | 1.801 | 1.815 | 1.791 | 1.891 |
| Lateral | 2.641 | 2.756 | 2.746 | 2.767 |
Slight flexion simulation
Similar to the static stance simulation, the compression stress and shear stress were both increased after meniscus tears. Compared to the horizontal and peripheral tears, the compression stress applied on medial hemijoint was prominently increased in the longitudinal tear (except the tibial cartilage) (Figure 5A).
Figure 5.

The maximum compression stress and shear stress applied on the knee joint in the slight flexion simulation. The maximum compression stress in the medial hemijoint (A), the prominent increase can be observed in longitudinal tear. The maximum compression stress in the lateral hemijoint (B), the notable increase of stress can be found on the tibia in longitudinal tear. The maximum shear stress in the medial hemijoint (C), the stress increased after meniscus tears, and the tibia in longitudinal tear shown the highest value. The maximum shear stress in the lateral hemijoint (D), the value for all kinds of tears was approximate.
Nevertheless, only the medial tibia and meniscus demonstrated a significant growth of shear stress in the longitudinal tear, and no difference was detected on the cartilage between the four groups (Figure 5C). In the case of lateral hemijoint, the notable increase in the compression stress could be observed only on the tibia in the longitudinal tear (Figure 5B). Furthermore, the numerical value of shear stress for all kinds of tears on lateral hemijoint was approximate (Figure 5D). Contrary to the medial joint, a slight rise in the compression stress and shear stress was exhibited on the lateral tibial cartilage of all kinds of tears, indicating that the medial meniscus longitudinal tear led to a high compression stress and shear stress in the medial joint.
The stress nephogram of Min Principal in Figure 6 demonstrated that the compression stress concentration altered on both medial and lateral sides of the femur condyle, femur cartilage, and tibia. The stress distribution area and numerical value were maximal in the longitudinal tear. In the case of the meniscus and tibial cartilage, the stress distribution region was not changed; however, the value was increased, and the highest value appeared in the longitudinal tear. This tendency of shear stress was observed in Figure 7. A prominent stress concentration was observed on both sides of the femur and tibia after meniscus tears, and the red area was largest in the medial femur and tibia of the longitudinal tear. In addition, the stress was markedly distributed in the medial femur cartilage in both horizontal and peripheral tears; however, a large field was encompassed in the longitudinal tear, especially in the posterior horn. Moreover, the stress concentration was also observed at the posterior horn on the tibia cartilage in the longitudinal tear.
Figure 6.

The results of the compression stress (Min Principal stress) in the slight flexion simulation. The color change from deep blue to orange represented the stress variation from large to small on the stress nephogram. The same threshold was applied for the same region. The lateral and medial side were labelled on the top of each column. The compression stress concentration altered on both medial and lateral sides of the femur condyle, femur cartilage, and tibia. The stress distribution area and numerical value were highest in the longitudinal tear. The femur, femur cartilage, menisci, tibial cartilage, and tibia of the intact knee joint were shown in the first line from left to right (A). The femur, femur cartilage, menisci, tibial cartilage, and tibia of the horizontal tear were shown in the second line from left to right (B). The femur, femur cartilage, menisci, tibial cartilage, and tibia of the peripheral tear were shown in the third line from left to right (C). The femur, femur cartilage, menisci, tibial cartilage, and tibia of and the longitudinal tear were shown in the fourth line from left to right (D).
Figure 7.

The results of the shear stress (Tresca stress) in the slight flexion simulation. The color change from red to deep blue indicated the stress variation from large to small on the stress nephogram. The same threshold was applied for the same region. The lateral and medial side were labelled on the top of each column. A prominent stress concentration was found on both sides of the femur and tibia after meniscus tears, and the red area was the biggest in the medial femur and tibia of longitudinal tear. The femur, femur cartilage, menisci, tibial cartilage, and tibia of the intact knee joint were shown in the first line from left to right (A). The femur, femur cartilage, menisci, tibial cartilage, and tibia of the horizontal tear were shown in the second line from left to right (B). The femur, femur cartilage, menisci, tibial cartilage, and tibia of the peripheral tear were shown in the third line from left to right (C). The femur, femur cartilage, menisci, tibial cartilage, and tibia of and the longitudinal tear were shown in the fourth line from left to right (D).
The extrusion displacement was shown in Table 3. Similar to the static standing simulation, all the displacements were increased after the meniscus. However, the difference between the medial and lateral sides became small, and the increment in the displacement in longitudinal tear was prominent, followed by that in the horizontal tear.
Table 3.
Meniscus extrusion in slight flexion simulation (mm)
| Healthy | Horizontal | Peripheral | Longitudinal | |
|---|---|---|---|---|
| Medial | 3.157 | 3.221 | 3.190 | 3.449 |
| Lateral | 3.326 | 3.386 | 3.373 | 3.440 |
Discussion
Herein, we developed a realistic FE model of the total knee joint to evaluate the biomechanics in the degenerative meniscus and traumatic lesions of the knee. The results of compression stress and shear stress obtained from the healthy knee in the static stance simulation were in agreement with the studies described previously [17,18,22,28], which proved that the model used in this study yielded reasonable analytical results. Although the two simulations exhibited the instantaneous responses of healthy and post-injury knees in a time-independent manner, and with a simple compressive load, the changing tendency indicated the effect of biomechanics altering the progress of knee OA. Due to the difference in the load bearing between the medial and lateral meniscus under static standing, the extrusion displacement in the lateral meniscus was larger than that in the medial meniscus. The difference in the value among the four groups was < 0.1 mm, indicating that the meniscus tears affected the biomechanics mildly when the patients remained standing and showed a decrease in the activity. However, the effect of meniscus tears on stress transmission was remarkable in slight flexion simulation. The extrusion of the meniscus with longitudinal tear was notable among all the groups. Furthermore, compared to the static standing simulation, the activity of the knee causes severe intra-articular damage after meniscus tears. In addition, the medial extrusion displacement was larger than the lateral side after meniscus, which indicated the presence of joint space narrowing (JSN) and changes in the biomechanical state in the affected compartment. Interestingly, the osteophytes and JSN are the primary bony features observed during the progression of knee OA [29]. Figure 8A and 8B illustrated that the JSN and osteophytes occurred in the medial hemijoint; this phenomenon was in agreement with the results of FE simulation. The degenerative and traumatic lesions in the FE simulation can result in JSN and altered stress distribution in the injured knee. This diversification was related to the severity of the meniscus tears. In this study, the horizontal had split half of the meniscus body, and the longitudinal tear had completely transfixed the meniscus. On the other hand, the peripheral tear only injured the surface of the meniscus body. The horizontal tear of the longitudinal tear damaged the inherent structure of the meniscus and disrupted the hoop fibers, leading to the decline of the hoop strength [30]. The morphology of the meniscus cannot be restrained under the pressure, and the joint space becomes narrow.
Figure 8.

The imaging examination of knee OA. The X-ray (A) and 3D reconstruction (B) results of a 55-year old male patient showed that the medial compartment of the knee is markedly narrowed. The MRI (C) result of a 63-year old female patient revealed the subchondral bone osteonecrosis, and cystic degeneration can be observed in the femur and tibia.
Except the altering of the joint space, the meniscus tears also introduce a notable increase in the stress on the knee joint, especially in the subchondral bone of the femur and tibia, which was neglected in the previous studies. Under a load of static standing, the effect of degenerative and traumatic lesions was similar. The stress concentration region appeared at the anterior horn of the joint. After applying the anterior load, the stress concentration region emerged on the posterior horn, and the numerical value was increased in the meniscus tears models. This phenomenon might be attributed to the decrease in the contact area between the meniscus and cartilages due to the decrease in the meniscus area, and the decline in the equivalent strength of the damaged meniscus [31]. The meniscal dysfunction increased the peak and average stresses in the injured compartment, which might further facilitate the OA process [32]. According to the current results of FE simulation, the highest compression stress and shear stress applied on the femur and tibia can reach 14-20 MPa, which might introduce microdamage and microfracture in the subchondral bone. The stress applied on the femur was larger than that on the tibial plateau. Additionally, the longitudinal tear presented maximal shear stress and distribution area in the knee in the posture of standing and flexion. Typically, the shear stress represents the relative movement inside the objects, which is correlated with the destruction of the internal structure. The high shear stress may lead to the early proteolytic degradation of the meniscal matrix and the articular cartilage and the decreased tensile strength [33,34]. This parameter can directly demonstrate the risk region that may be damaged under abnormal biomechanics. Furthermore, the routine T1-weighted MRI result in Figure 8C showed that the subchondral bone osteonecrosis and cystic degeneration are closely related to progressing OA [35,36] that arose in the femur and tibial plateau, which was consistent with the FE simulation results. Thus, we can conclude that the traumatic longitudinal tear can result in a negative effect on the knee biomechanics and accelerate the pathogenesis of OA. The degenerative horizontal and peripheral tears effectuated irregular biomechanical balance in the knee joint, albeit mildly, based on the clinical manifestation. Nonetheless, most degenerative meniscus lesions are asymptomatic [37,38].
In addition, the stress applied to the healthy lateral hemijoint was increased, as explained by a simplified model. Since the position of the meniscus in the knee joint was similar to the symmetrical distribution and due to the transversely isotropic material properties, we could simplify the mechanical model using the parallel spring system (Figure 9A). In this system, the spring 1 represented the medial meniscus while the spring 2 represented the lateral meniscus. A load of 100 N was applied on the top of the system, and the stiffness of the meniscus was assumed as 8.54 N/mm [39]. The stiffness of the two springs was assumed as k1 and k2, respectively. According to the equivalent stiffness formula of the parallel spring system, the following equation was obtained:
Figure 9.
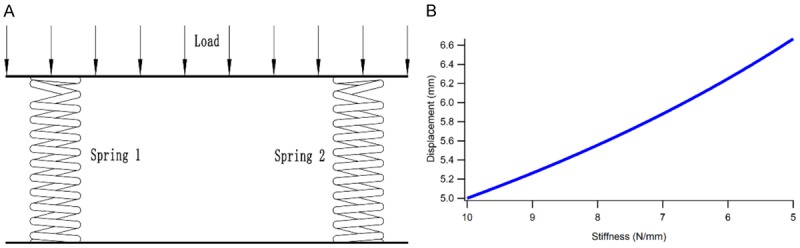
The mechanical model of the meniscus was simplified using the parallel spring system (A), and the correlation curve between stiffness and deformation increased linearly (B).
keq = k 1 + k 2
Supposedly, the medial meniscus was injured, and the stiffness of k1 was decreased, the lateral meniscus function was intact, and the stiffness k2 remained unchanged, the equivalent stiffness keq will be decreased according to the equation mentioned above. Based on the condition of static equilibrium, the deformation (δ) of the meniscus can be obtained as follows:
δ = F/(k 1 + k 2)
When the load F remained stable, the deformation of the two menisci will increase with the decrease in k1 (Figure 9B). Thus, we summarized that the damage of medial meniscus and the decrease in stiffness leads to high deformation and stress on the lateral meniscus, thereby leading to the increased stress application on the cartilages and bone structures.
Conclusion
In the present study, we explored the changes in the biomechanics during degenerative meniscus and traumatic injuries through a realistic total knee FE model. In order to restore the stress transmission process, the bone structures were employed in the FE simulation. The results demonstrated that the shear stress and compression stress in the traumatic longitudinal tear model were remarkable in any posture, indicating that the damage with complete transfixion in the meniscus was likely to cause future injury in the knee joint and accelerate the progress of OA. On the other hand, the stress in degenerative horizontal tear and slight peripheral tear was also increased, albeit not as high as the longitudinal tear. Notably, OA presented with milder symptoms are milder than those for the traumatic longitudinal tears. These results might reveal the biomechanical aspects of various knee joint symptoms caused by different kinds of meniscus tears.
Acknowledgements
This study was supported by the International Cooperation and Exchange of National Natural Science Foundation (NSFC 81420108021), Key Program of NSFC (81730067), NSFC (51575100, 51705259), Jiangsu Provincial Key Medical Center Foundation, and Jiangsu Provincial Medical Outstanding Talent Foundation.
Disclosure of conflict of interest
None.
References
- 1.Messner K, Gao J. The menisci of the knee joint. Anatomical and functional characteristics, and a rationale for clinical treatment. J Anat. 1998;193:161–78. doi: 10.1046/j.1469-7580.1998.19320161.x. [DOI] [PMC free article] [PubMed] [Google Scholar]
- 2.Mcdermott ID, Amis AA. The consequences of meniscectomy. J Bone Joint Surg Br. 2006;88:1549–56. doi: 10.1302/0301-620X.88B12.18140. [DOI] [PubMed] [Google Scholar]
- 3.Englund M, Guermazi A, Lohmander LS. The meniscus in knee osteoarthritis. Rheumatic Diseases Clinics of North America. 2009;35:579. doi: 10.1016/j.rdc.2009.08.004. [DOI] [PubMed] [Google Scholar]
- 4.Mcdermott I. Meniscal tears, repairs and replacement: their relevance to osteoarthritis of the knee. Br J Sports Med. 2011;45:292–7. doi: 10.1136/bjsm.2010.081257. [DOI] [PubMed] [Google Scholar]
- 5.Verdonk R, Madry H, Shabshin N, Dirisamer F, Peretti GM, Pujol N, Spalding T, Verdonk P, Seil R, Condello V. The role of meniscal tissue in joint protection in early osteoarthritis. Knee Surg Sports Traumatol Arthrosc. 2016;24:1763–74. doi: 10.1007/s00167-016-4069-2. [DOI] [PubMed] [Google Scholar]
- 6.Adams JG, Mcalindon T, Dimasi M, Carey J, Eustace S. Contribution of meniscal extrusion and cartilage loss to joint space narrowing in osteoarthritis. Clin Radiol. 1999;54:502–6. doi: 10.1016/s0009-9260(99)90846-2. [DOI] [PubMed] [Google Scholar]
- 7.Bloecker K, Wirth W, Guermazi A, Hunter DJ, Resch H, Hochreiter J, Eckstein F. Medial meniscal extrusion relates to cartilage loss in specific femorotibial subregions- data from the osteoarthritis initiative. Arthritis Care & Research. 2015;67:1545. doi: 10.1002/acr.22615. [DOI] [PMC free article] [PubMed] [Google Scholar]
- 8.Poehling GG, Ruch DS, Chabon SJ. The landscape of meniscal injuries. Clin Sports Med. 1990;9:539–549. [PubMed] [Google Scholar]
- 9.Lecouvet F, Van HT, Acid S, Perlepe V, Kirchgesner T, Vande BB, Triqueneaux P, Denis ML, Thienpont E, Malghem J. Magnetic resonance imaging (MRI) of the knee: Identification of difficult-to-diagnose meniscal lesions. Diagn Interv Imaging. 2018;99:55–64. doi: 10.1016/j.diii.2017.12.005. [DOI] [PubMed] [Google Scholar]
- 10.Verdonk P, Vererfve P. Traumatic lesions: stable knee, ACL Knee. 2010 [Google Scholar]
- 11.Stärke C, Kopf S, Petersen W, Becker R. Meniscal repair. Arthroscopy. 2009;25:1033–44. doi: 10.1016/j.arthro.2008.12.010. [DOI] [PubMed] [Google Scholar]
- 12.Englund M. The role of the meniscus in osteoarthritis genesis. Med Clin North Am. 2009;93:37–43. doi: 10.1016/j.mcna.2008.08.005. [DOI] [PubMed] [Google Scholar]
- 13.Nepple JJ, Dunn WR, Wright RW. Meniscal repair outcomes at greater than five years: a systematic literature review and meta-analysis. J Bone Joint Surg Am. 2012;94:2222–7. doi: 10.2106/JBJS.K.01584. [DOI] [PMC free article] [PubMed] [Google Scholar]
- 14.Ghazi ZL, Chevrier A, Farr J, Rodeo SA, Buschmann MD. Augmentation techniques for meniscus repair. J Knee Surg. 2018;31:99–116. doi: 10.1055/s-0037-1602247. [DOI] [PubMed] [Google Scholar]
- 15.Jouve F, Ovadia H, Pujol N, Beaufils P. Meniscal repair: technique. Meniscus. 2010;15:119–128. [Google Scholar]
- 16.Venäläinen MS, Mononen ME, Jurvelin JS, Töyräs J, Virén T, Korhonen RK. Importance of material properties and porosity of bone on mechanical response of articular cartilage in human knee joint--a two-dimensional finite element study. J Biomech Eng. 2014;136:121005–121005. doi: 10.1115/1.4028801. [DOI] [PubMed] [Google Scholar]
- 17.Peña E, Calvo B, Martínez MA, Doblaré M. A three-dimensional finite element analysis of the combined behavior of ligaments and menisci in the healthy human knee joint. J Biomech. 2006;39:1686–701. doi: 10.1016/j.jbiomech.2005.04.030. [DOI] [PubMed] [Google Scholar]
- 18.Peña E, Calvo B, Martínez MA, Palanca D, Doblaré M. Finite element analysis of the effect of meniscal tears and meniscectomies on human knee biomechanics. Clin Biomech (Bristol, Avon) 2005;20:498–507. doi: 10.1016/j.clinbiomech.2005.01.009. [DOI] [PubMed] [Google Scholar]
- 19.Dong Y, Hu G, Dong Y, Hu Y, Xu Q. The effect of meniscal tears and resultant partial meniscectomies on the knee contact stresses: a finite element analysis. Comput Methods Biomech Biomed Engin. 2014;17:1452–63. doi: 10.1080/10255842.2012.753063. [DOI] [PubMed] [Google Scholar]
- 20.Buckland J. Osteoarthritis: subchondral bone erosion in hand OA: insights into the role of inflammation. Nat Rev Rheumatol. 2012;8:501. doi: 10.1038/nrrheum.2012.137. [DOI] [PubMed] [Google Scholar]
- 21.Li G, Yin J, Gao J, Cheng TS, Pavlos NJ, Zhang C, Zheng MH. Subchondral bone in osteoarthritis: insight into risk factors and microstructural changes. Arthritis Res Ther. 2013;15:223. doi: 10.1186/ar4405. [DOI] [PMC free article] [PubMed] [Google Scholar]
- 22.Shriram D, Praveen KG, Cui F, Yhd L, Subburaj K. Evaluating the effects of material properties of artificial meniscal implant in the human knee joint using finite element analysis. Sci Rep. 2017;7:6011. doi: 10.1038/s41598-017-06271-3. [DOI] [PMC free article] [PubMed] [Google Scholar]
- 23.Li L, Yang L, Yu F, Shi J, Zhu L, Yang X, Teng H, Wang X, Jiang Q. 3D printing individualized heel cup for improving the self-reported pain of plantar fasciitis. J Transl Med. 2018;16:167. doi: 10.1186/s12967-018-1547-y. [DOI] [PMC free article] [PubMed] [Google Scholar]
- 24.Shepherd DE, Seedhom BB. The ‘instantaneous’ compressive modulus of human articular cartilage in joints of the lower limb. Rheumatology. 1999;38:124–132. doi: 10.1093/rheumatology/38.2.124. [DOI] [PubMed] [Google Scholar]
- 25.Haut Donahue TL, Hull ML, Rashid MM, Jacobs CR. How the stiffness of meniscal attachments and meniscal material properties affect tibio-femoral contact pressure computed using a validated finite element model of the human knee joint. J Biomech. 2003;36:19–34. doi: 10.1016/s0021-9290(02)00305-6. [DOI] [PubMed] [Google Scholar]
- 26.Dhaher YY, Kwon TH, Barry M. The effect of connective tissue material uncertainties on knee joint mechanics under isolated loading conditions. J Biomech. 2010;43:3118–25. doi: 10.1016/j.jbiomech.2010.08.005. [DOI] [PMC free article] [PubMed] [Google Scholar]
- 27.Hauch KN, Villegas DF, Haut Donahue TL. Geometry, time-dependent and failure properties of human meniscal attachments. J Biomech. 2010;43:463–8. doi: 10.1016/j.jbiomech.2009.09.043. [DOI] [PMC free article] [PubMed] [Google Scholar]
- 28.Luczkiewicz P, Daszkiewicz K, Witkowski W, Chróścielewski J, Ferenc T, Baczkowski B. The influence of a change in the meniscus cross-sectional shape on the medio-lateral translation of the knee joint and meniscal extrusion. PLoS One. 2018;13:e0193020. doi: 10.1371/journal.pone.0193020. [DOI] [PMC free article] [PubMed] [Google Scholar]
- 29.Hellio Le Graverand MP, Mazzuca S, Duryea J, Brett A. Radiographic-based grading methods and radiographic measurement of joint space width in osteoarthritis. Radiol Clin North Am. 2009;47:567–79. doi: 10.1016/j.rcl.2009.04.004. [DOI] [PubMed] [Google Scholar]
- 30.Walker EA, Davis D, Mosher TJ. Rapidly progressive osteoarthritis: biomechanical considerations. Magn Reson Imaging Clin N Am. 2011;19:283–94. doi: 10.1016/j.mric.2011.02.008. [DOI] [PubMed] [Google Scholar]
- 31.Wheatley BB, Fischenich KM, Button KD, Haut RC, Haut Donahue TL. An optimized transversely isotropic, hyper-poro-viscoelastic finite element model of the meniscus to evaluate mechanical degradation following traumatic loading. J Biomech. 2015;48:1454–60. doi: 10.1016/j.jbiomech.2015.02.028. [DOI] [PMC free article] [PubMed] [Google Scholar]
- 32.Hunter DJ, Zhang YQ, Niu JB, Tu X, Amin S, Clancy M, Guermazi A, Grigorian M, Gale D, Felson DT. The association of meniscal pathologic changes with cartilage loss in symptomatic knee osteoarthritis. Arthritis Rheum. 2006;54:795–801. doi: 10.1002/art.21724. [DOI] [PubMed] [Google Scholar]
- 33.Englund M, Guermazi A, Lohmander SL. The role of the meniscus in knee osteoarthritis: a cause or consequence? Radiol Clin North Am. 2009;47:703–12. doi: 10.1016/j.rcl.2009.03.003. [DOI] [PubMed] [Google Scholar]
- 34.Goldring MB. Articular cartilage degradation in osteoarthritis. HSS J. 2012;8:7. doi: 10.1007/s11420-011-9250-z. [DOI] [PMC free article] [PubMed] [Google Scholar]
- 35.Sanchez C, Deberg MA, Piccardi N, Msika P, Reginster JY, Henrotin YE. Subchondral bone osteoblasts induce phenotypic changes in human osteoarthritic chondrocytes. Osteoarthritis Cartilage. 2005;13:988–97. doi: 10.1016/j.joca.2005.07.012. [DOI] [PubMed] [Google Scholar]
- 36.Zuo Q, Lu S, Du Z, Thor F, Yao J, Ross C, Indira P, Yin X. Characterization of nano-structural and nano-mechanical properties of osteoarthritic subchondral bone. BMC Musculoskelet Disord. 2016;17:367. doi: 10.1186/s12891-016-1226-1. [DOI] [PMC free article] [PubMed] [Google Scholar]
- 37.Bhattacharyya T, Gale D, Dewire P, Totterman S, Gale ME, Mclaughlin S, Einhorn TA, Felson DT. The clinical importance of meniscal tears demonstrated by magnetic resonance imaging in osteoarthritis of the knee. J Bone Joint Surg Am. 2003;85-A:4–9. doi: 10.2106/00004623-200301000-00002. [DOI] [PubMed] [Google Scholar]
- 38.Noble J, Hamblen DL. The pathology of the degenerate meniscus lesion. J Bone Joint Surg Br. 1975;57:180–6. [PubMed] [Google Scholar]
- 39.Sandmann GH, Adamczyk C, Garcia EG, Doebele S, Buettner A, Milz S, Imhoff AB, Vogt S, Burgkart R, Tischer T. Biomechanical comparison of menisci from different species and artificial constructs. BMC Musculoskelet Disord. 2013;14:324. doi: 10.1186/1471-2474-14-324. [DOI] [PMC free article] [PubMed] [Google Scholar]