

Abstract
The apoptosis machinery is compromised in liver cancer (LC). The underlying mechanism needs to be further investigated. Histone deacetylases (HDAC) have multiple and strong biochemical activities. This study tests a hypothesis that HDAC11 prevents LC cell (LCC) apoptosis via modulating the p53 gene transcription. In this study, the LC tissues were collected from patients with LC. The LCCs were purified by magnetic cell sorting. The gene transcription activities of the LCCs were analyzed by immunoprecipitation (IP) and chromatin IP. We observed that the LCCs expressed high levels of HDAC11, which was negatively correlated with the expression of p53 in LCCs. Further findings indicated that HDAC11 formed a complex with Egr1, the transcription factor of p53. HDAC11 induced Egr1 deacetylation and thus prevented the p53 gene transcription. Over expression of HDAC11 in liver cells inhibited the cell apoptosis. Inhibition of the expression of HDAC11 in LCCs promoted the LCC apoptosis. In conclusion, HDAC11 plays a critical role in the compromising the expression p53 in LCC, which can be reversed by the inhibition of HDAC11. To regulate HDAC11 may have therapeutic potential for LC treatment.
Keywords: Liver cancer, p53, HDAC11, apoptosis
Introduction
Liver cancer (LC) is cancer that starts in the liver, also known as hepatic cancer and primary hepatic cancer. LC is one of the leading death causes of human beings [1]. About 60 million people died of LC worldwide each year [2]. LC symptoms may include pain or a lump in the right side below the rib cage, abdominal swelling, yellowish skin, easy bruising, weight loss, and weakness [3]. The pathological types of LC include hepatocellular cancer and intrahepatic bile duct cancer [4]. The risk factors of LC have been suggested; such as alcoholic [4], hepatitis B infection [6], etc., however, the prevalence of LC still rises [4]. The pathogenesis of LC is to be further investigated.
It is proposed that the deregulation of apoptosis is one of the causative factors of cancer [7]. Apoptosis is also called as programmed cell death. It is a physiological phenomenon in multiple cell organisms. Biochemical events automatically occur in cells to lead to characteristic cell changes and death of the cells [8]. Apoptosis can also be regulated by certain biochemical events; such as tumor necrosis factor can trigger apoptosis in cells [9]; Bcl2 inhibits apoptosis [10]. The deregulation of apoptosis is found in LC cells (LCCs) [11]. It is suggested that to regulate apoptosis can facilitate the treatment of LC [12]. The Fas/Fas ligand pathway and p53 pathway are the major regulators of apoptosis; to activate either of which can trigger LCC apoptosis [13]. Yet, the precise mechanism of apoptosis regulation is still not fully understood.
Published data indicate that the deregulation of histone deacetylases (HDAC) is associated with the pathogenesis of LC [14]. HDAC is a group of enzyme involving in gene transcription. This enzyme removes acetyls from histones to let histones wrap chromatin more tightly to attenuate or inhibit gene transcription [15]. HDAC is also involved in the regulation of apoptosis in LC [14]. The deregulation of HDAC and p53 was found in the experimental LC by recent studies [16]. Based on above information, we hypothesize that HDAC down regulate p53 expression in LCCs to interfere with apoptosis of LCCs. To test the hypothesis, we collected human LCCs to be analyzed. The results showed that the p53 expression was lower in LCCs. The levels of HDAC11 were higher in LCCs. A negative correlation was detected between p53 and HDAC11 in LCCs. Inhibition of HDAC11 could reverse the expression of p53 in LCCs.
Materials and methods
Reagents
The antibodies of HDAC11 (c-5), p53 (DO-7), Egr1 (588), acetylated histone (acH)3 (AH3-120), acH4 (B-10) and RNA polymerase II (1.BB.61) were purchased from Santa Cruz Biotech (Santa Cruz, CA). The Annexin V kit, reagents for immunoprecipitation (IP) and chromatin IP (ChIP) were purchased from Sigma Aldrich (St. Louis., MO). The reagents for luciferase assay, real time RT-PCR and Western blotting were purchased from Invitrogen (Carlsbad, CA). The immune cell isolation kits were purchased from Miltenyi Biotech (San Diego, CA).
LC patients
Twenty LC patients were recruited into the present study at the Second Affiliated Hospital of Nanchang University. The demographic data of the patients are presented in Table 1. The diagnosis of LC was carried out by our surgeons and pathologists. All the LC patients were treated with surgery to remove the tumors by our surgeons. The surgically removed LC tissues were collected for further experiments. The marginal normal tissues were separated (confirmed by pathological procedures) used as controls. Patients with following conditions were excluded: Using immune suppressor or other antitumor medicines in the past two months; suffering from allergic disorders or other immune diseases; treated with radiotherapy. The using human tissue in the present study was approved by the Human Ethics Committee at Nanchang University. An informed written consent was obtained from each patient.
Table 1.
Demographic data of LC patients
| Male/female | 10/10 |
| Age | 61.3 ± 13.6 |
| HBsAg positive | 12 (60%) |
| Anti-HCV positive | 8 (40%) |
| Serum biochemistry tests | |
| Albumin | 3.8 ± 1.5 g/dl |
| Total bilirubin | 0.88 ± 0.5 mg/dl |
| ALT | 40.8 ± 8.6 U/l |
| AST | 41.2 ± 6.9 U/l |
| Creatinine | 0.96 ± 0.31 mg/dl |
| Alk-p | 78.6 ± 11.3 U/l |
| AFP | 18.5 ± 5.8 ng/ml |
| Tumor size | 2.8 ± 1.5 cm |
| Metastasis | 0 |
AFP: alpha-fetoprotein; Alk-p: alkaline phosphate; ALT: alanine aminotransferase; AST: aspartate aminotransferase; HBsAg: hepatitis B surface antigen; HCV: hepatitis C virus.
Preparation of LCCs (LCC) and normal liver cells (NLC)
The LC tissues and normal liver tissues were cut into small pieces and incubated with collagenase IV (1 mg/ml) for 2 h at 37°C with mild agitation. The samples were filtered through a cell strainer (100 µm first, then 70 µm). The single cells were collected by centrifugation. The immune cells, including CD3, CD19, CD14, CD11c/b, CD68 positive cells, were selected out by magnetic cell sorting (MACS) with commercial reagent kits following the manufacturer instructions. The remained cells were used as LCC or NLC.
Cell culture
The HEK293 cells (ATCC), LCCs and NLCs were cultured with DMEM supplemented with 10% fetal bovine serum, 100 U/ml penicillin, 0.1 mg/ml streptomycin and 2 mM L-glutamine. The medium was changed in 1 or 2 days. The cell viability was greater than 98% as checked by the Trypan blue exclusion assay.
Real time quantitative RT-PCR (RT-qPCR)
The total RNAs were extracted from the NLCs and LCCs using the TRIzol reagents. The cDNA was synthesized with a reverse transcription kit following the manufacturer instructions. The samples were amplified in a qPCR device with the SYBR Green Master Mix. The primers used in the present study include p53 (gtccagatgaagctcccaga and caagaagcccagacggaaac) and HDAC11 (tgtctacaaccgccacatct and cggtgcctgcattgtatacc). The results were presented as fold change against the internal housekeeping gene β-actin.
Preparation of protein extracts
The cells were lysed with a cell lysing buffer. The lysates were centrifuged at 15000 rpm for 10 min. The supernatant was collected and used as the cytosolic extracts. The pellets were incubated with a nuclear lysing buffer for 30 min. After centrifuging at 15000 rpm for 10 min, the supernatant was collected and used as the nuclear extracts. All the procedures were performed at 4°C.
Western blotting
The total proteins were extracted from the NLCs and LCCs, fractioned by SDS-PAGE, and transferred onto a PVDF membrane. The membrane was blocked by incubating with 5% skim milk for 30 min, incubated with the primary antibodies of interest or isotype IgG overnight at 4°C, washed with TBST (Tris-buffered saline Tween 20), incubated with the secondary antibodies for 1 h at room temperature and washed with TBST. The immune blots on the membrane were developed by the enhanced chemiluminescence and photographed with an imaging device.
Immunoprecipitation (IP)
The protein extracts were precleared by incubating with protein G sepharose for 2 h. The samples were centrifuged at 15000 rpm for 10 min. The supernatant was collected and incubated with antibodies of interest or isotype IgG overnight. The immune complexes were precipitated by incubating with protein G sepharose for 2 h. The proteins on the sepharose beds were eluted with an eluting buffer and analyzed by Western blotting. All the procedures were performed at 4°C.
Chromatin IP (ChIP)
The cells were fixed with 1% formalin for 15 min, lysed with a lysing buffer. The samples were sonicated to shear the DNA into small pieces and subjected to the IP procedures. The protein/DNA complexes on the sepharose needs were eluted with an eluting buffer. The DNA was recovered from the samples and analyzed by qPCR with the presence of TP53 promoter primers (ctgagagcaaacgcaaaagc and ggaaatggagttggggagga). The results were presented as fold change against the input. All the procedures were performed at 4°C.
Plasmids and luciferase activity assay
The plasmids of HDAC11, Egr1 and TP53 (tagged by a luciferase gene) were provided by the Sangon Biotech (Shanghai, China). HEK293 cells were transfected with these plasmids following the manufacturer’s instructions. Forty-eight hours after the transfection, the cells were collected. The expression of HDAC11 and Egr1 was assessed by Western blotting. The expression of TP53 was assessed by PCR. The luciferase activities were assessed using a Dual-Luciferase Reporter Assay System (Promega).
Assessment of apoptosis
The cells were collected from relevant experiments, stained with annexin V reagents and propidium iodide, and analyzed with a flow cytometer. The data were analyzed with software flowjo. Data from non-staining cells were used as a gating reference.
Overexpression of HDAC11 in NLCs
NLCs were prepared as described above. HDAC11-expressing plasmids were provided by Sangon Biotech (Shanghai, China). NLCs were transfected with HDAC11-expressing plasmids or control plasmids following the manufacturer’s instructions. The effects of plasmid transfection were assessed 48 h later with Western blotting.
Statistics
The data are presented as mean and SD. The difference between two groups was determined by Student t test. ANOVA followed by Dunnett’s t test or SNK test was used for multiple comparisons. P < 0.05 was set as a significant criterion.
Results
HDAC11 expression is higher in LCCs
Published data show that HDACs are associated with the pathogenesis of cancer [17]; the underlying mechanism is to be further investigated. Therefore, surgically removed LC tissues were collected from the operation rooms. The marginal normal tissues were collected to be used as normal liver tissues after confirmed by pathological examination. The LCCs and normal liver cells (NLC) were isolated from the tissues. The total RNAs were extracted from the LCCs and the NLCs; the samples were screened by RT-qPCR for the expression of the 11 subtypes of HDAC. The results showed that levels of HDAC1, 2, 6 and 11 were higher than the rest 7 subtypes of HDAC, while levels of HDAC11 were significantly higher in LCCs than that in NLCs (Figure 1A). The highly expression of HDAC11 by LCCs was further confirmed by analysis of Western blotting (Figure 1B).
Figure 1.
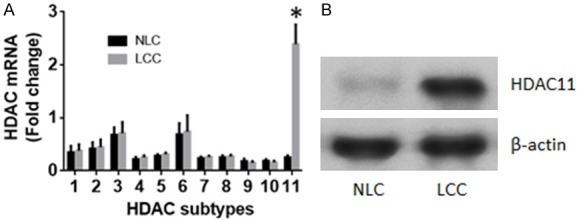
LCCs show higher levels of HDAC11. The surgically removed LC tissues were collected from 20 LC patients. The LCCs and NLCs were prepared. Total RNA and protein were extracted from the LCCs and NLCs. The samples were analyzed by RT-qPCR and Western blotting, respectively. A. The bars indicate the HDAC mRNA levels. B. The immune blots indicate the protein levels of HDAC11. The data of bars are presented as mean ± SD. *P < 0.01, compared with the NLCs. Samples from individual patients were analyzed individually. Each experiment was repeated 3 times.
Expression of p53 is negatively correlated with HDAC11 in LCCs
The deregulation of apoptosis is an important factor in the pathogenesis of cancer [18]. The dysfunction of p53 plays a role in the deregulation of apoptosis [19]. Thus, the data of Figure 1 imply that the HDAC11 may be associated with the dysfunction of p53 in LCCs. To test this, we examined the expression of p53 in LCCs. The data showed that moderately expression of p53 was detected in NLCs, which was significantly less in LCCs (Figure 2A, 2B). A negative correlation was detected between the data of HDAC11 and p53 in LCCs (Figure 2C). The data imply that HDAC11 may alter the expression of p53 in LCCs.
Figure 2.
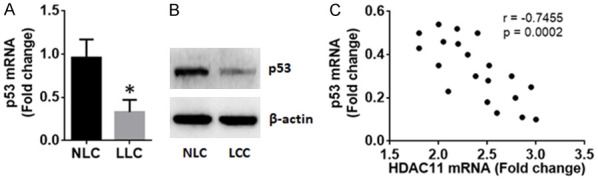
Expression of p53 and its correlation with HDAC11 in LCCs. The NLCs and LCCs were prepared the same as Figure 1. The samples were analyzed by RT-qPCR and Western blotting. A. The bars indicate the p53 mRNA levels. B. The immune blots indicate the p53 protein levels. C. The dot plots indicate the correlation between p53 mRNA and HDAC11 mRNA in LCCs. The data of bars are presented as mean ± SD. *P < 0.01, compared with the NLC. Samples from individual patients were analyzed individually. Each experiment was repeated 3 times.
HDAC11 prevents TP53 transcription factor from binding to the TP53 promoters
We next performed an immunoprecipitation (IP) assay with NLCs and LCCs. The results showed a complex of HDAC11 and Egr1, the transcription factor of TP53, in LCCs, which was significantly less in NLCs (Figure 3A). To test if such a physical contact between HDAC11 and Egr1 altering the acetylation status of Egr1, the cell lysates were precipitated with an anti-Egr1 antibody and stained with anti-Egr1 or an anti-acetylated lysine antibody. The results showed that levels of acetylated lysine were significantly less in LCCs (Figure 3B). Next, the binding of Egr1 to the TP53 promoter was assessed by ChIP assay with the samples. The results showed that levels of Egr1 were much less in LCCs than that of NLCs (Figure 3C). The results demonstrate that HDAC11 physically contacts Egr1 to deacetylate the Egr1 and prevents Egr1 from binding to the TP53 promoter in LCCs.
Figure 3.
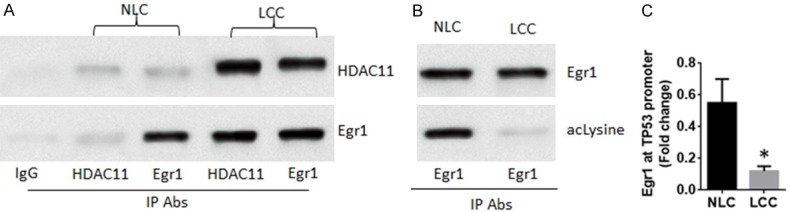
HDAC11 prevents Egr1 from binding to the TP53 promoters. The preparation of NLCs and LCCs were the same as Figure 1. A. IP data show a complex of HDAC11 and Egr1 in the NLCs and LCCs. B. The immune blots indicate the acetylated Egr1 levels in the NLCs and LCCs. C. The ChIP data show the Egr1 levels at the TP53 promoter locus in the NLCs and LCCs. The data of bars are presented as mean ± SD. *P < 0.01, compared with the NLC. Samples from individual patients were analyzed individually. Each experiment was repeated 3 times.
HDAC11 prevents the TP53 promoter transactivation in LCCs
Data of Figure 3 imply that HDAC11 may alter TP53 promoter activation status. To test this, samples from NLCs and LCCs were analyzed by ChIP. The results showed that levels of acetylated histone (acH)3, acH4 and RNA polymerase II (Pol II) were detected at the TP53 promoter locus of NLCs, which were significantly lower in LCCs after exposure to doxorubicin (Doxo) in the culture (Figure 4A-C). The results imply that HDAC11 may prevent the TP53 promoter activities. To corroborate the results, we constructed plasmids of HDAC11, Egr1 and a TP53 promoter luciferase reporter. Constructs of Egr1 and TP53 were transfected into HEK293 cells with or without HDAC11 constructs. Western blotting data showed that the transfection resulted in expression of HDAC11, Egr1 and TP53 in HEK293 cells (Figure 4D). Two days after the transfection, cells were analyzed for luciferase activities. The results showed that higher luciferase activities were detected in HEK293 cells transfected with Egr1 and TP53 constructs, which were significantly lower in those transfected with Egr1, TP53 and HDAC11 constructs (Figure 4E). The results demonstrate that HDAC11 can repress TP53 promoter activities.
Figure 4.
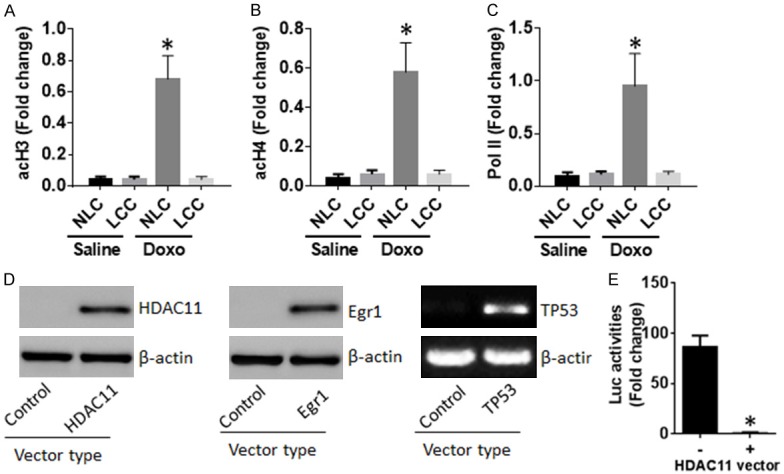
HDAC11 modulates TP53 promoter activities in NLC and LCC. (A-C) The preparation of NLC and LCC was the same as Figure 1. The nuclear extracts were analyzed by ChIP. The bars indicate the levels of acH3 (A), acH4 (B) and RNA polymerase II (Pol II; C) at the TP53 promoter locus of NLCs and LCCs. (D) HEK293 cells were transfected with plasmids of HDAC11, Egr1 and TP53, or control vectors. Two days later, the cells were analyzed by Western blotting and PCR respectively. The immune blots show the effects of the gene transfection. (E) The cells were analyzed by luciferase (Luc) activity assay. The bars indicate the luciferase activities in HEK293 cells. Doxo: Cells were exposed to doxorubicin (2 µM) in the culture. The data of bars are presented as mean ± SD. *P < 0.01, compared with the NLC (A-C) or cells without transfecting the HDAC11 vectors (E). The data represent 3 independent experiments.
Regulation of HDAC11 expression regulates p53 expression and LCC apoptosis
To further investigate the role of HDAC11 in regulation of LC apoptosis, NLCs were prepared and transfected with HDAC11-expressing plasmids to make the cells overexpressing HDAC11. The cells were then exposed to Doxo in the culture. The results showed that HDAC11 overexpression markedly suppressed expression of p53 and inhibited apoptosis in NLCs. On the other hand, inhibition of HDAC11 by exposing to TSA, a pan HDAC inhibitor, significantly increased p53 expression and apoptosis of LCCs (Figure 5).
Figure 5.
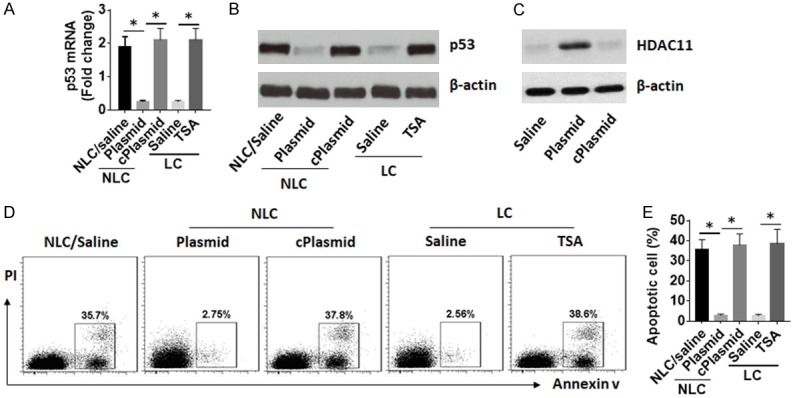
Inhibition of HDAC11 enhances LCC apoptosis. NLCs and LCCs were prepared as described above. The cells were treated with procedures denoted on the X axis of panel (A). Plasmid (or cPlasmid): NLCs were transfected with HDAC11-expressing plasmids (or control plasmids). TSA: The LCCs were exposed to TSA (1 mM) in the culture for 48 h. (A, B) The expression of p53 in NLCs and LCCs. (C) The results of HDAC11 overexpression in NLCs. (D) The gated dot plots show frequency of apoptotic cells. (E) Bars indicate summarized data of apoptotic cells of panel (D). Data of bars are presented as mean ± SD. *P < 0.01. The data represent 3 independent experiments.
Discussion
The present study revealed a previously unknown phenomenon that high levels of HDAC11 were detected in LCCs, which was negatively correlated with the levels of p53 in LCCs. The data suggest that increase in expression of HDAC11 represses expression of p53 in LCCs. The mechanistic evidence includes a complex of HDAC11 and Egr1, the p53 transcription factor, was detected in LCCs, which reduced acetylation of the Egr1, and thus, attenuated the p53 expression in LCCs.
The data showed that levels of p53 were lower in LCCs. p53 is an important molecule in induction of cancer cell apoptosis. The deregulation of p53, including mutation of p53 protein and reducing amounts of p53, is suggested to be associated with the pathogenesis of LC [20,21]. Hussain et al found that the dietary aflatoxin B-1 induced transversion of G:C to T:A at the 3rd base in codon 249 of the TP53 gene, which cooperated with hepatitis B virus in causing p53 mutations in LC [20]. Sun et al reported that inhibition of p53 prevented tumor cell apoptosis, while treating LCCs with triptolide increased LCC apoptosis via enhancing the expression of p53 [21]. Our data are in line with those previous studies by showing that the expression of p53 was markedly lower in LCCs.
The data show that levels of HDAC11 were higher in LCCs. Previous studies also found that deregulation of HDAC was associated with the pathogenesis of LC. It was reported that HDAC3 was expressed in LCCs, which was associated with self-renewal of LCCs via regulating expression of pluripotency factors [22]. Bae et al found that overexpression HDAC6 in LCCs and suggested that HDAC6 contributed to the tumorigenesis of LCC [14]. By screening the extracts of LCCs with the 11 subtypes of HDAC, we also found the high levels of HDAC3 and HDAC6 in LCCs, but the levels of HDAC3 and HDAC6 were also higher in NLCs and normal LCs, while levels of HDAC11 were markedly higher in LCCs than that in NLCs. The data suggest that HDAC11 may contribute to the pathogenesis of LC.
A complex of HDAC11 and Egr1 was detected in LCCs in the present study. Although HDACs are deacetylases for histone deacetylation originally, the enzymes deacetylating non-histone proteins were reported; such as Dasgupta et al reported that ac-SMC3 could be deacetylated by HDAC8 [23]. Alam et al found that SMC3, ERRα, and ARID1A were the non-histone substrates of HDACs [24]. Glozak comments that deacetylation of the non-histone proteins by HDACs opens a new field of discovery in the role of the dynamic acetylation and deacetylation on cellular function [25]. The present data revealed that the physical contact of HDAC11 and Egr1 induced the Egr1 deacetylation, which resulted in less Egr1 at the TP53 promoter locus and prevented the TP53 transcription. The data mechanistically demonstrate that HDAC11 interferes with the expression of p53 in LCCs.
The data showed that inhibition of HDAC11 enhanced the expression of p53 in LCCs and promoted the LCC apoptosis. Previous studies also found that using the pan inhibitor of HDAC could induce cancer cell apoptosis. Feng et al reported that TSA, the pan inhibitor of HDAC, in combination with silibinin induced G2/M cell cycle arrest and apoptosis in cancer cells [26]. Published data indicate that the pan-HDAC inhibitor, panobinostat, is high therapeutic potential therapy in both preclinical models and clinical cancer patients [27]. Our data are in line with the previous studies by showing that exposure to TSA also increased the LCC apoptosis, which has the potential to contributing the treatment of LC.
In summary, the present results showed that LCCs expressed high levels of HDAC11, lower levels of p53. A complex of HDAC11 and Egr1 was detected in LCCs, which caused deacetylation of Egr1 and reduced the p53 expression in LCCs. Inhibition of HDAC increased the LCC apoptosis, suggestion that HDAC11 contributes to the tumorigenesis; inhibition of HDAC can contribute to the treatment of LC.
Acknowledgements
This study was supported by a grant from the National Natural Science Foundation of China (#81460375).
Disclosure of conflict of interest
None.
References
- 1.Chen W, Zheng R, Baade PD, Zhang S, Zeng H, Bray F, Jemal A, Yu XQ, He J. Cancer statistics in China, 2015. CA Cancer J Clin. 2016;66:115–132. doi: 10.3322/caac.21338. [DOI] [PubMed] [Google Scholar]
- 2.Torre LA, Bray F, Siegel RL, Ferlay J, Lortet-Tieulent J, Jemal A. Global cancer statistics, 2012. CA Cancer J Clin. 2015;65:87–108. doi: 10.3322/caac.21262. [DOI] [PubMed] [Google Scholar]
- 3.Cheng Z, Li X, Ding J. Characteristics of liver cancer stem cells and clinical correlations. Cancer Lett. 2016;379:230–238. doi: 10.1016/j.canlet.2015.07.041. [DOI] [PubMed] [Google Scholar]
- 4.Ryerson AB, Eheman CR, Altekruse SF, Ward JW, Jemal A, Sherman RL, Henley SJ, Holtzman D, Lake A, Noone AM, Anderson RN, Ma J, Ly KN, Cronin KA, Penberthy L, Kohler BA. Annual report to the nation on the status of cancer, 1975-2012, featuring the increasing incidence of liver cancer. Cancer. 2016;122:1312–1337. doi: 10.1002/cncr.29936. [DOI] [PMC free article] [PubMed] [Google Scholar]
- 5.Turati F, Galeone C, Rota M, Pelucchi C, Negri E, Bagnardi V, Corrao G, Boffetta P, La Vecchia C. Alcohol and liver cancer: a systematic review and meta-analysis of prospective studies. Ann Oncol. 2014;25:1526–1535. doi: 10.1093/annonc/mdu020. [DOI] [PubMed] [Google Scholar]
- 6.Chang MH. Prevention of hepatitis B virus infection and liver cancer. Recent Results Cancer Res. 2014;193:75–95. doi: 10.1007/978-3-642-38965-8_5. [DOI] [PubMed] [Google Scholar]
- 7.Khan M, Maryam A, Qazi JI, Ma T. targeting apoptosis and multiple signaling pathways with icariside ii in cancer cells. Int J Biol Sci. 2015;11:1100–1112. doi: 10.7150/ijbs.11595. [DOI] [PMC free article] [PubMed] [Google Scholar]
- 8.Peng YT, Chen P, Ouyang RY, Song L. Multifaceted role of prohibitin in cell survival and apoptosis. Apoptosis. 2015;20:1135–1149. doi: 10.1007/s10495-015-1143-z. [DOI] [PMC free article] [PubMed] [Google Scholar]
- 9.Dai X, Zhang J, Arfuso F, Chinnathambi A, Zayed ME, Alharbi SA, Kumar AP, Ahn KS, Sethi G. Targeting TNF-related apoptosis-inducing ligand (TRAIL) receptor by natural products as a potential therapeutic approach for cancer therapy. Exp Biol Med (Maywood) 2015;240:760–773. doi: 10.1177/1535370215579167. [DOI] [PMC free article] [PubMed] [Google Scholar]
- 10.Siddiqui WA, Ahad A, Ahsan H. The mystery of BCL2 family: Bcl-2 proteins and apoptosis: an update. Arch Toxicol. 2015;89:289–317. doi: 10.1007/s00204-014-1448-7. [DOI] [PubMed] [Google Scholar]
- 11.Lu SC, Mato JM. S-Adenosylmethionine in cell growth, apoptosis and liver cancer. J Gastroenterol Hepatol. 2008;23(Suppl 1):S73–77. doi: 10.1111/j.1440-1746.2007.05289.x. [DOI] [PMC free article] [PubMed] [Google Scholar]
- 12.Wang F, Wang H, Sun X, Li M. Apoptosis-induction is a novel therapeutic strategy for gastrointestinal and liver cancers. Curr Gene Ther. 2015;15:193–200. doi: 10.2174/1566523214666141224100801. [DOI] [PubMed] [Google Scholar]
- 13.Liedtke C, Trautwein C. The role of TNF and Fas dependent signaling in animal models of inflammatory liver injury and liver cancer. Eur J Cell Biol. 2012;91:582–589. doi: 10.1016/j.ejcb.2011.10.001. [DOI] [PubMed] [Google Scholar]
- 14.Bae HJ, Jung KH, Eun JW, Shen Q, Kim HS, Park SJ, Shin WC, Yang HD, Park WS, Lee JY, Nam SW. MicroRNA-221 governs tumor suppressor HDAC6 to potentiate malignant progression of liver cancer. J Hepatol. 2015;63:408–419. doi: 10.1016/j.jhep.2015.03.019. [DOI] [PubMed] [Google Scholar]
- 15.Gallinari P, Di Marco S, Jones P, Pallaoro M, Steinkuhler C. HDACs, histone deacetylation and gene transcription: from molecular biology to cancer therapeutics. Cell Res. 2007;17:195–211. doi: 10.1038/sj.cr.7310149. [DOI] [PubMed] [Google Scholar]
- 16.de Conti A, Tryndyak V, Koturbash I, Heidor R, Kuroiwa-Trzmielina J, Ong TP, Beland FA, Moreno FS, Pogribny IP. The chemopreventive activity of the butyric acid prodrug tributyrin in experimental rat hepatocarcinogenesis is associated with p53 acetylation and activation of the p53 apoptotic signaling pathway. Carcinogenesis. 2013;34:1900–1906. doi: 10.1093/carcin/bgt124. [DOI] [PubMed] [Google Scholar]
- 17.De Souza C, Chatterji BP. HDAC inhibitors as novel anti-cancer therapeutics. Recent Pat Anticancer Drug Discov. 2015;10:145–162. doi: 10.2174/1574892810666150317144511. [DOI] [PubMed] [Google Scholar]
- 18.Muthu M, Cheriyan VT, Rishi AK. CARP-1/CCAR1: a biphasic regulator of cancer cell growth and apoptosis. Oncotarget. 2015;6:6499–6510. doi: 10.18632/oncotarget.3376. [DOI] [PMC free article] [PubMed] [Google Scholar]
- 19.Wang X, Simpson ER, Brown KA. p53: protection against tumor growth beyond effects on cell cycle and apoptosis. Cancer Res. 2015;75:5001–5007. doi: 10.1158/0008-5472.CAN-15-0563. [DOI] [PubMed] [Google Scholar]
- 20.Hussain SP, Schwank J, Staib F, Wang XW, Harris CC. TP53 mutations and hepatocellular carcinoma: insights into the etiology and pathogenesis of liver cancer. Oncogene. 2007;26:2166–2176. doi: 10.1038/sj.onc.1210279. [DOI] [PubMed] [Google Scholar]
- 21.Sun YY, Xiao L, Wang D, Ji YC, Yang YP, Ma R, Chen XH. Triptolide inhibits viability and induces apoptosis in liver cancer cells through activation of the tumor suppressor gene p53. Int J Oncol. 2017;50:847–852. doi: 10.3892/ijo.2017.3850. [DOI] [PubMed] [Google Scholar]
- 22.Liu C, Liu L, Shan J, Shen J, Xu Y, Zhang Q, Yang Z, Wu L, Xia F, Bie P, Cui Y, Zhang X, Bian X, Qian C. Histone deacetylase 3 participates in self-renewal of liver cancer stem cells through histone modification. Cancer Lett. 2013;339:60–69. doi: 10.1016/j.canlet.2013.07.022. [DOI] [PubMed] [Google Scholar]
- 23.Dasgupta T, Antony J, Braithwaite AW, Horsfield JA. HDAC8 inhibition blocks SMC3 deacetylation and delays cell cycle progression without affecting cohesin-dependent transcription in MCF7 cancer cells. J Biol Chem. 2016;291:12761–12770. doi: 10.1074/jbc.M115.704627. [DOI] [PMC free article] [PubMed] [Google Scholar]
- 24.Alam N, Zimmerman L, Wolfson NA, Joseph CG, Fierke CA, Schueler-Furman O. Structure-based identification of hdac8 non-histone substrates. Structure. 2016;24:458–468. doi: 10.1016/j.str.2016.02.002. [DOI] [PMC free article] [PubMed] [Google Scholar]
- 25.Glozak MA, Sengupta N, Zhang X, Seto E. Acetylation and deacetylation of non-histone proteins. Gene. 2005;363:15–23. doi: 10.1016/j.gene.2005.09.010. [DOI] [PubMed] [Google Scholar]
- 26.Feng W, Cai D, Zhang B, Lou G, Zou X. Combination of HDAC inhibitor TSA and silibinin induces cell cycle arrest and apoptosis by targeting survivin and cyclinB1/Cdk1 in pancreatic cancer cells. Biomed Pharmacother. 2015;74:257–264. doi: 10.1016/j.biopha.2015.08.017. [DOI] [PubMed] [Google Scholar]
- 27.Li X, Zhang J, Xie Y, Jiang Y, Yingjie Z, Xu W. Progress of HDAC inhibitor panobinostat in the treatment of cancer. Curr Drug Targets. 2014;15:622–634. doi: 10.2174/1389450115666140306152642. [DOI] [PubMed] [Google Scholar]